
Market Overview
| Study Period | 2020 - 2031 |
|---|---|
| Forecast Data Period | 2026 - 2031 |
| Base Year Market Size (2025) | 422.78 Million Liters |
| Market Volume (2026) | 433.01 Million Liters |
| Market Volume (2031) | 487.99 Million Liters |
| Growth Rate (2026 - 2031) | 2.42 % |
| Market Concentration | Medium |
Major Players *Disclaimer: Major Players sorted in no particular order Image © Mordor Intelligence. Reuse requires attribution under CC BY 4.0. | |
United Kingdom Lubricants Market Analysis by Mordor Intelligence
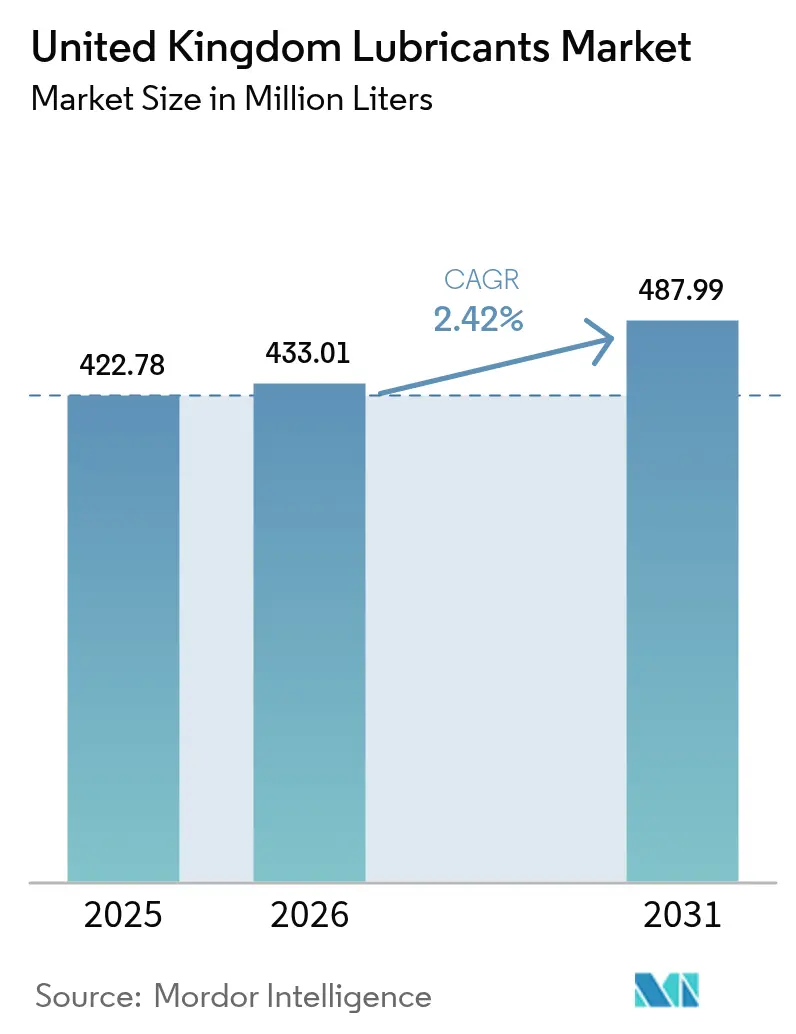
The United Kingdom Lubricants Market size in 2026 is estimated at 433.01 Million Liters, growing from 2025 value of 422.78 Million Liters with 2031 projections showing 487.99 Million Liters, growing at 2.42% CAGR over 2026-2031. Industrial demand linked to offshore wind, the reshoring of precision manufacturing, and the rollout of predictive-maintenance service models is accounting for a rising share of volume, even as conventional engine oil sales face a structural decline due to accelerating electric-vehicle (EV) uptake. Premium synthetic formulations continue to gain traction because Euro 7 emissions rules tighten performance requirements, fleet managers demand longer drain intervals, and plant operators seek to cut unplanned downtime. Suppliers with advanced additive chemistries, circular-economy base stocks, and IIoT-enabled fluid-monitoring platforms hold a competitive edge as industrial buyers prioritize reliability and compliance ahead of headline price. Meanwhile, shrinking domestic refining capacity is reshaping supply chain strategies, prompting blenders to adopt import hedging, specialty-grade localization, and re-refined feedstock integration to mitigate margin risk.
Key Report Takeaways
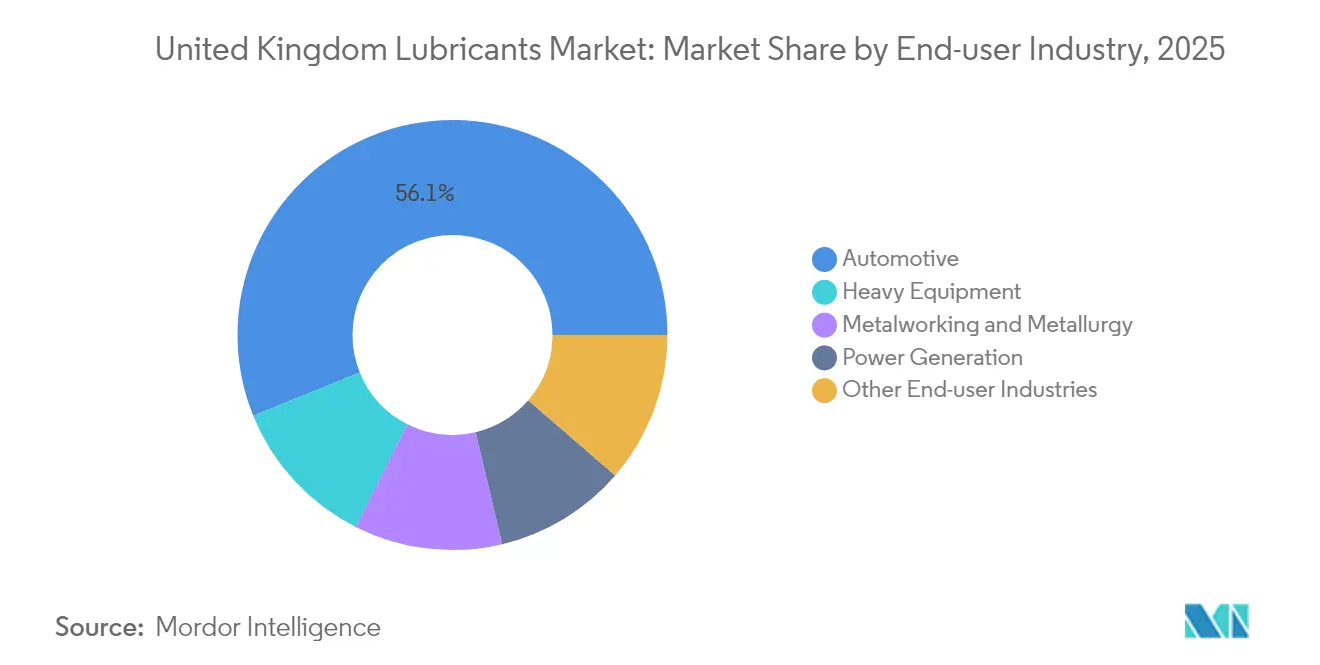
- By end-user industry, the automotive sector held 56.12% of the United Kingdom lubricants market share in 2025, whereas the power generation sector is projected to advance at a 2.85% CAGR through 2031.
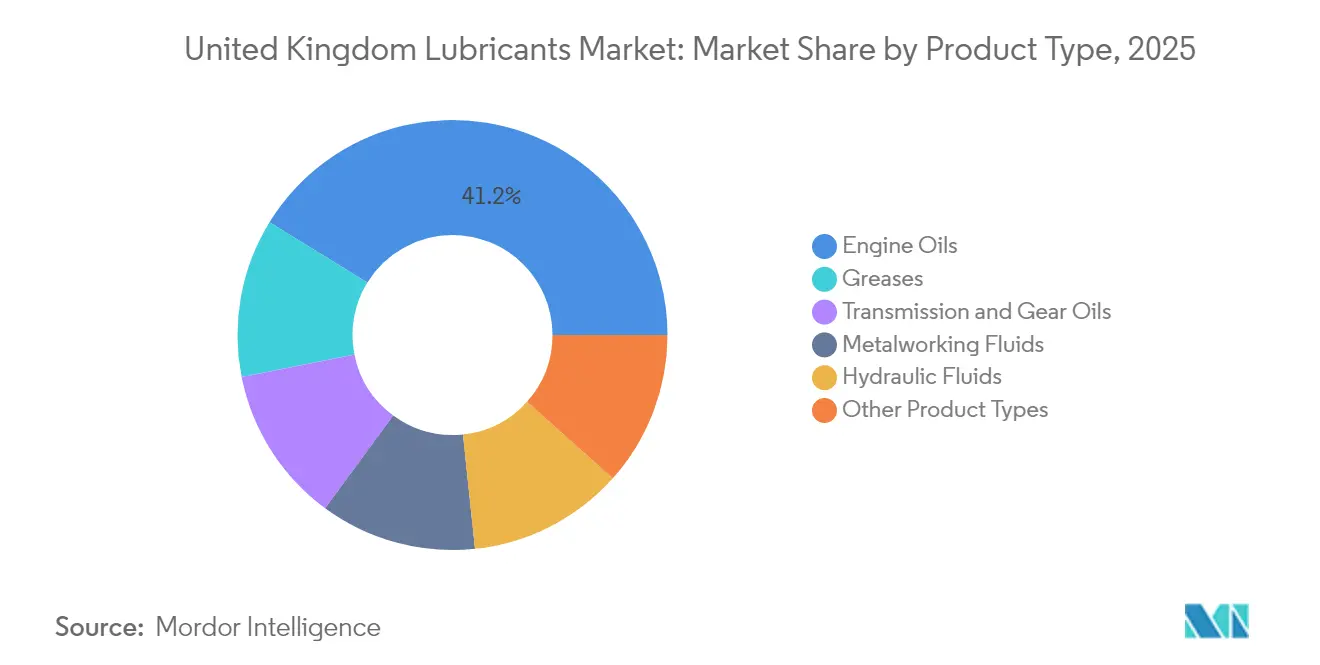
- By product type, engine oils commanded 41.21% of the United Kingdom lubricants market size in 2025, while greases are projected to grow at a 2.6% CAGR through 2031.
Note: Market size and forecast figures in this report are generated using Mordor Intelligence’s proprietary estimation framework, updated with the latest available data and insights as of 2026.
United Kingdom Lubricants Market Trends and Insights
Drivers Impact Analysis*
| Driver | (~) % Impact on CAGR Forecast | Geographic Relevance | Impact Timeline |
|---|---|---|---|
| Euro 7 / UK CO₂-fleet rules spur premium synthetics | +0.8% | National, commercial-vehicle corridors | Medium term (2-4 years) |
| Manufacturing reshoring programmes | +0.6% | Midlands, North England, Central Belt Scotland | Medium term (2-4 years) |
| Offshore-wind build-out needs long-life greases | +0.4% | Scottish and North Sea coastlines | Long term (≥ 4 years) |
| IoT-enabled lube-as-a-service adoption | +0.3% | Manchester, Birmingham, Glasgow industrial hubs | Long term (≥ 4 years) |
| Circular-economy mandates boost re-refined oils | +0.2% | Early uptake in London and Edinburgh | Medium term (2-4 years) |
| Source: Mordor Intelligence | |||
Euro 7 Emissions Standards Drive Premium Synthetic Adoption
Euro 7 rules, effective in 2025, impose tighter particulate and NOx thresholds that mineral oils struggle to meet, steering fleets toward synthetics with higher oxidation resistance and better low-viscosity film strength. Field data show that synthetics deliver 15–20% longer service life, reducing downtime and total ownership costs despite higher list prices[1]. UK commercial-vehicle registrations climbed 8.2% in 2024, multiplying demand for Euro 7-grade lubricants in logistics, construction, and municipal fleets. Suppliers with proprietary additive packages enjoy margin upside, while legacy mineral producers retreat to price-sensitive legacy niches.
Manufacturing Reshoring Programmes Boost Industrial Lubricant Demand
Domestic output rose 3.1% in 2024 as firms relocated production from Asia, lifting consumption of metalworking fluids, hydraulic oils, and NSF-approved food-grade lubricants. Government incentives worth GBP 4.5 billion through 2026 target aerospace, electronics, and renewable-energy equipment, each rich in lubrication points. Midlands and Northern clusters report 25–30% spikes in industrial-fluid orders as greenfield plants ramp up, favoring suppliers with technical service teams and rapid-response warehouses.
Offshore Wind Expansion Creates Specialized Grease Market
Capacity is slated to reach 50 GW by 2030, with 70% of this concentrated in Scottish waters, where subarctic temperatures and salt spray accelerate component wear. Modern turbines contain 200–400 kg of grease across bearings, pitch systems, and yaw drives, requiring marine-grade chemistries that last five to seven years between relubrication visits[2]. Long-life formulas command price premiums of 40–60% and reward R&D investments from multinational blenders.
IoT Integration Transforms Lubrication Service Models
Factory managers adopt sensor-rich predictive-maintenance platforms that schedule fluid changes based on condition rather than calendar benchmarks. Shell’s LubeAnalyst cut unplanned downtime by 35% at United Kingdom sites through real-time alerts and auto-reorder APIs. Subscription analytics lock in repeat revenue and reposition lubricants as a managed service, tilting competitive advantage toward suppliers with digital diagnostics.
Restraints Impact Analysis*
| Restraint | (~) % Impact on CAGR Forecast | Geographic Relevance | Impact Timeline |
|---|---|---|---|
| Accelerating EV parc lowers engine-oil volumes | -0.7% | Urban centers nationwide | Medium term (2-4 years) |
| Volatile crude and additive feedstock prices | -0.4% | Import-dependent supply chains | Short term (≤ 2 years) |
| Shrinking base-oil refining capacity | -0.3% | All UK distribution networks | Long term (≥ 4 years) |
| Source: Mordor Intelligence | |||
Electric Vehicle Adoption Erodes Traditional Engine-Oil Demand
EV registrations surged 38% in 2024 to reach 315,000 units, accounting for 18.1% of new-car sales and reducing engine oil demand per vehicle. Fleet data indicate that electric vans reduce lubricant use by 60–70% compared to diesel models, as drivetrains shift to sealed bearings and coolant-damped power electronics. With a ban on new internal-combustion engine sales from 2030, engine oil volumes are expected to face permanent contraction despite the emergence of EV thermal-management fluids.
Volatile Feedstock Costs Pressure Margin Sustainability
Brent traded between USD 70 and USD 95 per barrel in 2024, while specialty additive prices spiked amid supply disruptions, resulting in 5–8% swings in finished-fluid costs. Currency volatility exacerbates input uncertainty for small blenders that lack long-term procurement leverage, leading to ad-hoc price adjustments that erode customer loyalty in price-sensitive segments.
*Our forecasts treat driver/restraint impacts as directional, not additive. The impact forecasts reflect baseline growth, mix effects, and variable interactions.
Segment Analysis
By End-user Industry: Automotive Dominance Faces Electrification Pressure
The automotive segment accounted for 56.12% of the UK lubricants market in 2025, reflecting the nation’s 32 million-vehicle parc and dense commercial fleet activity. The UK lubricants market size tied to the automotive sector is forecast to decelerate as electrification advances; yet, premium synthetics for Euro 7 diesel vans and light trucks continue to support both volume and value. Large fleet operators now prioritize longer drain intervals and warranty-compliant low-SAP formulations to lower the total cost of ownership. Meanwhile, plant-based manufacturing reshoring reallocates lubricant demand toward heavy equipment in new gigafactories and food-processing lines, gradually trimming the automotive share.
Power generation currently holds only a single-digit percentage but is expected to register the fastest 2.85% CAGR as offshore wind capacity scales. Turbine OEMs mandate tailored ester-enhanced fluids and water-resistant greases that can run for seven-year intervals between servicing, driving high-unit-value sales. Construction equipment, marine, and aerospace collectively stabilize base-load volumes through mixed machinery parks that rely on hydraulic, gear, and compressor oils. Automotive suppliers reposition R&D budgets toward EV thermal-management fluids, while industrial specialists invest in field-service teams to support power-plant operators, indicating a gradual dilution of vehicle-centric revenue concentration.

By Product Type: Engine Oils Lead Despite EV Headwinds
Engine oils captured 41.21% of the 2025 volume, confirming their historical primacy in the UK lubricants market share. The share will decline but remain substantial through 2031 thanks to the legacy internal-combustion parc and Euro 7 demand for premium synthetics. The UK lubricants market size for engine oils is expected to shift from mineral to mid-SAPS and full-SAPS blends, characterized by lower volatility and improved low-ash profiles.
Greases top the growth leaderboard at a 2.6% CAGR, propelled by wind-turbine main-bearing requirements and factory automation that installs centralized grease-feeding systems. Transmission and gear oils post solid mid-single-digit volume, underpinned by heavy-duty truck activity and advanced manufacturing robotics. Metalworking fluids receive a boost from precision aerospace machining lines, although health and safety regulations are accelerating the adoption of boron-free and low-formaldehyde chemistries. Specialty compressor, transformer, and refrigeration oils fill high-margin niches shielded from commodity pricing battles due to stringent OEM technical approvals.
Geography Analysis
Regional consumption patterns align with industrial heritage, infrastructure development, and renewable energy investment. Scotland commands disproportionate volumes of marine-grade turbine greases, holding the lion’s share of the 70% capacity located in North Sea waters. Aberdeen service hubs anchor supply chains that ferry specialty fluids to offshore platforms via purpose-built vessels.
The Midlands corridor, stretching from Coventry to Birmingham, remains the single largest automotive lubricant pocket, absorbing roughly 35% of engine and gear oil demand, thanks to its dense OEM and Tier-1 supply chains. Heavy-equipment OEMs (original equipment manufacturers) operating in Stafford and the East Midlands are further deepening their hydraulic-fluid requirements. Northern England’s Manchester-Sheffield axis sustains robust metalworking-fluid consumption due to legacy steel and precision engineering clusters, while regional development funds lure battery and composite-material plants that bring fresh lubrication points.
London and the Southeast contribute sizable commercial-vehicle volumes through logistics, e-commerce fulfillment, and construction, despite passenger-car electrification lagging behind the national curve. Wales captures incremental growth from wind component manufacturing and port logistics tied to Celtic Sea offshore projects. Brexit-driven reshoring amplifies the strategic importance of local blending facilities near each consumption hub, reducing lead times and shielding buyers from cross-Channel freight exposure.
Value Chain Analysis
The UK lubricants value chain begins with base oils and additive chemistries, which feed finished-lubricant blending. With domestic base-oil availability tightening, supply increasingly relies on imports and on local blenders and manufacturers such as FUCHS Lubricants (UK) plc, Exol Lubricants, Pennine Lubricants, SAR Lubricants, and Midland Oil, supported by in-house QA/testing and batch traceability to meet OEM and industrial specifications.
Manufacturing and packaging then flow into a multi-tier distribution network covering direct-to-industry bulk delivery, workshop and fleet channels, and independent distributors. Certas Lubricant Solutions provides nationwide coverage through lubricant supply, storage, and technical services, often through partnerships with global lubricant producers (for example, Shell, Castrol, and Q8Oils) to broaden grade availability and approvals. A key operational anchor is FUCHS Stoke-on-Trent, which is cited with 90,000 metric tonnes of annual production capacity, underscoring the role of UK-based blending and filling assets in shortening lead times for industrial hubs and offshore service bases.
Competitive Landscape
The United Kingdom Lubricants Market is moderately consolidated. Shell adds digital analytics to bulk-fluid contracts, BP pilots bio-based ester chemistries, while ExxonMobil upgrades Fawley refinery to secure specialty base-oil supply. Strategic pillars focus on R&D for EV-specific fluids, localized blending to offset declining refinery output, and IoT service models that integrate condition monitoring into every liter sold. Market participants with balanced automotive-industrial portfolios and proprietary additive know-how are best positioned to withstand the twin headwinds of EV substitution and feedstock volatility.
United Kingdom Lubricants Industry Leaders
-
ExxonMobil Corporation
-
TotalEnergies
-
Shell plc
-
BP p.l.c.
-
Chevron Corporation
- *Disclaimer: Major Players sorted in no particular order

Market Opportunities and Future Outlook
Industrial and specialty lubrication leaves room for suppliers that price reliability, compliance, and service outcomes rather than commodity performance alone. Offshore wind operations in Scotland and along the North Sea coastline continue to build out the installed base that uses long-life, water-resistant greases and condition-monitored lubricants. At the same time, UK factory users are adopting IoT-enabled lubrication service models, including condition monitoring linked to automated replenishment, which increases demand for diagnostics, technical support, and higher-margin synthetic and specialty fluids.
Supply-side upgrades and policy initiatives also translate into concrete capacity and risk-management options. In March 2026, Exol Lubricants installed a new blending vessel at its Rotherham plant, with additional vessels planned for late 2026 and early 2027. In February 2026, FUCHS commissioned site investments at Stoke-on-Trent, adding two new filling lines and Siemens Manufacturing Execution System (MES), designed to support higher throughput and tighter quality control for complex formulations. Separately, in May 2026 the UK Government announced a GBP 350 million Critical Chemicals Resilience Fund, with program design beginning in summer 2026, and DESNZ targeted autumn 2026 for publishing a downstream oil sector strategy, both of which reinforce attention on resilient domestic chemicals and downstream supply chains feeding lubricant blending and distribution.
Recent Industry Developments
- July 2026: FUCHS Lubricants (UK) plc announced an investment in a new quality control laboratory at its Stoke-on-Trent manufacturing facility, including the installation of two new Inductively Coupled Plasma (ICP) analysers. The added analytical capacity supports faster verification of increasingly tight specifications and improves responsiveness for industrial and OEM-approved lubricant supply in the UK.
- May 2026: TotalEnergies and Stellantis renewed and expanded their strategic partnership in Europe to develop and deliver co-branded engine oils aligned with Stellantis FPW harmonized specifications. The move raises the bar for verified approvals in the aftermarket and supports premium, OEM-aligned formulations as a competitive differentiator for conventional powertrain lubricants.
- May 2026: Verification of Lubrication Specifications (VLS) published updated guidance on lubricant specifications and performance claims to reduce ambiguity for end-users. Clearer guidance increases scrutiny on product claims and documentation, pushing suppliers and distributors to strengthen compliance, traceability, and technical support across workshop and fleet channels.
Research Methodology Framework and Report Scope
Market Definition and Coverage
For this study, the market covers finished lubricants consumed within the United Kingdom across automotive and industrial uses, measured as the volume sold into the country in a given year, regardless of supplier origin.
Scope exclusions: We exclude base oils traded as feedstock, additives sold as standalone chemicals, and service-only revenues such as oil change labor.
Segmentation Overview
- By End-user Industry
- Automotive
- Heavy Equipment
- Metalworking and Metallurgy
- Power Generation
- Other End-user Industries
- By Product Type
- Engine Oils
- Transmission and Gear Oils
- Hydraulic Fluids
- Metalworking Fluids
- Greases
- Other Product Types
Data Sources, Market Sizing, and Validation
Desk Research
To ground the model, we start with public signals that explain how large the addressable lubricant demand pool can be in the United Kingdom. This includes vehicle parc and registrations from sources such as the UK Department for Transport, manufacturing output and turnover series from the UK Office for National Statistics, and energy and industrial activity releases from sources such as the UK Department for Energy Security and Net Zero.
We also use trade and activity context from sources such as HM Revenue and Customs trade statistics, the Society of Motor Manufacturers and Traders updates, and standards and performance documents from sources such as SAE and ACEA, because these help interpret drain intervals, grade shifts, and specification upgrades. Company annual reports, investor presentations, trade association pages, and reputable press are used to cross-check channel exposure and product focus, and a paid subscription for lubricants-specific market information is used selectively to validate typical application splits and terminology mapping. These desk sources are not exhaustive, and many other public references were used for data collection, validation, and clarification.
Primary Interviews and Surveys
Primary work is used to convert activity indicators into realistic lubricant consumption, then to pressure test assumptions that are hard to observe in public datasets. Interviews included lubricant blenders and marketers, distributors and workshops, and industrial maintenance and procurement roles across the UK, so gaps in drain intervals, viscosity grade migration, and industrial changeover cycles could be addressed with the most relevant phrasing for each channel.
Distribution of primary research fieldwork respondents
| Company type | Respondent position |
|---|---|
| Top tier: 25% | CXOs: 18% |
| Mid tier: 56% | Functional/Unit leaders: 36% |
| Smaller Players: 19% | Managers: 46% |
Market-Sizing & Forecasting
Sizing is built from a top-down demand reconstruction where vehicle parc, mileage proxies, service intervals, and typical sump fill volumes are converted into automotive lubricant consumption. That is then combined with industrial demand tied to manufacturing activity, equipment intensity, and maintenance cycles. After the demand pool is formed, we corroborate totals with selective bottom-up approximations such as sampled distributor throughput, channel checks on product mix by application, and a few supplier roll-ups where coverage is clear enough to be useful.
Key inputs used in the model include the passenger and commercial vehicle parc trend, the mix shift between ICE, hybrids, and EVs (which changes engine oil intensity), drain interval evolution in workshops and fleets, industrial output movements by subsector, and the shift toward higher performance grades that can change liters per change and consumption frequency. Forecasting is run using scenario analysis, since electrification pace, industrial cycles, and maintenance behavior can move together and a single trend line can miss inflection points. Where bottom-up visibility is incomplete, gaps are handled by applying validated channel shares and usage rates from interviews, followed by a consistency pass against implied per-vehicle and per-industry consumption.
Data Validation & Update Cycle
Outputs are triangulated against independent signals such as vehicle activity, industrial production direction, and known changes in lubricant specifications that typically alter consumption per unit. If a segment shows an unusual jump, we re-check the underlying drivers, revisit unit conversions, and, in some cases, re-contact respondents to confirm whether the change is real or driven by timing.
Before sign-off, the work is reviewed in steps so outliers are challenged and assumptions are traceable back to sources and interview notes. Reports are refreshed annually, with interim updates triggered by material events such as regulation changes, major capacity moves, or sharp swings in automotive and industrial activity. Right before delivery, a fresh pass is completed so clients receive the latest updated view.
Mordor Intelligence's United Kingdom Lubricants Market Size Measured Against Other Published Estimates
It is common to see different market sizes for UK lubricants because some publications report revenue and others report physical volume, and because automotive-only scopes sometimes get read as total lubricants. Gaps also come from how fast prices are assumed to rise, whether older base years are used, and how drain intervals are generalized across fleets and industry.
Some published figures roll up lubricants as a value number and can mix in broader lubricant-related revenue lines that do not map cleanly to liters consumed. In Mordor Intelligence, the market is sized in liters for finished lubricants consumed in the United Kingdom, with base oils and standalone additives kept outside scope.
Benchmark comparison
| Source | Market Size | Gaps in Research Methodology |
|---|---|---|
| Mordor Intelligence | USD 0.42 B (2025) | |
| Industry Publisher A | USD 5.85 B (2023) | Presented as a value market, so the total is heavily influenced by assumed pricing and currency timing, and it may bundle adjacent lubricant-related revenue that is not strictly finished-lubricant consumption. |
| Market Tracker B | USD 2.93 B (2024) | This estimate is limited to automotive lubricants, which leaves out industrial lubricant demand and related applications that are part of a total lubricants view. |
Overall, the spread is mainly explained by value versus volume reporting and by total lubricants versus automotive-only coverage. Our checks keep the liters-based total tied to observable UK activity drivers and repeatable conversion factors, which makes year to year updates more consistent.
Key Questions Answered in the Report
How large is the UK lubricants market in 2026?
The market stands at 433.01 million liters in 2026. It is expected to grow to 487.99 million liters by 2031.
Which end-user sector consumes the most lubricants?
Automotive accounts for 56.12% of 2025 volume, although its share will decline as EVs gain traction.
Which product category is expanding the fastest?
Greases lead with a 2.6% CAGR due to offshore wind-turbine demand.
How will electric vehicles affect lubricant demand?
EVs remove engine-oil requirements and can cut per-vehicle lubricant volumes by up to 70%.
What regional cluster shows the strongest growth?
Scotland is growing quickly as 70% of UK offshore wind capacity drives demand for marine-grade turbine greases.