
Market Overview
| Study Period | 2020 - 2031 |
|---|---|
| Forecast Data Period | 2026 - 2031 |
| Base Year Market Size (2025) | USD 3.84 Billion |
| Market Size (2026) | USD 4.19 Billion |
| Market Size (2031) | USD 6.48 Billion |
| Growth Rate (2026 - 2031) | 9.15 % |
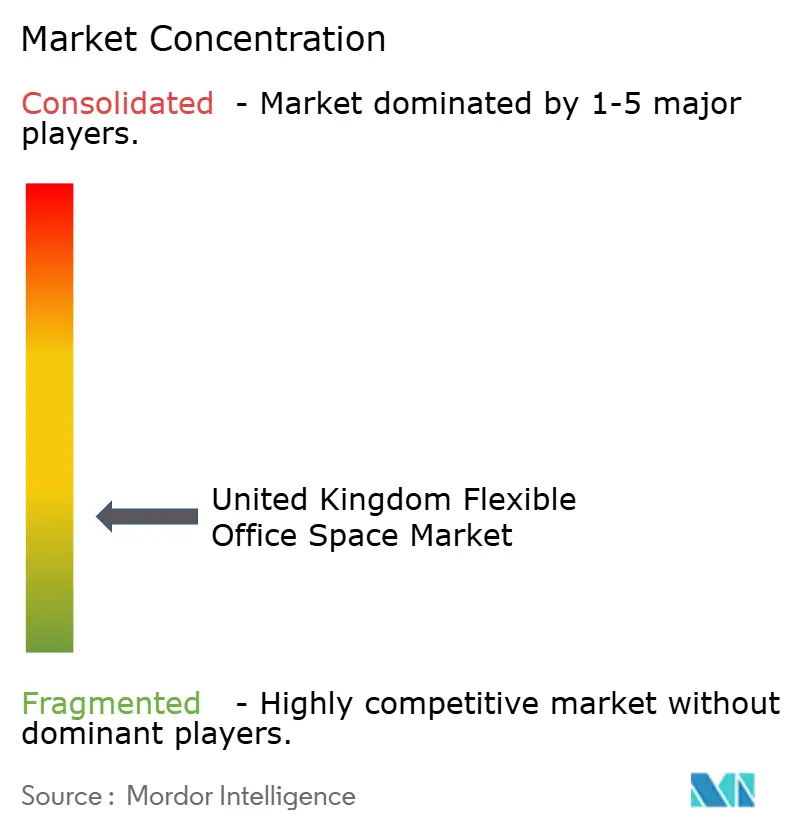
| Market Concentration | Low |
Major Players *Disclaimer: Major Players sorted in no particular order Image © Mordor Intelligence. Reuse requires attribution under CC BY 4.0. | |
United Kingdom Flexible Office Space Market Analysis by Mordor Intelligence
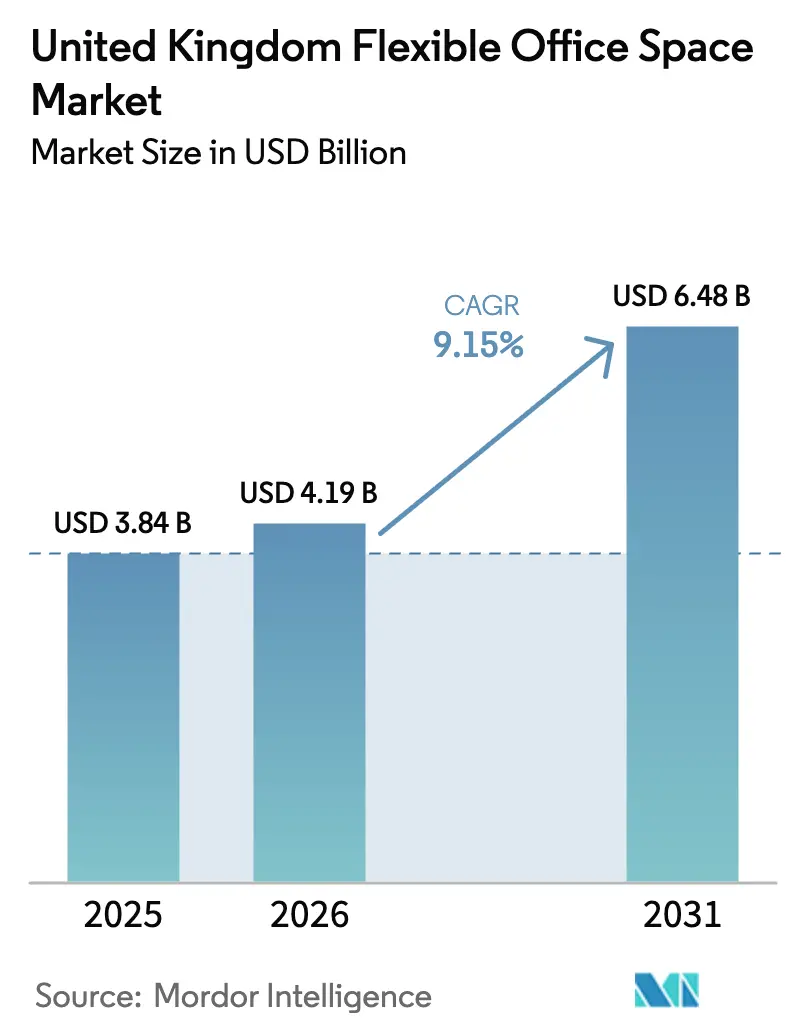
The UK flexible office market size was valued at USD 3.84 billion in 2025 and estimated to grow from USD 4.19 billion in 2026 to reach USD 6.48 billion by 2031, at a CAGR of 9.15% during the forecast period (2026-2031). This growth reflects employers embedding hybrid working into long-term real-estate strategies, the April 2024 “day-one” flexible-working law, and renewed investor appetite for income-flexible assets. Prime rents in London’s City Core are rising 5.4% annually, favoring operators that offer sustainability-certified space while limiting speculative development. Consolidation continues as large platforms deploy asset-light franchise models to expand regionally; at the same time, regional specialists use local knowledge to secure Grade B buildings and reposition them for mid-market demand. Operators that layer in technology-enabled booking, energy management, and wellness amenities stay ahead of rising operating costs and generate pricing power in premium locations[1]Department for Business and Trade, “Flexible Working Regulations 2024,” gov.uk.
Key Report Takeaways
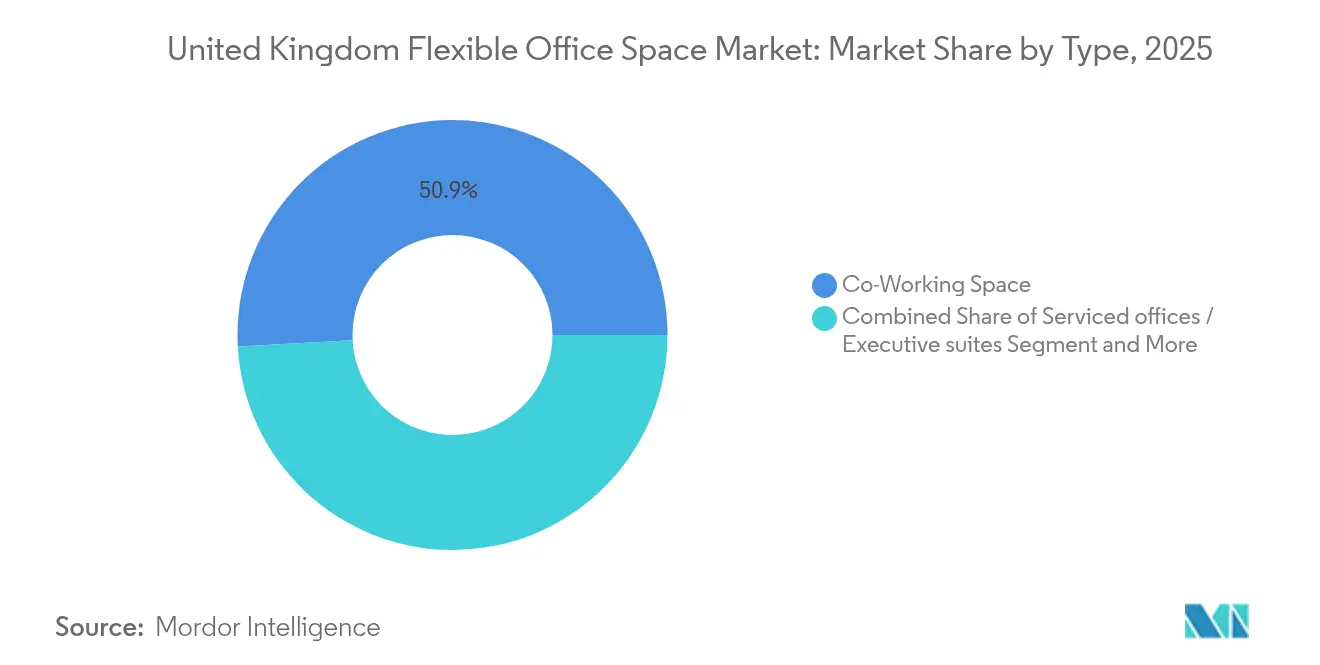
- By type, co-working captured 50.85% of UK flexible office market share in 2025, and Others (hybrid + virtual) is forecast to post a 10.35% CAGR through 2031.
- By sector, IT commanded 38.72% share of the UK flexible office market size in 2025, while BFSI is set to grow 10.60% CAGR to 2031.
- By end use, enterprises held 52.65% share of the UK flexible office market size in 2025; startups + others will expand at an 10.55% CAGR through 2031.
- By Country, England led with 81.85% revenue share in 2025; Scotland is advancing at an 10.90% CAGR through 2031.
Note: Market size and forecast figures in this report are generated using Mordor Intelligence’s proprietary estimation framework, updated with the latest available data and insights as of 2026.
United Kingdom Flexible Office Space Market Trends and Insights
Drivers Impact Analysis*
| Drivers | (~) % Impact on CAGR Forecast | Geographic Relevance | Impact Timeline |
|---|---|---|---|
| Strong demand for hybrid work solutions across London and regional cities | 3.2% | England dominant, Scotland emerging | Medium term (2-4 years) |
| High adoption by technology, creative, and professional services sectors | 2.8% | London core, Manchester, Birmingham spillover | Long term (≥ 4 years) |
| Investor interest in flexible office portfolios as a resilient asset class | 1.9% | Global capital, UK focus | Short term (≤ 2 years) |
| Growing demand for sustainability-certified and wellness-integrated workspaces | 1.5% | London, Edinburgh, major cities | Long term (≥ 4 years) |
| Expansion of global co-working brands alongside strong local operators | 1.3% | National, concentrated in tier-1 cities | Medium term (2-4 years) |
| Source: Mordor Intelligence | |||
Strong Demand for Hybrid Work Solutions Across London and Regional Cities
The demand for hybrid work solutions continues to grow, driven by evolving workplace policies and employee preferences. What began as a temporary measure during the pandemic has now solidified into a permanent fixture. Following the April 2024 regulation allowing staff to request flexibility from day one, hybrid working has transitioned into a standard policy. In this evolving landscape, large employers find themselves navigating a divided market. While half of these employers still mandate full-time attendance, a notable 28% of workers have adopted a split-week approach. This shift has created a pressing demand for desks that can be adjusted on a daily basis. In response to this duality, corporations are strategically positioning satellite hubs in cities like Manchester and Birmingham. This move not only alleviates commuter stress but also serves as a countermeasure against the soaring rents in London. Operators are adeptly tapping into this demand, offering multisite access passes that seamlessly combine the allure of city-center prestige with the practicality of suburban convenience. Furthermore, a legal mandate now requires meaningful consultations before any rejection of flexible requests. This has significant implications: it integrates flexible office budgets into long-term profit and loss considerations, transforming what was once viewed as a discretionary expense into a pivotal strategic imperative.
High Adoption by Technology, Creative, and Professional Services Sectors
The increasing demand for flexible office spaces is reshaping how businesses operate across various sectors. Digital firms are increasingly opting for plug-and-play offices, enabling teams to swiftly initiate product sprints, onboard gig talent, and conduct client hackathons—all without the burden of capital expenditure. Major financial institutions, in a bid to attract top coding talent, are adopting a culture reminiscent of the tech industry. A testament to this shift is WeWork's expansive 286,000 square-foot hub in Canary Wharf, now a beacon of the banking, financial services, and insurance (BFSI) sector's embrace. For creative agencies and consultancies, flexible office spaces have evolved into pivotal tools for enhancing client experiences—serving as dynamic environments for ideation, prototyping, and showcasing results. This demand has prompted operators to incorporate specialized features like podcast studios, immersive demo rooms, and privacy booths that meet legal standards. Furthermore, the clustering of diverse industries in major urban centers not only boosts deal flow but also allows tenants to seamlessly transition from casual coffee discussions to formal contracts. This dynamic not only amplifies the advantages of networking but also ensures consistent occupancy for operators.
Investor Interest in Flexible Office Portfolios as a Resilient Asset Class
Flexible office spaces have emerged as a resilient asset class, attracting significant investor interest due to their adaptability and strong financial performance. In the face of the 2023-2024 rate-hike cycle, flexible spaces proved more resilient than traditional offices, thanks to operators' ability to adjust license prices monthly. This adaptability hasn't gone unnoticed by institutional investors: in the first half of 2024, the UK accounted for a significant EUR 4.1 billion (USD 4.51 billion) of European office transactions, representing 29% of the continent's total volume. Sale-and-manage-back agreements are becoming a strategic move for landlords, allowing them to mitigate risks by entrusting operations to seasoned brands. These brands not only ensure a baseline rent but also offer a share in the profit upside. Meanwhile, REIT conversions, like Sirius Real Estate’s BizSpace, are tapping into more affordable capital sources to finance their renovation projects. Even as prime yields tighten, the service-driven margins of flexible assets bolster targeted Internal Rate of Returns (IRRs). This financial cushion remains effective even when headline rents stabilize, positioning flexible offices as a safeguard against both vacancies and inflationary pressures.
Growing Demand for Sustainability-Certified and Wellness-Integrated Workspaces
The demand for sustainability-certified and wellness-integrated workspaces is witnessing significant growth as businesses and occupiers prioritize environmentally responsible and employee-centric environments. Government consultations hint at stricter Energy Performance rules, with mandatory disclosures and potential leasing penalties looming by 2027. Today, occupiers prioritize providers boasting BREEAM Excellent ratings and clear zero-carbon roadmaps; those that don't risk facing obsolescence premiums upon lease renewal. In response, operators are equipping spaces with sensors that adjust lighting, recycle heat, and provide real-time data on tenant dashboards. Wellness features have become essential: air-quality certifications, biophilic designs, and dedicated mental-health rooms are now hallmarks of premium properties. CBRE’s 144,500 square-foot headquarters, featuring yoga studios and circadian lighting, has set a new standard that corporate tenants now expect. Providers exceeding these benchmarks can command desk rates 15-20% higher and benefit from quicker leasing times.
Restraints Impact Analysis*
| Restraints | (~) % Impact on CAGR Forecast | Geographic Relevance | Impact Timeline |
|---|---|---|---|
| Oversupply risk in certain central London submarkets | -1.8% | Central London, selective spillover | Short term (≤ 2 years) |
| Uncertain macroeconomic conditions and Brexit-linked investment caution | -1.4% | National, acute in financial services | Medium term (2-4 years) |
| Rising operational costs for flexible office operators impacting margins | -1.2% | National, acute in London | Medium term (2-4 years) |
| Source: Mordor Intelligence | |||
Oversupply Risk in Certain Central London Submarkets
The Central London office market is grappling with oversupply challenges, particularly in the City fringe. In 2024, the vacancy rate in this area increased to 9.2%, with older Grade B towers being the most affected as blue-chip companies transitioned to ESG-compliant properties. This oversupply has triggered price wars among operators, significantly eroding margins at a pace that license churn cannot counterbalance. Prominent lease-exit disputes, such as WeWork’s Southbank litigation, highlight the risks of committing to 15-year headleases, especially as demand shifts towards the east or commuter towns. However, the anticipated reduction in new completions could help restore balance by 2027. Market participants who can endure the next two challenging years may have the opportunity to reprice their spaces at a premium once the oversupply diminishes.
Rising Operational Costs for Flexible Office Operators Impacting Margins
Flexible office operators are facing increasing challenges as operational costs continue to rise. In 2024, utility inflation, wage hikes for security staff, and rising cloud-software subscriptions drove up the average cost per workstation by 8% year-on-year. Starting April 2026, a revised business-rates multiplier will increase fixed outgoings for London centers, especially for properties valued over GBP 500,000. This change is set to strain smaller independent operators, who lack the economies of scale enjoyed by larger counterparts. To counteract these rising costs, market leaders are turning to IoT technology for real-time tuning of HVAC loads and are also negotiating bulk purchases of power. Meanwhile, smaller operators are eyeing mergers and acquisitions or franchise alignments, seeking to tap into group procurement and compliance resources, a move that could hasten market consolidation[2]UK Government, “Business Rates Reform 2026 Consultation,” gov.uk.
*Our forecasts treat driver/restraint impacts as directional, not additive. The impact forecasts reflect baseline growth, mix effects, and variable interactions.
Segment Analysis
By Type: Co-Working’s Network Effect Sustains Leadership
The co-working segment represented 50.85% of UK flexible office market share in 2025. Community programming, ranging from lunch-and-learns to investor pitch nights, keeps desk churn low and referral volume high. Operators blend hot-desk passes, dedicated desks, and private studios to smooth revenue across user tiers. Corporate demand surged after Fortune 500s shifted 15% of their UK headcount into flexible allowances, prompting providers to carve enterprise-grade, badge-controlled zones inside shared floors. Competitive differentiation now centers on proprietary app ecosystems that automate booking, billing, and access, which cuts staffing ratios to under one community manager per 300 members.
The Others segment (hybrid and virtual) will grow fastest at 10.35% CAGR through 2031 as distributed teams adopt “periodic presence” packages: bundles that include mailbox, quarterly off-site space, and pay-as-you-go meeting credits. Virtual addresses satisfy post-Brexit regulatory rules for overseas companies setting up in the UK while letting them test market entry with near-zero overhead. Larger providers leverage their footprint to upsell virtual clients into physical desks once headcount scales, extending lifetime value. Hybrid passes also supply real-time usage data, helping corporates right-size fixed leases and raising switching costs should they leave the platform—extending the lead of scale players in the UK flexible office market.


By Sector: IT Leads as BFSI Accelerates Transformation
Information Technology and ITES captured 38.72% of the UK flexible office market size in 2025. Tech firms favor buildings wired with 1-gig symmetrical internet, redundant power feeds, and 24/7 biometric access that facilitate agile sprints and global collaboration. Clustering in Shoreditch, the South Bank, and MediaCity drives cross-pollination as startups share investors and specialist talent. Sector resilience underpins stable seat-renewal rates above 90%, providing predictable cash flows.
BFSI adoption is projected to expand 10.60% CAGR, the segment’s fastest rate, as banks reposition prime HQ floors into client lounges and move back-office analysts into flexible suites to pare down long-term liabilities. Canary Wharf landlords now co-develop floors with operators, embedding trading-compliant infrastructure like voice-record lines and Faraday-caged meeting rooms. Professional-services use-cases mirror this trend: consultancies book pop-up project war-rooms close to clients, reducing travel cost and enhancing billable-hour efficiency. Operators serving regulated industries differentiate on ISO 27001 data security and SOC2-audited Wi-Fi, capturing premium rents that mitigate higher build-out costs.
By End Use: Enterprise Dominance Enables Startup Ecosystem Growth
Enterprises held 52.65% of the UK flexible office market size in 2025, making large-account management a critical capability. Multi-location agreements covering London, Dublin, and European gateways allow corporates to shift teams almost overnight an agility valued in uncertain economic cycles. Providers therefore invest in single sign-on, real-time availability feeds, and standardized design language that guarantees brand consistency across sites. Group contracts also establish minimum-revenue floors that anchor financing arrangements with lenders.
Startups and others will clock an 10.55% CAGR through 2031, buoyed by record early-stage funding rounds and government R&D tax credits encouraging new company formation. Flexible offices reduce the time from seed investment to product launch by removing premises fit-out from startup to-do lists. Founder communities inside the same centers unlock mentorship and venture-capital office-hour sessions that traditional accelerators struggle to replicate at scale. Enterprises increasingly source innovation by co-locating corporate venture teams next to startups, fostering pilot projects that deepen tenant retention while nurturing the next wave of growth for the UK flexible office market.

Geography Analysis
In 2025, England accounted for 81.85% of the overall revenue, primarily due to London’s high concentration of financial institutions, legal firms, and global headquarters, which require scalable and brand-consistent workspaces. The limited availability of Grade A properties in the capital has kept rental prices stable. To manage capacity constraints while maintaining accessibility, providers have established satellite hubs in Reading, Croydon, and Watford. Additionally, Manchester and Birmingham have secured multiyear corporate licenses by offering lower occupancy costs. This approach supports the development of expansion corridors and mitigates risks across the UK’s flexible office market.
Scotland is expected to grow at a CAGR of 10.90% through 2031, driven by Edinburgh’s asset-management sector and Glasgow’s technology spin-outs, both of which benefit from proximity to university research and a skilled graduate workforce. Operators are repurposing Georgian townhouses and riverfront warehouses, integrating heritage designs with LEED-compliant upgrades to attract ESG-conscious tenants. Government innovation grants, which cover up to 20% of fit-out costs, further enhance the business case. These incentives have encouraged brands established in London to enter the Scottish market early and secure prominent flagship locations.
Wales and Northern Ireland, though smaller markets, are experiencing double-digit growth as companies diversify geographically and local governments promote “levelling-up” enterprise zones with business-rate holidays. Cardiff is leveraging its bilingual workforce to attract fintech service centers, while Belfast is positioning itself as a gateway to EU markets post-Brexit. This has led providers to include cross-border tax-advice workshops as part of their membership benefits. These factors contribute to broad-based national growth, helping operators mitigate risks associated with localized oversupply.
Regulatory Landscape
The United Kingdom flexible office space market operates under a policy mix covering occupier rights, property taxation, and building standards. The April 2024 day-one flexible-working law increased the need for employers to demonstrate consultation when handling flexible-working requests, reinforcing demand for short-form, scalable workspace licences. On the cost side, business rates reform and valuation practice are a key swing factor for operator economics. In 2025-26, sector discussions have highlighted Valuation Office Agency (VOA) treatment of serviced offices as single hereditaments, alongside the move toward a reformed rating system from April 2026, which can shift liabilities between landlords, operators, and end users.
Compliance requirements are also tightening around safety and energy performance. In January 2026, the Building Safety Regulator (BSR) was formally separated from the Health and Safety Executive (HSE), lifting the profile of accountable safety management in multi-occupier buildings that host flexible office floors. Energy rules are moving in parallel, with updated Minimum Energy Efficiency Standards (MEES) setting out a pathway where larger commercial buildings (over 1,000 square metres) must reach EPC B by 2031, while smaller premises remain subject to EPC E. This improves the relative value of ESG-ready stock for operators and institutional landlords.
Value Chain Analysis
The UK flexible office value chain starts with real estate developers and asset owners supplying Grade A and repositioned Grade B stock, then runs through operators that brand, fit out, and manage centers through management agreements, franchises, or leases. Enterprise and SME occupiers buy memberships and short-form licences downstream, while large platforms such as International Workplace Group (IWG), WeWork, Workspace Group, and BizSpace (Sirius Real Estate) aggregate and distribute demand using digital booking, access control, and billing tools across multiple sites.
Specialist providers then support delivery at scale. Workspace design and technology consultants help operators standardize builds, while modular furniture and smart-office solutions enable rapid reconfiguration, energy monitoring, and improvements to occupant experience. The operating layer increasingly relies on compliance management for health, safety, and energy performance, and trade bodies such as the Flexible Space Association (FlexSA) convene operator-focused forums (including a Health and Safety Forum launched in March 2026 at WeWork's 10 York Road) to translate evolving requirements into site-level procedures. As business rates and MEES-related capex rise, sale-and-manage-back and asset-light operating models are increasingly used by both landlords and operators to rebalance risk and protect margins while maintaining inventory across London and regional cities.
Competitive Landscape
The flexible office space market in the United Kingdom is moderately fragmented. IWG leads the market by implementing franchise models that transfer capital expenditure responsibilities to landlords in exchange for brand and system licensing. Its Worka app, which includes features for booking, billing, and environmental monitoring, allows asset owners to utilize IWG’s demand engine while retaining control over their assets. This approach enabled the opening of 247 centers over the past year, maintaining a light return on invested capital and allowing IWG to efficiently adjust capacity between oversupplied and undersupplied districts.
WeWork’s court-approved restructuring reduced its debt by USD 4 billion, lowering annual interest payments and freeing up funds for refurbishing key assets in London. The company is focusing on larger enterprise suites, incorporating modular walls and raised floors to support both open collaboration and client confidentiality. Its proprietary Workplace Hub software provides analytics on occupancy trends, helping corporate real-estate managers justify longer license renewals. With a debt-free balance sheet, WeWork has regained credibility with UK landlords, particularly after previous lease renegotiations.
Regional players such as Workspace Group and Sirius Real Estate’s BizSpace division capitalize on their detailed knowledge of local planning regulations to convert secondary properties into amenity-rich centers at conversion costs 30-40% lower than new builds. Workspace manages 73 assets in London, many of which are former industrial properties, offering flexible lease terms that align with the cash-flow variability of the creative industry. BizSpace operates 4.3 million square feet across the country, targeting micro-SMEs that are priced out of city centers. Both companies are selectively acquiring distressed assets, refurbishing them to meet ESG standards, thereby increasing rents and asset values, and strengthening their position in the UK flexible office market.
United Kingdom Flexible Office Space Industry Leaders
International Workplace Group (IWG / Regus / Spaces)
WeWork
The Office Group
Workspace Group
BizSpace (Sirius Real Estate)
- *Disclaimer: Major Players sorted in no particular order

Market Opportunities and Future Outlook
A clear opportunity area sits where operating efficiency meets property taxation changes. With business rates reform scheduled for April 2026 and ongoing discussion around VOA treatment of serviced offices, operators that can document space usage, allocate costs transparently, and negotiate landlord partnerships have more leverage in pricing and renewal discussions. This dynamic raises the value of technology-enabled platforms that integrate booking, metering, and reporting, and it favors brands that can spread fixed compliance and procurement costs across larger networks.
On the supply side, the opportunity is concentrated in portfolio repositioning and consolidation, particularly where owners need operating partners to improve income resilience and fund upgrades. In 1H 2024, the UK accounted for EUR 4.1 billion of European office transactions (29% of total volume), supporting ongoing institutional engagement with operational real estate structures. In 2026, company actions also point to active whitespace across regional expansion and UK-focused portfolio decisions. IWG reiterated expansion intent for 2026 and disclosed an adjusted EBITDA target range of USD 585 million to USD 625 million for FY 2026, while Workspace Group reported portfolio occupancy of 79.8% for the quarter ending 30 June 2026 and continued disposals to create balance-sheet capacity for reinvestment. As MEES moves toward EPC B by 2031 for larger buildings, retrofit-led conversions and landlord-operator partnerships around ESG-compliant fit-outs remain a practical route to add flexible inventory without relying on speculative new-build supply.
Recent Industry Developments
- July 2026: Workspace Group PLC provided first-quarter business update ending 30 June 2026, noting the sale of Evergreen Studios and confirming total disposals of £138.4 million since 1 April 2025. The update signals active portfolio optimization to fund high-quality, sustainable spaces and improve liquidity. The development supports investor confidence by illustrating capacity to rebalance assets toward market-preferred locations and asset quality.
- June 2026: Workspace Group PLC announced full-year results for the year to 31 March 2026, confirming the sale of Chiswick Studios and One Crown Square, Woking. This demonstrates continued repositioning toward core assets and capacity for reinvestment in higher-quality spaces. The results underline the firm’s ongoing balance sheet optimization and strategic exit from peripheral assets.
- April 2026: Fora (The Office Group) entered an agreement to sell its German business assets to International Workplace Group (IWG) to refocus operations on the UK market. The arrangement consolidates UK focus and strengthens IWG Fora related footprint alignment in the UK market. The move broadens the company's presence in the domestic flexible office sector while reducing exposure to less-attractive markets.


Research Methodology Framework and Report Scope
Market Definition and Coverage
For this study, the market is the revenue generated in the United Kingdom from providing flexible office space on short and adaptable terms, including coworking and serviced office formats, where users pay for access, desks, offices, and related on-site services.
Scope exclusions: We exclude conventional long-lease office rentals, pure brokerage fees, and residential flexible living formats even if a mixed-use building offers them.
Segmentation Overview
- By Type
- Co-Working Space
- Serviced offices / Executive suites
- Others (Hybrid, Virtual Office)
- By Sector
- Information Technology (IT and ITES)
- BFSI (Banking, Financial Services and Insurance)
- Business Consulting & Professional Service
- Other Services (Retail, Lifesciences, Energy, Legal Services)
- By End Use
- Freelancers
- Enterprises
- Start Ups and Others
- By Country
- England
- Scotland
- Wales
- Northern Ireland
Data Sources, Market Sizing, and Validation
Desk Research
Desk research was used to map how demand is forming across UK cities and to set realistic boundaries for what counts as flexible office space revenue. We referred to public datasets and official publications such as Office for National Statistics labor market releases, UK government policy notes on flexible working, Companies House filings, and HM Land Registry or Valuation Office Agency materials where relevant for property context.
To ground the model, we also reviewed industry bodies and open research outputs such as British Property Federation updates, Royal Institution of Chartered Surveyors sentiment surveys, and selected peer-reviewed urban economics and workplace studies. Company annual reports, investor presentations, and reputable press were then used to cross-check openings, closures, occupancy direction, and pricing commentary, with a paid subscription database for company financials and a paid news and financials feed used selectively to verify corporate events. This list is illustrative, and many other public and paid sources were also reviewed for data collection, validation, and clarification.
Primary Interviews and Surveys
Primary work focused on confirming how flexible space is priced and filled in different UK micro-markets, and on stress-testing desk-based assumptions used in the model. We spoke with a mix of operators, landlords with managed workspace offerings, enterprise occupiers, and local market advisors so that London dynamics and key regional cities could be compared on the same basis.
Distribution of primary research fieldwork respondents
| Company type | Respondent position |
|---|---|
| Top tier: 34% | CXOs: 13% |
| Mid tier: 52% | Functional/Unit leaders: 42% |
| Smaller Players: 14% | Managers: 45% |
Market-Sizing & Forecasting
Our sizing starts from a top-down demand pool build-up that translates flexible workspace supply and utilization into revenue, then checks whether the result aligns with what users actually pay in core cities. In practice, we combine capacity indicators, such as number of operational centers, desks, or square footage available, with average occupancy and apply typical price per desk plus service attach rates to form an annual revenue view.
The model is guided by market fingerprints such as London versus regional desk pricing spreads, ramp-up time to stabilize new sites, churn behavior in short-term memberships, and the mix shift between coworking and serviced office formats as enterprise use grows. These inputs were pressure-tested through channel checks and sampled bottom-up approximations, where a set of operator footprints and published financial disclosures were converted into implied revenue per location and compared back to the top-level totals, with gaps handled through conservative assumptions when site-level data was not visible.
For forecasting, scenario analysis was used because the market reacts to employment trends, office attendance patterns, and tenant cost sensitivity in a non-linear way. Assumptions for pricing, occupancy recovery, and new supply additions were refreshed using the direction shared by primary respondents, and then translated into yearly market values.
Data Validation & Update Cycle
Validation was done through multiple checks so the market total stays consistent with real-world signals. Outputs were compared against independent indicators such as office employment trends, announced openings and closures, and directionally reported pricing and occupancy commentary, and then outliers were flagged for re-checking.
Before sign-off, the model and assumptions are reviewed in more than one internal pass, and respondents are re-contacted when a key input moves materially or contradicts desk research. Reports are refreshed annually, and interim updates are made when major events shift pricing, occupancy, or supply in a measurable way. Right before delivery, a final pass is done so clients receive the most current view available.
Mordor Intelligence's United Kingdom Flexible Office Space Market Sizing Compared With Other Published Estimates
Published market sizes for UK flexible office space do not always match because the underlying revenue boundary is not consistent, and because city coverage and pricing logic vary. Differences can also come from whether a study counts only operator-run flex centers or also adds landlord-managed space and broader serviced office activities.
By tracking desk capacity, observed occupancy, and price-per-desk movements, Mordor Intelligence keeps the estimate tied to in-scope flexible workspace revenues and avoids pulling in conventional office leasing value that sits outside this market.
Benchmark comparison
| Source | Market Size | Gaps in Research Methodology |
|---|---|---|
| Mordor Intelligence | USD 3.84 B (2025) | |
| Industry Data Publisher A | USD 3.90 B (2026) | Uses a forward-year revenue run-rate as the stated market size, which can overstate the base if new site openings are assumed to stabilize immediately. |
| Regional Consultancy B | USD 2.95 B (2025) | Leans on a narrower definition that focuses on coworking memberships, which can undercount serviced office revenue and enterprise-managed suite contracts. |
Across the three numbers, the spread is mainly explained by timing choices and what is counted as flexible revenue versus adjacent office income. When scope is kept consistent and inputs like capacity, occupancy, and desk pricing are checked against interview feedback, the resulting market size stays more traceable and easier to update year to year.


Key Questions Answered in the Report
How large is the UK flexible office market in 2026?
The UK flexible office market size is projected at USD 4.19 billion in 2026.
What CAGR is forecast for UK flexible workspace through 2031?
The sector is set to expand at a 9.15% CAGR between 2026 and 2031.
Which segment leads by type in flexible workspace?
Co-working commands 50.85% share, making it the largest segment.
Which sector is growing fastest in adopting flexible offices?
Banking, financial services, and insurance is forecast to grow 10.60% CAGR to 2031.
Which UK region shows the highest growth rate?
Scotland leads with an expected 10.90% CAGR through 2031.
What is driving investor interest in flexible office assets?
Income flexibility, shorter lease terms, and the ability to reprice quickly in inflationary cycles attract institutional capital.
Page last updated on:


 Your data is secure and never sold or shared.


