
| Study Period | 2017 - 2030 |
| Base Year For Estimation | 2024 |
| Forecast Data Period | 2025 - 2030 |
| Market Size (2025) | USD 23.75 Billion |
| Market Size (2030) | USD 28.44 Billion |
| CAGR (2025 - 2030) | 3.67 % |
| Market Concentration | Low |
Major Players*Disclaimer: Major Players sorted in no particular order |


United Kingdom Dairy Market Analysis
The United Kingdom Dairy Market size is estimated at 23.75 billion USD in 2025, and is expected to reach 28.44 billion USD by 2030, growing at a CAGR of 3.67% during the forecast period (2025-2030).
The United Kingdom dairy market is experiencing significant transformation driven by evolving retail distribution channels and changing consumer preferences. Supermarkets and hypermarkets continue to dominate the retail landscape, with major chains like Tesco and Sainsbury's collectively holding 43% of the grocery market share as of 2021. The retail sector has witnessed substantial consolidation, with convenience stores playing an increasingly important role in dairy distribution through a network of over 47,000 stores nationwide. This extensive retail infrastructure has enabled better market penetration and improved accessibility for consumers across urban and rural areas.
The digital transformation of dairy retail has accelerated significantly, reflecting broader changes in consumer shopping behavior. The United Kingdom leads Europe in online shopping adoption, with e-commerce revenue reaching USD 156 billion in 2021 and approximately 29% of total retail sales occurring online. Major retailers have responded by expanding their digital capabilities, implementing advanced delivery systems, and offering innovative services such as subscription-based dairy deliveries and personalized shopping experiences. The integration of dairy technology has also enabled better inventory management and reduced waste in the dairy supply chain.
The foodservice sector has emerged as a crucial growth driver for the dairy industry, with restaurant and cafe spending reaching USD 111.34 billion in 2021. This growth is supported by an extensive network of foodservice establishments, including Costa Coffee's 2,792 outlets and Subway's 2,209 locations as of 2022. The increasing diversity of the UK population, with a foreign-born population of 9.61 million in 2021, has led to greater demand for varied dairy products used in different cuisines, from Italian pizzas to Indian curries.
The industry has witnessed significant innovation in product development and packaging, responding to evolving consumer preferences for convenience, sustainability, and health-conscious options. Retailers are expanding their private label offerings, particularly in premium and specialty dairy products, while manufacturers are investing in new processing technologies to extend shelf life and maintain product quality. The focus on sustainability has led to increased adoption of eco-friendly packaging solutions and transparent supply chain practices, with major retailers implementing comprehensive sustainability initiatives across their dairy product lines.
United Kingdom Dairy Market Trends
The rising demand for baked foods, including pizza, baked macaroni with mozzarella, and other cheese and butter-based products, is driving cheese consumption
- In 2022, the per capita consumption of dairy products in the United Kingdom witnessed a growth of 2% compared to 2021. The growth was attributed to the rising demand for bakery products among consumers. Some of these bakery products are dairy desserts (mousses and cheesecakes). The per capita consumption of cheesecakes in the United Kingdom was estimated at 0.93 kg. Considering the demand for dairy desserts and other products, the country increased its dairy imports in the last three years. In 2022, the country imported 11.71 million metric tons of dairy products, a growth rate of 4.35% compared to 2021.
- With the rising demand for baked foods, including pizza, baked macaroni with mortadella, and other cheese-based products, the demand for cheese is rising in the region. Due to the rising demand for cheese among consumers, consistent fluctuation in the prices of cheese was observed in 2022. In 2022, cheese prices observed a growth rate of 32.35% compared to 2021.
- Consumers in Europe are moving toward the consumption of butter-based snack products, such as cookies and crunchies. As a result, the import volume of butter has increased. With the growing demand for butter, there was a significant fluctuation in butter prices, which reached GBP 207.99 per kg. The average price for a tonne is USD 288,456.87 in Birmingham and London. In 2023, the approximate price range for butter in the United Kingdom is between USD 288.46 and USD 5.88 per kilogram or between USD 130.84 and USD 2.67 per pound (lb).

Understand The Key Trends Shaping This Market
Download PDF
OTHER KEY INDUSTRY TRENDS COVERED IN THE REPORT
- Advanced technology and modern methodologies introduced in the nation's dairy industry enabled the growth of butter production
- The farm-gate milk prices in the country impacting milk production
- The increasing demand for artisanal, local, and traditional cheese products is impacting the production of cheese in the country
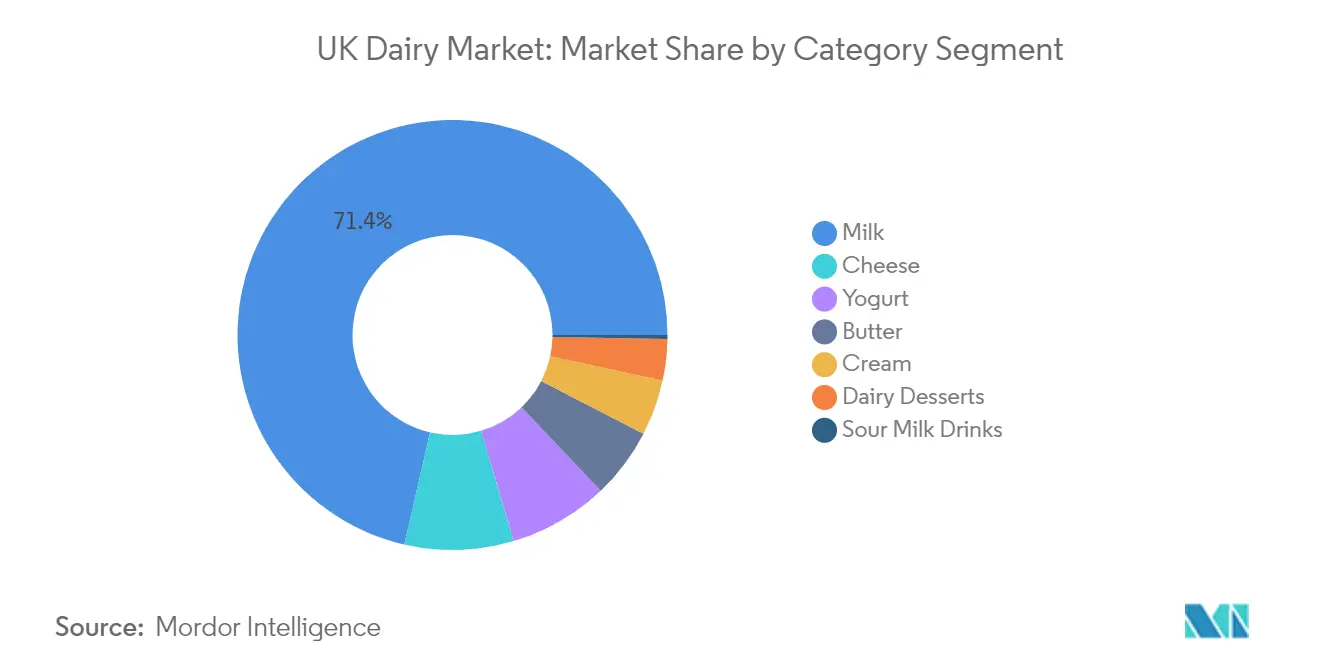
Segment Analysis: Category
Milk Segment in UK Dairy Market
The milk segment continues to maintain its dominant position in the United Kingdom dairy market, commanding approximately 71% market share in 2024. This substantial market presence is attributed to milk being a fundamental grocery staple in UK households, with the industry comprising over 12,000 active dairy farmers engaged in processing, packaging, and distribution. The segment's strength is further reinforced by the United Kingdom's position as the thirteenth-largest milk producer globally, with milk accounting for about 20% of the total agricultural output. The robust distribution network, including major supermarket chains and convenience stores, along with the increasing consumer preference for different varieties like fresh milk, UHT milk, and flavored milk, continues to drive this segment's market dominance.
Sour Milk Drinks Segment in UK Dairy Market
The sour milk drinks segment is emerging as the most dynamic category in the UK dairy market, projected to grow at approximately 6% CAGR during 2024-2029. This remarkable growth trajectory is primarily driven by increasing consumer awareness of the health benefits associated with sour milk drinks, particularly their medicinal properties and positive impact on gut health. The rising interest in prebiotics and overall digestive wellness has significantly contributed to this segment's expansion. The growth is further supported by the increasing expatriate population, particularly from South Asian communities, who traditionally consume sour milk products. Major brands are responding to this trend by introducing innovative products with different taste profiles and health-focused claims like 100% organic and sugar-free formulations.
Remaining Segments in UK Dairy Market
The UK dairy market's diversity is further enhanced by several other significant segments including cheese, butter, cream, dairy desserts, and yogurt. The cheese segment plays a crucial role in both retail and food service sectors, particularly in the growing fast-food industry. Butter maintains its importance in both household consumption and commercial baking applications. The cream segment caters to both domestic and commercial culinary needs, while dairy desserts, including ice cream and frozen products, serve the growing demand for premium indulgent treats. The yogurt segment continues to evolve with innovative flavors and health-focused variants, meeting the changing consumer preferences for nutritious dairy products.
Segment Analysis: Distribution Channel
Off-Trade Segment in UK Dairy Market
The off-trade distribution channel dominates the UK dairy market, commanding approximately 90% of the total market share in 2024. This substantial market presence is primarily driven by the extensive network of supermarkets and hypermarkets, which account for over 70% of off-trade sales. The segment's growth is further bolstered by the rising penetration of organized retail formats and the increasing consumer preference for purchasing dairy products through conventional retail channels. Major retailers like Tesco, Sainsbury's, Asda, Morrisons, and Lidl have strengthened their position by offering loyalty benefits and maintaining competitive pricing strategies. The segment is expected to maintain its strong growth trajectory with a projected growth rate of nearly 4% during 2024-2029, driven by the expanding e-commerce sector and the increasing adoption of online grocery shopping among UK consumers. The convenience of doorstep delivery, availability of multiple brands under one platform, and attractive promotional offers have made online retail the fastest-growing sub-segment within the off-trade channel.
Remaining Segments in Distribution Channel
The on-trade distribution channel, while holding a smaller market share, plays a crucial role in the UK dairy market through foodservice establishments, restaurants, cafes, and other food service outlets. This segment's performance is closely tied to the growth of the hospitality sector and the increasing trend of dining out among UK consumers. The channel benefits from the strong presence of international coffee chains, fast-food restaurants, and the growing popularity of various international cuisines that heavily incorporate dairy products. The segment's growth is supported by the expanding tourism sector and the rising number of food service establishments across the country. Additionally, the increasing preference for premium dairy products in restaurants and cafes, particularly in specialty coffee shops and fine dining establishments, continues to drive the segment's development in the UK market.
United Kingdom Dairy Industry Overview
Top Companies in United Kingdom Dairy Market
The dairy market in the United Kingdom is characterized by intense competition among established players who are actively pursuing growth through various strategic initiatives. Product innovation remains a key focus area, with companies launching new variants of cheese, yogurt, and dairy alternatives to meet evolving consumer preferences. Operational agility has become crucial as companies invest in modernizing their dairy manufacturing facilities and adopting sustainable practices, including renewable energy sources and eco-friendly dairy packaging solutions. Strategic expansion moves are prevalent through the establishment of new production facilities, strengthening distribution networks, and entering new market segments. Companies are also emphasizing direct-to-consumer channels and digital transformation to enhance market reach, while simultaneously focusing on developing premium product lines and health-oriented offerings to capture growing consumer segments.
Market Dominated by Global and Regional Leaders
The United Kingdom dairy industry exhibits a balanced mix of global conglomerates and specialized regional players, with multinational companies holding significant market share through their established brands and extensive distribution networks. These major players leverage their research and development capabilities, advanced manufacturing facilities, and strong financial resources to maintain their competitive positions. The market structure is relatively consolidated at the top, with a few large players controlling a substantial portion of the market, while numerous smaller companies operate in specialized segments or regional markets.
The industry has witnessed strategic consolidations through mergers and acquisitions, particularly as larger companies seek to strengthen their market position and expand their product portfolios. Regional dairy cooperatives play a vital role in the market, representing the interests of local dairy farmers while competing with multinational corporations. The market also sees active participation from private-label manufacturers who partner with major retailers to offer competitive dairy products, creating additional competitive pressure on branded players.
Innovation and Sustainability Drive Future Success
Success in the United Kingdom dairy market increasingly depends on companies' ability to align with evolving consumer preferences while maintaining operational efficiency. Incumbent players must focus on dairy innovation, particularly in developing healthier options, plant-based alternatives, and premium products to maintain their market position. Investment in sustainable practices, including responsible sourcing, reduced packaging waste, and lower carbon emissions, has become crucial for long-term success. Companies need to strengthen their direct-to-consumer channels while maintaining strong relationships with traditional retail partners.
For contenders looking to gain market share, differentiation through unique product offerings, specialized market focus, or superior customer service presents opportunities for growth. The ability to adapt quickly to changing consumer preferences and regulatory requirements, particularly regarding sustainability and health claims, will be crucial. Companies must also consider potential disruption from dairy alternatives and changing consumption patterns while building resilient supply chains. Success will increasingly depend on building strong brand identities centered around transparency, sustainability, and health consciousness, while effectively managing production costs and maintaining competitive pricing strategies.
United Kingdom Dairy Market Leaders
-
Arla Foods
-
Danone SA
-
Muller Group
-
Saputo Inc.
-
Unilever PLC
- *Disclaimer: Major Players sorted in no particular order

Need More Details on Market Players and Competiters?
Download PDF
United Kingdom Dairy Market News
- November 2022: Ornua Foods UK invested USD 3.77 million in state-of-the-art cutting and packing equipment at its Leek facility. The latest investment may see the installation of an additional high-speed cheese-slicing line and the further expansion of Ornua's cheese-grating capabilities. Overall, the new state-of-the-art equipment is expected to result in an additional 7,000 metric tons of capacity, bringing the total annual production to over 110,000 metric tons.
- September 2021: Bel UK, a subsidiary of Bel Group, expanded its Boursin cheese brand by launching a range of flavored hot cheese bites.
- November 2020: Dairy Farm launched a Fixed Milk Price Contract option for its 1,300 milk producers. The contract will be protection from volatile dairy markets, offering a guaranteed price for the next three years.
Free With This Report
We provide a comprehensive and exhaustive set of data pointers for global, regional, and country-level metrics that illustrate the fundamentals of the dairy industry. With the help of 45+ free charts, clients can access in-depth market analysis based on per capita consumption numbers and production data of raw materials for dairy, through granular-level segmental information supported by a repository of market data, trends, and expert analysis. Data and analysis on dairy, categories of dairy products, product types, etc., are available in the form of comprehensive reports as well as excel based data worksheets.


United Kingdom Dairy Market Report - Table of Contents
1. EXECUTIVE SUMMARY & KEY FINDINGS
2. REPORT OFFERS
3. INTRODUCTION
- 3.1 Study Assumptions & Market Definition
- 3.2 Scope of the Study
- 3.3 Research Methodology
4. KEY INDUSTRY TRENDS
- 4.1 Per Capita Consumption
-
4.2 Raw Material/commodity Production
- 4.2.1 Butter
- 4.2.2 Cheese
- 4.2.3 Milk
-
4.3 Regulatory Framework
- 4.3.1 United Kingdom
- 4.4 Value Chain & Distribution Channel Analysis
5. MARKET SEGMENTATION (includes market size in Value in USD and Volume, Forecasts up to 2030 and analysis of growth prospects)
-
5.1 Category
- 5.1.1 Butter
- 5.1.1.1 By Product Type
- 5.1.1.1.1 Cultured Butter
- 5.1.1.1.2 Uncultured Butter
- 5.1.2 Cheese
- 5.1.2.1 By Product Type
- 5.1.2.1.1 Natural Cheese
- 5.1.2.1.2 Processed Cheese
- 5.1.3 Cream
- 5.1.3.1 By Product Type
- 5.1.3.1.1 Double Cream
- 5.1.3.1.2 Single Cream
- 5.1.3.1.3 Whipping Cream
- 5.1.3.1.4 Others
- 5.1.4 Dairy Desserts
- 5.1.4.1 By Product Type
- 5.1.4.1.1 Cheesecakes
- 5.1.4.1.2 Frozen Desserts
- 5.1.4.1.3 Ice Cream
- 5.1.4.1.4 Mousses
- 5.1.4.1.5 Others
- 5.1.5 Milk
- 5.1.5.1 By Product Type
- 5.1.5.1.1 Condensed milk
- 5.1.5.1.2 Flavored Milk
- 5.1.5.1.3 Fresh Milk
- 5.1.5.1.4 Powdered Milk
- 5.1.5.1.5 UHT Milk
- 5.1.6 Sour Milk Drinks
- 5.1.7 Yogurt
- 5.1.7.1 By Product Type
- 5.1.7.1.1 Flavored Yogurt
- 5.1.7.1.2 Unflavored Yogurt
-
5.2 Distribution Channel
- 5.2.1 Off-Trade
- 5.2.1.1 Convenience Stores
- 5.2.1.2 Online Retail
- 5.2.1.3 Specialist Retailers
- 5.2.1.4 Supermarkets and Hypermarkets
- 5.2.1.5 Others (Warehouse clubs, gas stations, etc.)
- 5.2.2 On-Trade
6. COMPETITIVE LANDSCAPE
- 6.1 Key Strategic Moves
- 6.2 Market Share Analysis
- 6.3 Company Landscape
-
6.4 Company Profiles (includes Global Level Overview, Market Level Overview, Core Business Segments, Financials, Headcount, Key Information, Market Rank, Market Share, Products and Services, and Analysis of Recent Developments).
- 6.4.1 Arla Foods
- 6.4.2 Bel Group
- 6.4.3 Dale Farm Cooperative Limited
- 6.4.4 Danone SA
- 6.4.5 Glanbia PLC
- 6.4.6 Kingcott Dairy
- 6.4.7 Muller Group
- 6.4.8 Ornua Co-Operative Limited
- 6.4.9 Saputo Inc.
- 6.4.10 Unilever PLC
7. KEY STRATEGIC QUESTIONS FOR DAIRY AND DAIRY ALTERNATIVE CEOS
8. APPENDIX
-
8.1 Global Overview
- 8.1.1 Overview
- 8.1.2 Porter’s Five Forces Framework
- 8.1.3 Global Value Chain Analysis
- 8.1.4 Market Dynamics (DROs)
- 8.2 Sources & References
- 8.3 List of Tables & Figures
- 8.4 Primary Insights
- 8.5 Data Pack
- 8.6 Glossary of Terms
You Can Purchase Parts Of This Report. Check Out Prices For Specific Sections
Get Price Break-up Now
List of Tables & Figures
- Figure 1:
- PER CAPITA CONSUMPTION OF MILK, BUTTER, CHEESE, KG, UNITED KINGDOM, 2017 - 2029
- Figure 2:
- PRODUCTION OF BUTTER, METRIC TONNES, UNITED KINGDOM, 2017 - 2021
- Figure 3:
- PRODUCTION OF CHEESE, METRIC TONNES, UNITED KINGDOM, 2017 - 2021
- Figure 4:
- PRODUCTION OF MILK, METRIC TONNES, UNITED KINGDOM, 2017 - 2021
- Figure 5:
- VOLUME OF DAIRY, METRIC TONNES, BY UNITED KINGDOM, 2017 - 2029
- Figure 6:
- VALUE OF DAIRY, USD MN, BY UNITED KINGDOM, 2017 - 2029
- Figure 7:
- VOLUME OF DAIRY MARKET BY CATEGORY, METRIC TONNES, UNITED KINGDOM, 2017 - 2029
- Figure 8:
- VALUE OF DAIRY MARKET BY CATEGORY, USD MN, UNITED KINGDOM, 2017 - 2029
- Figure 9:
- VOLUME SHARE OF DAIRY MARKET, BY CATEGORY , %, UNITED KINGDOM, 2017 VS 2023 VS 2029
- Figure 10:
- VALUE SHARE OF DAIRY MARKET, BY CATEGORY , %, UNITED KINGDOM, 2017 VS 2023 VS 2029
- Figure 11:
- VOLUME OF BUTTER MARKET BY PRODUCT TYPE, METRIC TONNES, UNITED KINGDOM, 2017 - 2029
- Figure 12:
- VALUE OF BUTTER MARKET BY PRODUCT TYPE, USD MN, UNITED KINGDOM, 2017 - 2029
- Figure 13:
- VOLUME SHARE OF BUTTER MARKET BY PRODUCT TYPE, %, UNITED KINGDOM, 2017 VS 2023 VS 2029
- Figure 14:
- VALUE SHARE OF BUTTER MARKET BY PRODUCT TYPE, %, UNITED KINGDOM, 2017 VS 2023 VS 2029
- Figure 15:
- VOLUME OF CULTURED BUTTER MARKET, METRIC TONNES, UNITED KINGDOM, 2017 - 2029
- Figure 16:
- VALUE OF CULTURED BUTTER MARKET, USD MN, UNITED KINGDOM, 2017 - 2029
- Figure 17:
- VALUE SHARE OF CULTURED BUTTER MARKET, BY DISTRIBUTION CHANNEL , %, UNITED KINGDOM, 2022 VS 2029
- Figure 18:
- VOLUME OF UNCULTURED BUTTER MARKET, METRIC TONNES, UNITED KINGDOM, 2017 - 2029
- Figure 19:
- VALUE OF UNCULTURED BUTTER MARKET, USD MN, UNITED KINGDOM, 2017 - 2029
- Figure 20:
- VALUE SHARE OF UNCULTURED BUTTER MARKET, BY DISTRIBUTION CHANNEL , %, UNITED KINGDOM, 2022 VS 2029
- Figure 21:
- VOLUME OF CHEESE MARKET BY PRODUCT TYPE, METRIC TONNES, UNITED KINGDOM, 2017 - 2029
- Figure 22:
- VALUE OF CHEESE MARKET BY PRODUCT TYPE, USD MN, UNITED KINGDOM, 2017 - 2029
- Figure 23:
- VOLUME SHARE OF CHEESE MARKET BY PRODUCT TYPE, %, UNITED KINGDOM, 2017 VS 2023 VS 2029
- Figure 24:
- VALUE SHARE OF CHEESE MARKET BY PRODUCT TYPE, %, UNITED KINGDOM, 2017 VS 2023 VS 2029
- Figure 25:
- VOLUME OF NATURAL CHEESE MARKET, METRIC TONNES, UNITED KINGDOM, 2017 - 2029
- Figure 26:
- VALUE OF NATURAL CHEESE MARKET, USD MN, UNITED KINGDOM, 2017 - 2029
- Figure 27:
- VALUE SHARE OF NATURAL CHEESE MARKET, BY DISTRIBUTION CHANNEL , %, UNITED KINGDOM, 2022 VS 2029
- Figure 28:
- VOLUME OF PROCESSED CHEESE MARKET, METRIC TONNES, UNITED KINGDOM, 2017 - 2029
- Figure 29:
- VALUE OF PROCESSED CHEESE MARKET, USD MN, UNITED KINGDOM, 2017 - 2029
- Figure 30:
- VALUE SHARE OF PROCESSED CHEESE MARKET, BY DISTRIBUTION CHANNEL , %, UNITED KINGDOM, 2022 VS 2029
- Figure 31:
- VOLUME OF CREAM MARKET BY PRODUCT TYPE, METRIC TONNES, UNITED KINGDOM, 2017 - 2029
- Figure 32:
- VALUE OF CREAM MARKET BY PRODUCT TYPE, USD MN, UNITED KINGDOM, 2017 - 2029
- Figure 33:
- VOLUME SHARE OF CREAM MARKET BY PRODUCT TYPE, %, UNITED KINGDOM, 2017 VS 2023 VS 2029
- Figure 34:
- VALUE SHARE OF CREAM MARKET BY PRODUCT TYPE, %, UNITED KINGDOM, 2017 VS 2023 VS 2029
- Figure 35:
- VOLUME OF DOUBLE CREAM MARKET, METRIC TONNES, UNITED KINGDOM, 2017 - 2029
- Figure 36:
- VALUE OF DOUBLE CREAM MARKET, USD MN, UNITED KINGDOM, 2017 - 2029
- Figure 37:
- VALUE SHARE OF DOUBLE CREAM MARKET, BY DISTRIBUTION CHANNEL , %, UNITED KINGDOM, 2022 VS 2029
- Figure 38:
- VOLUME OF SINGLE CREAM MARKET, METRIC TONNES, UNITED KINGDOM, 2017 - 2029
- Figure 39:
- VALUE OF SINGLE CREAM MARKET, USD MN, UNITED KINGDOM, 2017 - 2029
- Figure 40:
- VALUE SHARE OF SINGLE CREAM MARKET, BY DISTRIBUTION CHANNEL , %, UNITED KINGDOM, 2022 VS 2029
- Figure 41:
- VOLUME OF WHIPPING CREAM MARKET, METRIC TONNES, UNITED KINGDOM, 2017 - 2029
- Figure 42:
- VALUE OF WHIPPING CREAM MARKET, USD MN, UNITED KINGDOM, 2017 - 2029
- Figure 43:
- VALUE SHARE OF WHIPPING CREAM MARKET, BY DISTRIBUTION CHANNEL , %, UNITED KINGDOM, 2022 VS 2029
- Figure 44:
- VOLUME OF OTHERS MARKET, METRIC TONNES, UNITED KINGDOM, 2017 - 2029
- Figure 45:
- VALUE OF OTHERS MARKET, USD MN, UNITED KINGDOM, 2017 - 2029
- Figure 46:
- VALUE SHARE OF OTHERS MARKET, BY DISTRIBUTION CHANNEL , %, UNITED KINGDOM, 2022 VS 2029
- Figure 47:
- VOLUME OF DAIRY DESSERTS MARKET BY PRODUCT TYPE, METRIC TONNES, UNITED KINGDOM, 2017 - 2029
- Figure 48:
- VALUE OF DAIRY DESSERTS MARKET BY PRODUCT TYPE, USD MN, UNITED KINGDOM, 2017 - 2029
- Figure 49:
- VOLUME SHARE OF DAIRY DESSERTS MARKET BY PRODUCT TYPE, %, UNITED KINGDOM, 2017 VS 2023 VS 2029
- Figure 50:
- VALUE SHARE OF DAIRY DESSERTS MARKET BY PRODUCT TYPE, %, UNITED KINGDOM, 2017 VS 2023 VS 2029
- Figure 51:
- VOLUME OF CHEESECAKES MARKET, METRIC TONNES, UNITED KINGDOM, 2017 - 2029
- Figure 52:
- VALUE OF CHEESECAKES MARKET, USD MN, UNITED KINGDOM, 2017 - 2029
- Figure 53:
- VALUE SHARE OF CHEESECAKES MARKET, BY DISTRIBUTION CHANNEL , %, UNITED KINGDOM, 2022 VS 2029
- Figure 54:
- VOLUME OF FROZEN DESSERTS MARKET, METRIC TONNES, UNITED KINGDOM, 2017 - 2029
- Figure 55:
- VALUE OF FROZEN DESSERTS MARKET, USD MN, UNITED KINGDOM, 2017 - 2029
- Figure 56:
- VALUE SHARE OF FROZEN DESSERTS MARKET, BY DISTRIBUTION CHANNEL , %, UNITED KINGDOM, 2022 VS 2029
- Figure 57:
- VOLUME OF ICE CREAM MARKET, METRIC TONNES, UNITED KINGDOM, 2017 - 2029
- Figure 58:
- VALUE OF ICE CREAM MARKET, USD MN, UNITED KINGDOM, 2017 - 2029
- Figure 59:
- VALUE SHARE OF ICE CREAM MARKET, BY DISTRIBUTION CHANNEL , %, UNITED KINGDOM, 2022 VS 2029
- Figure 60:
- VOLUME OF MOUSSES MARKET, METRIC TONNES, UNITED KINGDOM, 2017 - 2029
- Figure 61:
- VALUE OF MOUSSES MARKET, USD MN, UNITED KINGDOM, 2017 - 2029
- Figure 62:
- VALUE SHARE OF MOUSSES MARKET, BY DISTRIBUTION CHANNEL , %, UNITED KINGDOM, 2022 VS 2029
- Figure 63:
- VOLUME OF OTHERS MARKET, METRIC TONNES, UNITED KINGDOM, 2017 - 2029
- Figure 64:
- VALUE OF OTHERS MARKET, USD MN, UNITED KINGDOM, 2017 - 2029
- Figure 65:
- VALUE SHARE OF OTHERS MARKET, BY DISTRIBUTION CHANNEL , %, UNITED KINGDOM, 2022 VS 2029
- Figure 66:
- VOLUME OF MILK MARKET BY PRODUCT TYPE, METRIC TONNES, UNITED KINGDOM, 2017 - 2029
- Figure 67:
- VALUE OF MILK MARKET BY PRODUCT TYPE, USD MN, UNITED KINGDOM, 2017 - 2029
- Figure 68:
- VOLUME SHARE OF MILK MARKET BY PRODUCT TYPE, %, UNITED KINGDOM, 2017 VS 2023 VS 2029
- Figure 69:
- VALUE SHARE OF MILK MARKET BY PRODUCT TYPE, %, UNITED KINGDOM, 2017 VS 2023 VS 2029
- Figure 70:
- VOLUME OF CONDENSED MILK MARKET, METRIC TONNES, UNITED KINGDOM, 2017 - 2029
- Figure 71:
- VALUE OF CONDENSED MILK MARKET, USD MN, UNITED KINGDOM, 2017 - 2029
- Figure 72:
- VALUE SHARE OF CONDENSED MILK MARKET, BY DISTRIBUTION CHANNEL , %, UNITED KINGDOM, 2022 VS 2029
- Figure 73:
- VOLUME OF FLAVORED MILK MARKET, METRIC TONNES, UNITED KINGDOM, 2017 - 2029
- Figure 74:
- VALUE OF FLAVORED MILK MARKET, USD MN, UNITED KINGDOM, 2017 - 2029
- Figure 75:
- VALUE SHARE OF FLAVORED MILK MARKET, BY DISTRIBUTION CHANNEL , %, UNITED KINGDOM, 2022 VS 2029
- Figure 76:
- VOLUME OF FRESH MILK MARKET, METRIC TONNES, UNITED KINGDOM, 2017 - 2029
- Figure 77:
- VALUE OF FRESH MILK MARKET, USD MN, UNITED KINGDOM, 2017 - 2029
- Figure 78:
- VALUE SHARE OF FRESH MILK MARKET, BY DISTRIBUTION CHANNEL , %, UNITED KINGDOM, 2022 VS 2029
- Figure 79:
- VOLUME OF POWDERED MILK MARKET, METRIC TONNES, UNITED KINGDOM, 2017 - 2029
- Figure 80:
- VALUE OF POWDERED MILK MARKET, USD MN, UNITED KINGDOM, 2017 - 2029
- Figure 81:
- VALUE SHARE OF POWDERED MILK MARKET, BY DISTRIBUTION CHANNEL , %, UNITED KINGDOM, 2022 VS 2029
- Figure 82:
- VOLUME OF UHT MILK MARKET, METRIC TONNES, UNITED KINGDOM, 2017 - 2029
- Figure 83:
- VALUE OF UHT MILK MARKET, USD MN, UNITED KINGDOM, 2017 - 2029
- Figure 84:
- VALUE SHARE OF UHT MILK MARKET, BY DISTRIBUTION CHANNEL , %, UNITED KINGDOM, 2022 VS 2029
- Figure 85:
- VOLUME OF SOUR MILK DRINKS MARKET, METRIC TONNES, UNITED KINGDOM, 2017 - 2029
- Figure 86:
- VALUE OF SOUR MILK DRINKS MARKET, USD MN, UNITED KINGDOM, 2017 - 2029
- Figure 87:
- VALUE SHARE OF SOUR MILK DRINKS MARKET, BY DISTRIBUTION CHANNEL , %, UNITED KINGDOM, 2022 VS 2029
- Figure 88:
- VOLUME OF YOGURT MARKET BY PRODUCT TYPE, METRIC TONNES, UNITED KINGDOM, 2017 - 2029
- Figure 89:
- VALUE OF YOGURT MARKET BY PRODUCT TYPE, USD MN, UNITED KINGDOM, 2017 - 2029
- Figure 90:
- VOLUME SHARE OF YOGURT MARKET BY PRODUCT TYPE, %, UNITED KINGDOM, 2017 VS 2023 VS 2029
- Figure 91:
- VALUE SHARE OF YOGURT MARKET BY PRODUCT TYPE, %, UNITED KINGDOM, 2017 VS 2023 VS 2029
- Figure 92:
- VOLUME OF FLAVORED YOGURT MARKET, METRIC TONNES, UNITED KINGDOM, 2017 - 2029
- Figure 93:
- VALUE OF FLAVORED YOGURT MARKET, USD MN, UNITED KINGDOM, 2017 - 2029
- Figure 94:
- VALUE SHARE OF FLAVORED YOGURT MARKET, BY DISTRIBUTION CHANNEL , %, UNITED KINGDOM, 2022 VS 2029
- Figure 95:
- VOLUME OF UNFLAVORED YOGURT MARKET, METRIC TONNES, UNITED KINGDOM, 2017 - 2029
- Figure 96:
- VALUE OF UNFLAVORED YOGURT MARKET, USD MN, UNITED KINGDOM, 2017 - 2029
- Figure 97:
- VALUE SHARE OF UNFLAVORED YOGURT MARKET, BY DISTRIBUTION CHANNEL , %, UNITED KINGDOM, 2022 VS 2029
- Figure 98:
- VOLUME OF DAIRY MARKET BY DISTRIBUTION CHANNEL, METRIC TONNES, UNITED KINGDOM, 2017 - 2029
- Figure 99:
- VALUE OF DAIRY MARKET BY DISTRIBUTION CHANNEL, USD MN, UNITED KINGDOM, 2017 - 2029
- Figure 100:
- VOLUME SHARE OF DAIRY MARKET, BY DISTRIBUTION CHANNEL , %, UNITED KINGDOM, 2017 VS 2023 VS 2029
- Figure 101:
- VALUE SHARE OF DAIRY MARKET, BY DISTRIBUTION CHANNEL , %, UNITED KINGDOM, 2017 VS 2023 VS 2029
- Figure 102:
- VOLUME OF DAIRY MARKET BY SUB DISTRIBUTION CHANNELS, METRIC TONNES, UNITED KINGDOM, 2017 - 2029
- Figure 103:
- VALUE OF DAIRY MARKET BY SUB DISTRIBUTION CHANNELS, USD MN, UNITED KINGDOM, 2017 - 2029
- Figure 104:
- VOLUME SHARE OF DAIRY MARKET, BY SUB DISTRIBUTION CHANNELS , %, UNITED KINGDOM, 2017 VS 2023 VS 2029
- Figure 105:
- VALUE SHARE OF DAIRY MARKET, BY SUB DISTRIBUTION CHANNELS , %, UNITED KINGDOM, 2017 VS 2023 VS 2029
- Figure 106:
- VOLUME OF DAIRY MARKET SOLD VIA CONVENIENCE STORES, METRIC TONNES, UNITED KINGDOM, 2017 - 2029
- Figure 107:
- VALUE OF DAIRY MARKET SOLD VIA CONVENIENCE STORES, USD MN, UNITED KINGDOM, 2017 - 2029
- Figure 108:
- VALUE SHARE OF DAIRY MARKET, SOLD VIA CONVENIENCE STORES, BY CATEGORY , %, UNITED KINGDOM, 2022 VS 2029
- Figure 109:
- VOLUME OF DAIRY MARKET SOLD VIA ONLINE RETAIL, METRIC TONNES, UNITED KINGDOM, 2017 - 2029
- Figure 110:
- VALUE OF DAIRY MARKET SOLD VIA ONLINE RETAIL, USD MN, UNITED KINGDOM, 2017 - 2029
- Figure 111:
- VALUE SHARE OF DAIRY MARKET, SOLD VIA ONLINE RETAIL, BY CATEGORY , %, UNITED KINGDOM, 2022 VS 2029
- Figure 112:
- VOLUME OF DAIRY MARKET SOLD VIA SPECIALIST RETAILERS, METRIC TONNES, UNITED KINGDOM, 2017 - 2029
- Figure 113:
- VALUE OF DAIRY MARKET SOLD VIA SPECIALIST RETAILERS, USD MN, UNITED KINGDOM, 2017 - 2029
- Figure 114:
- VALUE SHARE OF DAIRY MARKET, SOLD VIA SPECIALIST RETAILERS, BY CATEGORY , %, UNITED KINGDOM, 2022 VS 2029
- Figure 115:
- VOLUME OF DAIRY MARKET SOLD VIA SUPERMARKETS AND HYPERMARKETS, METRIC TONNES, UNITED KINGDOM, 2017 - 2029
- Figure 116:
- VALUE OF DAIRY MARKET SOLD VIA SUPERMARKETS AND HYPERMARKETS, USD MN, UNITED KINGDOM, 2017 - 2029
- Figure 117:
- VALUE SHARE OF DAIRY MARKET, SOLD VIA SUPERMARKETS AND HYPERMARKETS, BY CATEGORY , %, UNITED KINGDOM, 2022 VS 2029
- Figure 118:
- VOLUME OF DAIRY MARKET SOLD VIA OTHERS (WAREHOUSE CLUBS, GAS STATIONS, ETC.), METRIC TONNES, UNITED KINGDOM, 2017 - 2029
- Figure 119:
- VALUE OF DAIRY MARKET SOLD VIA OTHERS (WAREHOUSE CLUBS, GAS STATIONS, ETC.), USD MN, UNITED KINGDOM, 2017 - 2029
- Figure 120:
- VALUE SHARE OF DAIRY MARKET, SOLD VIA OTHERS (WAREHOUSE CLUBS, GAS STATIONS, ETC.), BY CATEGORY , %, UNITED KINGDOM, 2022 VS 2029
- Figure 121:
- VOLUME OF DAIRY MARKET SOLD VIA ON-TRADE, METRIC TONNES, UNITED KINGDOM, 2017 - 2029
- Figure 122:
- VALUE OF DAIRY MARKET SOLD VIA ON-TRADE, USD MN, UNITED KINGDOM, 2017 - 2029
- Figure 123:
- VALUE SHARE OF DAIRY MARKET, SOLD VIA ON-TRADE, BY CATEGORY , %, UNITED KINGDOM, 2022 VS 2029
- Figure 124:
- MOST ACTIVE COMPANIES BY NUMBER OF STRATEGIC MOVES, COUNT, UNITED KINGDOM, 2017 - 2029
- Figure 125:
- MOST ADOPTED STRATEGIES, COUNT, UNITED KINGDOM, 2017 - 2029
- Figure 126:
- VALUE SHARE OF MAJOR PLAYERS, %, UNITED KINGDOM
United Kingdom Dairy Industry Segmentation
Butter, Cheese, Cream, Dairy Desserts, Milk, Sour Milk Drinks, Yogurt are covered as segments by Category. Off-Trade, On-Trade are covered as segments by Distribution Channel.| Category | Butter | By Product Type | Cultured Butter | |
| Uncultured Butter | ||||
| Cheese | By Product Type | Natural Cheese | ||
| Processed Cheese | ||||
| Cream | By Product Type | Double Cream | ||
| Single Cream | ||||
| Whipping Cream | ||||
| Others | ||||
| Dairy Desserts | By Product Type | Cheesecakes | ||
| Frozen Desserts | ||||
| Ice Cream | ||||
| Mousses | ||||
| Others | ||||
| Milk | By Product Type | Condensed milk | ||
| Flavored Milk | ||||
| Fresh Milk | ||||
| Powdered Milk | ||||
| UHT Milk | ||||
| Sour Milk Drinks | ||||
| Yogurt | By Product Type | Flavored Yogurt | ||
| Unflavored Yogurt | ||||
| Distribution Channel | Off-Trade | Convenience Stores | ||
| Online Retail | ||||
| Specialist Retailers | ||||
| Supermarkets and Hypermarkets | ||||
| Others (Warehouse clubs, gas stations, etc.) | ||||
| On-Trade | ||||
Need A Different Region or Segment?
Customize Now
Market Definition
- Butter - Butter is a yellow-to-white solid emulsion of fat globules, water, and inorganic salts produced by churning the cream from cows’ milk
- Dairy - Dairy product include milk and any of the foods made from milk, including butter, cheese, ice cream, yogurt, and condensed and dried milk.
- Frozen Desserts - Frozen dairy dessert means and includes products containing milk or cream and other ingredients which are frozen or semi-frozen prior to consumption, such as ice milk or sherbet, including frozen dairy desserts for special dietary purposes, and sorbet
- Sour Milk Drinks - Sour milk is thick, curdled milk, with a sour taste, obtained from the fermentation of milk. Sour milk drinks such as kefir, laban, buttermilk have been considered in the study
| Keyword | Definition |
|---|---|
| Cultured Butter | Cultured butter is prepared by having the raw butter go through chemical processing and has been added with certain emulsifiers and foreign ingredients. |
| Uncultured Butter | This type of butter is one which has not been processed in any way |
| Natural Cheese | The type of cheese in its most natural form. It is made from natural and simple products and ingredients, including fresh and natural salts, natural colors, enzymes, and high-quality milk. |
| Processed Cheese | Processed cheese undergoes the same processes as natural cheese; however, it requires more steps and many different forms of ingredients. Making processed cheese involves melting natural cheese, emulsifying it, and adding preservatives and other artificial ingredients or colorings. |
| Single Cream | Single cream contains around 18% fat. It’s a single layer of cream that appears over boiled milk. |
| Double Cream | Double cream contains 48% fat, more than double the amount of fat of single cream. It’s heavier and thicker than single cream |
| Whipping Cream | This has a much higher fat percentage than single cream (36%). Used to top cakes, pies, and puddings and as a thickener for sauces, soups, and fillings. |
| Frozen Desserts | Desserts that are meant to be eaten in frozen condition. E.g., sherbets, sorbets, frozen yogurts |
| UHT Milk (Ultra-high temperature milk) | Milk heated at a very high temperature. Ultra-high-temperature processing (UHT) of milk involves heating for 1–8 sec at 135–154°C. which kills the spore-forming pathogenic microorganism, resulting in a product with a shelf-life of several months. |
| Non-dairy butter/Plant-based butter | Butter made from plant-derived oil such as coconut, palm, etc. |
| Non-dairy Yogurt | Yogurt made from typically made from nuts, like almonds, cashews, coconuts, and even other foods like soybeans, plantains, oats, and peas |
| On-trade | It refers to restaurants, QSRs, and bars. |
| Off-trade | It refers to supermarkets, hypermarkets, on-line channels, etc. |
| Neufchatel cheese | One of the oldest kinds of cheese in France. It is a soft, slightly crumbly, mold-ripened, bloomy-rind cheese made in the Neufchâtel-en-Bray region of Normandy. |
| Flexitarian | It refers to a consumer preferring a semi-vegetarian diet, that is centered on plant foods with limited or occasional inclusion of meat. |
| Lactose Intolerance | Lactose intolerance is a reaction in digestive system to lactose, the sugar in milk. It causes uncomfortable symptoms in response to the consumption of dairy products. |
| Cream Cheese | Cream cheese is a soft and creamy fresh cheese with a tangy taste made from milk and cream. |
| Sorbets | Sorbet is a frozen dessert made using ice combined with fruit juice, fruit purée, or other ingredients, such as wine, liqueur, or honey. |
| Sherbet | Sherbet is a sweetened frozen dessert made with fruit and some sort of dairy product such as milk or cream. |
| Shelf stable | Foods that can be safely stored at room temperature, or "on the shelf," for at least one year and do not have to be cooked or refrigerated to eat safely. |
| DSD | Direct Store Delivery is the process in supply chain management wherein the product is delivered from manufacturing plant directly to the retailer. |
| OU Kosher | Orthodox Union Kosher is a kosher certification agency based in New York City. |
| Gelato | Gelato is a frozen creamy dessert made with milk, heavy cream and sugar. |
| Grass-fed Cows | Grass-fed cows are allowed to graze in pastures, where they eat a variety of grasses and clover. |
Need More Details on Market Definition?
Ask a Question
Research Methodology
Mordor Intelligence follows a four-step methodology in all our reports.
- Step-1: Identify Key Variables: In order to build a robust forecasting methodology, the variables and factors identified in Step 1 are tested against available historical market numbers. Through an iterative process, the variables required for market forecast are set, and the model is built on the basis of these variables.
- Step-2: Build a Market Model: Market-size estimations for the forecast years are in nominal terms. Inflation is not a part of the pricing, and the average selling price (ASP) is kept constant throughout the forecast period for each country.
- Step-3: Validate and Finalize: In this important step, all market numbers, variables, and analyst calls are validated through an extensive network of primary research experts from the market studied. The respondents are selected across levels and functions to generate a holistic picture of the market studied.
- Step-4: Research Outputs: Syndicated Reports, Custom Consulting Assignments, Databases & Subscription Platforms

Get More Details On Research Methodology
Download PDF


