
Market Overview
| Study Period | 2020 - 2031 |
|---|---|
| Forecast Data Period | 2026 - 2031 |
| Base Year Market Size (2025) | USD 1.18 Billion |
| Market Size (2026) | USD 1.33 Billion |
| Market Size (2031) | USD 2.23 Billion |
| Growth Rate (2026 - 2031) | 10.89 % |
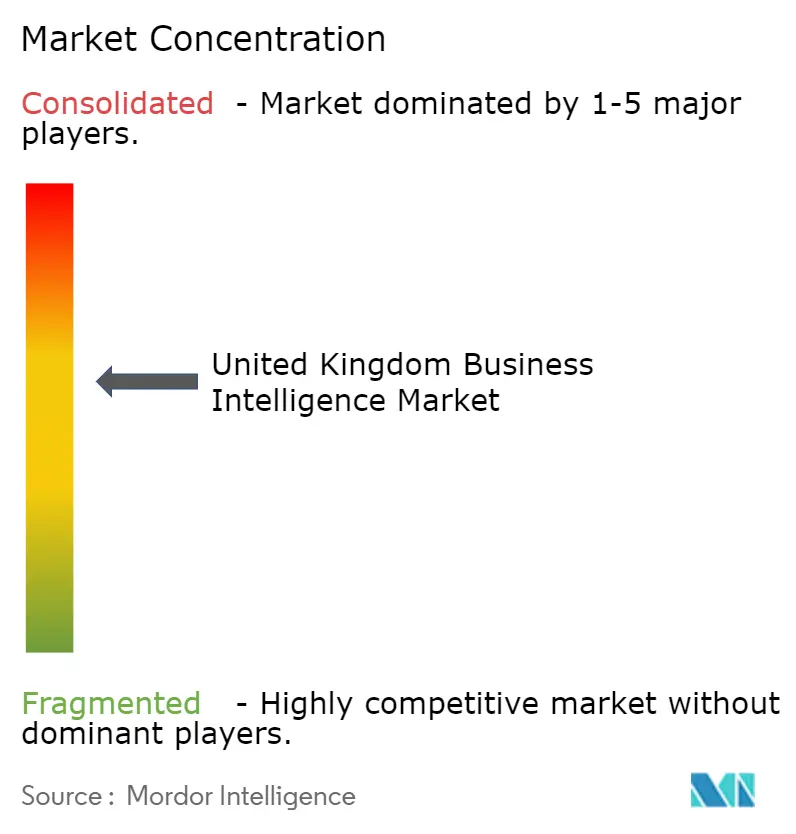
| Market Concentration | Medium |
Major Players *Disclaimer: Major Players sorted in no particular order Image © Mordor Intelligence. Reuse requires attribution under CC BY 4.0. | |
United Kingdom Business Intelligence Market Analysis by Mordor Intelligence
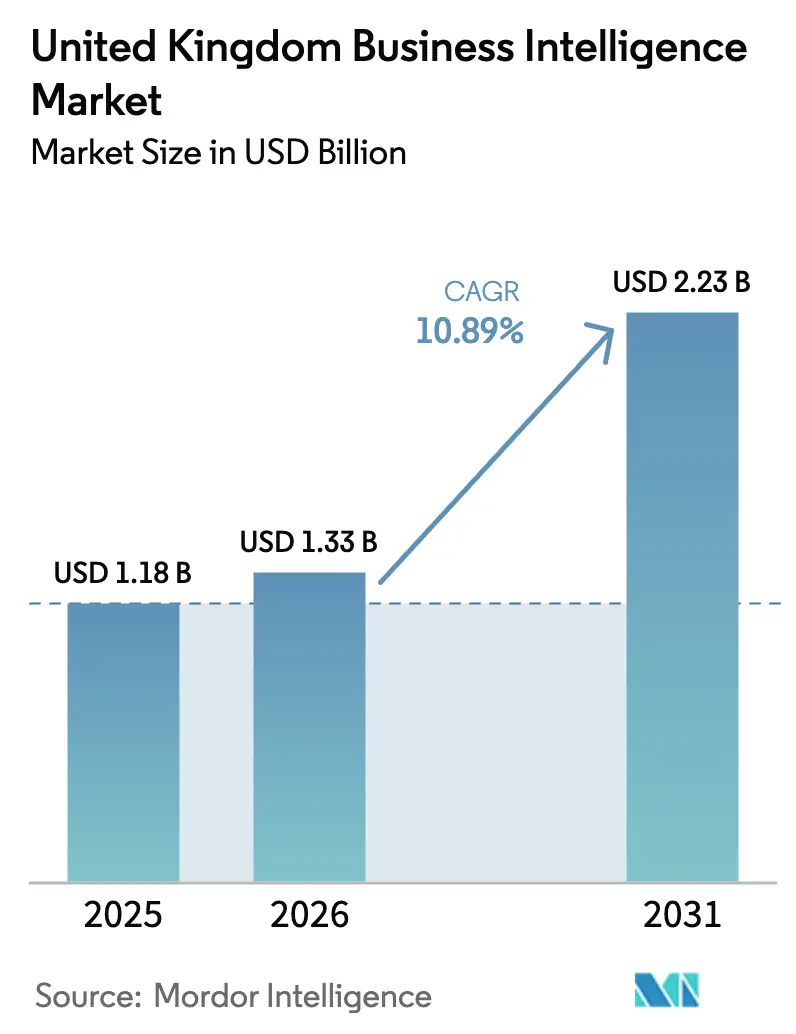
The United Kingdom Business Intelligence Market size is expected to grow from USD 1.18 billion in 2025 to USD 1.33 billion in 2026 and is forecast to reach USD 2.23 billion by 2031 at 10.89% CAGR over 2026-2031. Regulatory clarity after Brexit, accelerated cloud adoption among small and medium enterprises, and the rapid infusion of generative-AI capabilities into analytics platforms are the principal forces behind this expansion. Vendors that combine compliance-grade data governance with low-code customization continue to capture outsized attention from banking, healthcare, and public-sector buyers. Investment is flowing toward embedded analytics that eliminate context switching for front-line employees, while demand for implementation services is climbing as hybrid architectures become normal. At the same time, lingering technical debt, data-sovereignty concerns, and a shortage of machine-learning talent temper the overall growth trajectory.
Key Report Takeaways
- By component, software accounted for 72.00% revenue share in 2025, while services are advancing at a 15.20% CAGR through 2031.
- By deployment mode, cloud captured 64.00% of the United Kingdom business intelligence market share in 2025 and is expanding at a 17.80% CAGR through 2031.
- By organization size, large enterprises held 58.00% share in 2025, whereas small and medium enterprises are forecast to grow at an 18.30% CAGR to 2031.
- By end-user vertical, healthcare and life sciences are advancing at a 16.70% CAGR, the highest across industries.
Note: Market size and forecast figures in this report are generated using Mordor Intelligence’s proprietary estimation framework, updated with the latest available data and insights as of January 2026.
United Kingdom Business Intelligence Market Trends and Insights
Drivers Impact Analysis*
| Driver | (~) % Impact on CAGR Forecast | Geographic Relevance | Impact Timeline |
|---|---|---|---|
| Proliferation of IoT-enabled Data Streams | +2.1% | England manufacturing clusters, spillover to Scotland and Wales | Medium term (2-4 years) |
| Cloud-first Policy Among UK SMEs | +2.8% | Nationwide, with early gains in London, Manchester, Edinburgh | Short term (≤ 2 years) |
| Need for Real-time Decision Intelligence in Finance | +1.9% | London and Edinburgh financial districts, expanding to regional hubs | Short term (≤ 2 years) |
| Government Smart-City Initiatives | +1.5% | Manchester, Birmingham, Leeds, Glasgow, Edinburgh | Long term (≥ 4 years) |
| Rise of Embedded BI in Operational Apps | +1.7% | Nationwide, strongest in banking, financial services, and retail | Medium term (2-4 years) |
| Generative-AI-Augmented Analytics Platforms | +2.4% | Nationwide, early adoption in technology, financial services, and healthcare | Short term (≤ 2 years) |
| Source: Mordor Intelligence | |||
Cloud-first Policy Among UK SMEs
Small and medium enterprises comprise 99.9% of UK businesses and are pivoting to software-as-a-service analytics that avoid upfront capital expenditure. Adoption among these firms rose 34% between 2024 and 2025 according to HM Revenue and Customs, placing business intelligence behind only email and accounting workloads in popularity.[1] Consumption-based pricing aligns operating costs with revenue cycles, while government grants lower entry barriers. Vendors are now shipping industry templates that cut implementation times from months to weeks. Despite the momentum, 42% of SMEs still flag data-sovereignty and vendor lock-in as obstacles, prompting hybrid architectures that keep sensitive ledgers on-premises.
Generative-AI-Augmented Analytics Platforms
Natural-language interfaces powered by large language models are democratizing analytics access. Microsoft Copilot for Power BI and Salesforce Einstein GPT for Tableau both debuted in 2025, letting finance or marketing teams generate dashboards through plain-English prompts. Early pilots reduced dashboard-creation time by 60% yet raised governance challenges when hallucinated insights surfaced. The Information Commissioner’s Office issued guidance in September 2025 reminding enterprises that accountability remains with data controllers, spurring demand for explainability features and audit trails.[2]
Proliferation of IoT-enabled Data Streams
UK manufacturers in the Midlands and North West are funneling edge-processed vibration and temperature readings into cloud dashboards that predict machine failure. Energy retailers have installed smart meters in 30 million homes, yielding granular consumption datasets now exploited for dynamic pricing. Only 18% of utilities had integrated these feeds into executive dashboards by 2025, suggesting significant headroom. Public funding of GBP 170 million (USD 215 million) through the Industrial Strategy Challenge Fund accelerated sensor adoption across advanced manufacturing.
Need for Real-time Decision Intelligence in Finance
Financial-services firms in London and Edinburgh are swapping nightly batch jobs for streaming analytics that ingest trades and credit signals in sub-second intervals. The Financial Conduct Authority’s Consumer Duty regulation, in force since July 2024, mandates that product recommendations rely on current data, not stale customer segments. Challenger banks, architected on cloud-native stacks, already process over 100 million monthly transactions through streaming pipelines that personalize overdraft offers in real time. Larger incumbents are retrofitting mainframe cores with event-streaming layers, though talent scarcity in both COBOL and modern frameworks slows rollout.
Restraints Impact Analysis*
| Restraint | (~) % Impact on CAGR Forecast | Geographic Relevance | Impact Timeline |
|---|---|---|---|
| Shortage of Advanced Analytics Talent | -1.4% | National, acute in Scotland, Wales, and Northern Ireland outside major cities | Long term (≥ 4 years) |
| Data-Residency and Sovereignty Concerns Post-Brexit | -1.1% | National, particularly for financial services and the public sector | Medium term (2-4 years) |
| High Cost of Modern Data Platforms for SMEs | -0.9% | National, concentrated among retail, hospitality, and regional manufacturers | Short term (≤ 2 years) |
| Legacy IT Integration Complexities | -0.8% | England and Scotland enterprises with decades-old ERP and mainframe systems | Long term (≥ 4 years) |
| Source: Mordor Intelligence | |||
Shortage of Advanced Analytics Talent
Tech Nation tallied a deficit of 178,000 technology professionals in 2025, a gap that directly constrains business intelligence rollouts. Large firms often backfill with consultancies, but mid-market companies lack comparable budgets. While universities expand data-science cohorts, graduates frequently gravitate to higher-paying technology roles or emigrate. The Apprenticeship Levy redirects 0.5% of large-company payrolls into training, yet employers argue that six-month boot camps create mid-level technicians rather than strategists capable of framing business questions.
Data-Residency and Sovereignty Concerns Post-Brexit
The end of EU adequacy compelled British firms to adopt Standard Contractual Clauses or Binding Corporate Rules when exporting personal data. The Information Commissioner’s Office issued 14 enforcement notices in 2025 for unlawful transfers, reinforcing the pressure to keep data within UK borders. Public agencies are outright barred from storing classified datasets abroad, which pushes analytics vendors toward sovereign-cloud offerings. Multinationals sometimes run bifurcated environments: one stack for EU customers, another for UK operations.[3]
*Our forecasts treat driver/restraint impacts as directional, not additive. The impact forecasts reflect baseline growth, mix effects, and variable interactions.
Segment Analysis
By Component: Services Surge as Complexity Mounts
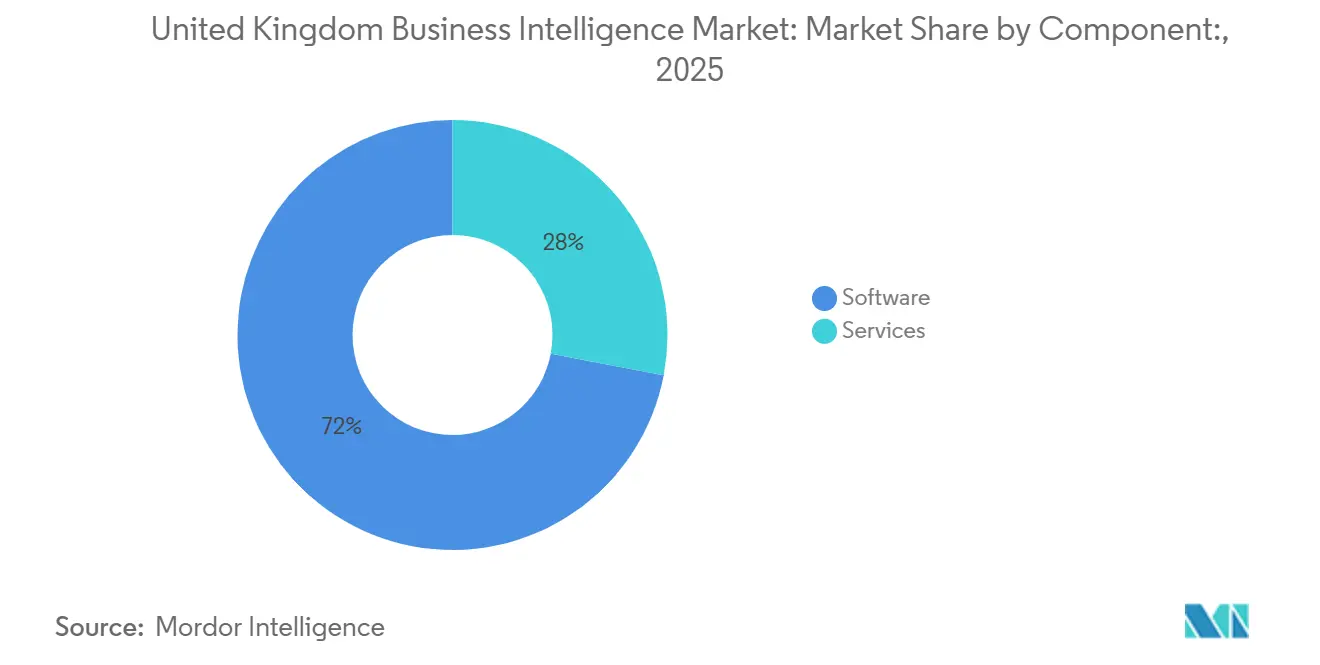
Spending on software commanded a 72.00% share of the United Kingdom business intelligence market in 2025, underscoring the entrenched position of platforms such as Power BI, SAP Analytics Cloud, and Tableau. Implementation projects, however, are growing more intricate as enterprises migrate aging reporting suites to the cloud and embed AI models into dashboards. System integrators now oversee data-quality remediation, user-acceptance testing, and multi-cloud governance that can span 18 months and exceed GBP 5 million (USD 6.3 million).
Service revenue is consequently rising at a 15.20% annual clip. Vendors package licenses with pre-configured dashboards, training, and managed data pipelines, compressing deployment cycles for SMEs. Consulting firms also market analytics-as-a-service subscriptions that give clients fractional access to data scientists and DevOps engineers. The result is a virtuous loop: rising technical complexity fuels demand for expertise, and that expertise amplifies the value derived from software investments, thereby enlarging overall United Kingdom business intelligence market / UK BI market revenue.
By Deployment Mode: Cloud Dominance Accelerates
Cloud deployments captured 64.00% of the United Kingdom business intelligence market share in 2025, validating the government’s Cloud First policy that requires public bodies to favor hosted solutions. The appeal is clear: automatic upgrades, usage-based billing, and global access for hybrid workforces. Even risk-averse banks are adopting cloud sandboxes for development and test workloads while keeping sensitive ledgers on-premises.
The United Kingdom business intelligence market size attributable to cloud is projected to expand at a 17.80% CAGR, aided by sovereign-cloud regions operated by hyperscalers under British legal jurisdiction. Manufacturers and healthcare systems increasingly adopt hybrid patterns, retaining latency-sensitive data locally and bursting analytical workloads to the public cloud for scale. On-premises deployments in the UK business intelligence (BI) market will persist in pockets with extreme residency or air-gap mandates, yet hybrid architectures that balance control and elasticity are becoming the default.
By Organization Size: SMEs Close the Gap
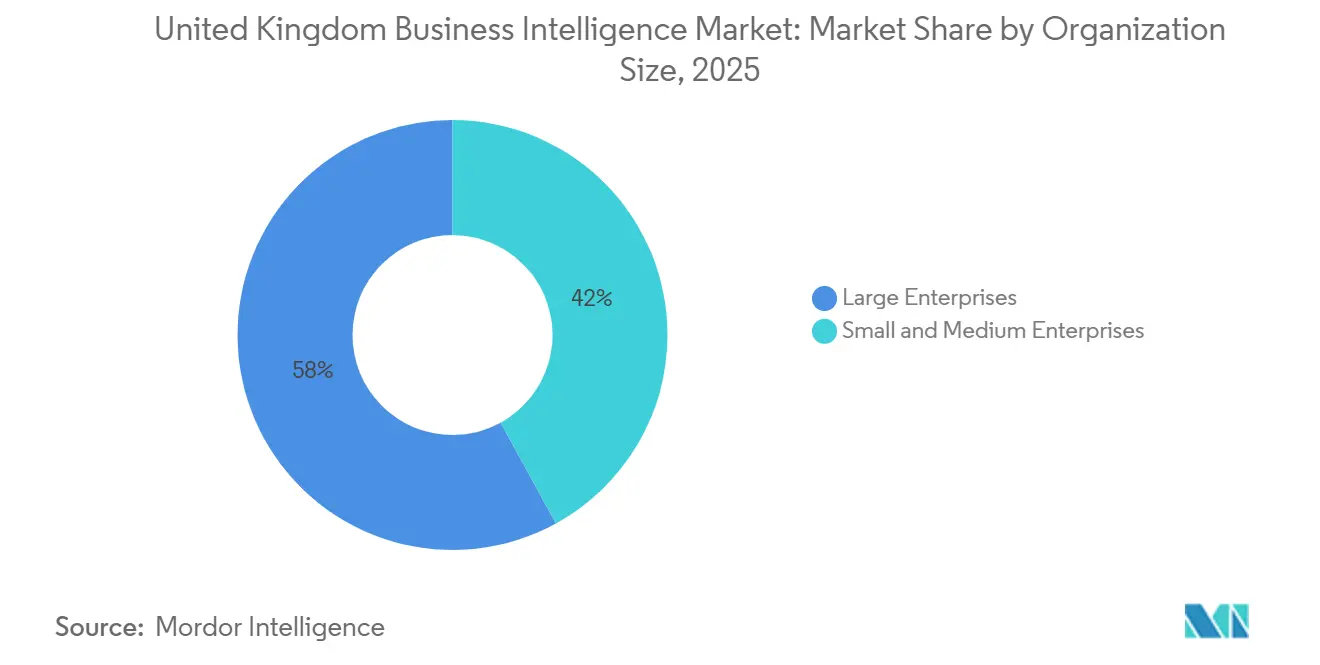
Large enterprises commanded 58.00% of spending in 2025, reflecting their deeper budgets, complex data estates, and long-standing relationships with vendors that bundle analytics with broader technology suites. Within the United Kingdom business intelligence market size allocated to organization tiers, these companies still anchor most multi-year contracts that involve data-quality remediation, change-management programs, and cross-functional governance councils. Even so, finance chiefs now scrutinize total cost of ownership more closely, steering some workloads to consumption-priced cloud sandboxes while keeping high-risk ledgers on-premises. This hybrid stance preserves control over regulated data yet gives development teams elastic compute for experimentation, accelerating proof-of-concept cycles from months to weeks. Board-level urgency to embed predictive models in daily decision-making reinforces demand for dedicated analytics centers of excellence staffed with data engineers, citizen-developer coaches, and domain specialists who turn insights into operational routines.
Small and medium enterprises are rewriting the growth script by adopting cloud analytics at an 18.30% CAGR, a pace nearly double that of their larger peers. Government programs such as Help to Grow: Digital subsidize up to 50% of qualifying software costs, while starter tiers priced below GBP 50 (USD 63) per user per month make enterprise-grade tooling accessible to family-owned retailers and regional manufacturers. These firms typically begin with off-the-shelf dashboards for inventory, marketing, or cash-flow visibility, then layer in machine-learning recommendations as data maturity improves. Churn remains higher than in the enterprise segment because SMEs experiment with multiple vendors searching for the right fit, a dynamic that penalizes platforms lacking intuitive interfaces or guided onboarding. Vendors that deliver low-code data modeling, embedded training content, and proactive customer-success outreach are best positioned to turn early-stage pilots into multi-year renewals, thereby expanding their share of the United Kingdom business intelligence market.
By End-User Vertical: Healthcare Emerges as Growth Leader
Banking, financial services, and insurance contributed 26.00% of spending in 2025, supported by real-time risk analytics and regulatory reporting. Yet healthcare and life sciences top the growth chart at 16.70% CAGR. The National Health Service is rolling out federated platforms that stitch together electronic health records, imaging, and genomics, empowering population-health management.
Pharmaceutical companies leverage analytics to accelerate drug discovery and pharmacovigilance, while public-sector agencies employ dashboards to optimize resource allocation. Other verticals, including retail, manufacturing, and utilities, continue to invest in IoT-enabled telemetry for predictive maintenance and supply-chain optimization, bolstering overall United Kingdom business intelligence market momentum.
Geography Analysis
England generated 46.00% of revenue in 2025 on the strength of London’s finance and technology ecosystems. Secondary cities such as Manchester, Birmingham, and Leeds have become vibrant analytics hubs, supported by public investment in broadband and relocation of government functions outside the capital. Smart-city programs in these metros are pushing demand for real-time dashboards that integrate transportation, energy, and safety data.
Scotland’s share is smaller but growing, the fastest among the UK nations. Edinburgh’s fintech nucleus, Glasgow’s advanced manufacturing, and devolved government funding of GBP 120 million (USD 152 million) for data infrastructure are converging to attract vendors seeking less-saturated markets. Wales and Northern Ireland trail in absolute terms yet benefit from Levelling Up funds earmarked for digital skills and connectivity. Northern Irish firms also navigate dual UK and EU data-protection regimes when serving cross-border customers, adding complexity but also creating consulting opportunities.
Regional disparities in broadband, venture capital, and analytics talent still hinder uniform adoption. The United Kingdom business intelligence market, however, is expected to narrow this gap as training programs mature and sovereign-cloud regions proliferate. England will likely retain leadership through 2031, yet Scotland’s policy support and growing technology base position it as the long-term growth engine.
Regulatory Landscape
UK business intelligence deployments operate under the UK GDPR and the Data Protection Act 2018, with the Information Commissioner’s Office (ICO) tightening expectations around analytics, automated decision-making, and cross-border transfers. In 2025, the ICO issued 14 enforcement notices related to unlawful international data transfers, which strengthens the case for residency-aware architectures and governance controls, particularly for public sector and financial services buyers.
Platform power and data access rules are also influencing vendor and buyer strategies. The Digital Markets, Competition and Consumers Act 2024 empowers the Competition and Markets Authority (CMA) to designate firms with Strategic Market Status and apply conduct requirements that shape how dominant platforms manage data, interoperability, and distribution. Alongside this, the Data (Use and Access) Act 2025 establishes a legislative framework for data access and digital verification services. The Data Protection Act 2018 (Code of Practice on Artificial Intelligence and Automated Decision-Making) Regulations 2026 require the ICO to prepare a statutory code for AI and automated decision-making, which in turn pushes enterprises toward auditable model governance and documented controls across BI workflows.
Value Chain Analysis
The UK BI value chain starts with data generation and aggregation across enterprise systems (ERP, CRM, core banking), IoT telemetry, and public sector datasets, then moves through ingestion and integration layers (connectors, ETL/ELT, streaming). Data management follows, covering quality, lineage, metadata, and master data, before analytics consumption through dashboards, embedded BI, and natural-language interfaces. Hyperscale cloud and colocation data center providers supply compute and storage, while BI platform vendors such as Microsoft, SAP, and Salesforce/Tableau build semantic layers, governance tooling, and AI-assisted authoring on top of these foundations.
Implementation, migration, and managed services represent the largest downstream leverage point and are delivered by system integrators, consultancies, and vendor professional services that handle hybrid architectures, security configuration, and ongoing operations. Government initiatives also shape inputs into the chain, including actions adopted in January 2025 under the AI Opportunities Action Plan, such as AI Growth Zones to speed up data center planning approvals and grid access, which affects infrastructure readiness for data-intensive analytics. On distribution and procurement, the Digital Markets, Competition and Consumers Act 2024 creates a new compliance environment for large digital intermediaries via the CMA, influencing how gatekeepers shape access to analytics apps, data flows, and embedded BI distribution.
Competitive Landscape
Market concentration is moderate, with Microsoft, SAP, and Salesforce collectively holding roughly 40% share in 2025. Their advantage lies in extensive installed bases across productivity, ERP, and CRM suites that seamlessly funnel customers toward native analytics modules. Mid-tier players such as Qlik, IBM, and Oracle remain influential, catering to regulated industries with domain-specific accelerators and on-premises options.
Newer entrants, including ThoughtSpot, Sisense, and Domo capitalize on cloud-native architectures, consumption pricing, and natural-language interfaces. Open-source alternatives like Apache Superset and Metabase are popular among technology startups that value customization and low license costs, though they require heavier in-house engineering. Strategic imperatives revolve around embedding AI across the stack, forging cloud-provider partnerships to optimize performance, and bundling managed services that relieve buyers of DevOps burden.
Acquisitions are frequent, as incumbents plug capability gaps in data preparation, embedded BI, and vertical solutions. White-space remains in sectors such as education, hospitality, and professional services where penetration is still below 30%. Sustainability reporting and environmental, social, and governance analytics are emergent niches, stimulated by regulatory disclosure mandates. Competitive differentiation is shifting from core visualization features to domain pre-configurations, governance tooling, and total-cost-of-ownership economics.
United Kingdom Business Intelligence Industry Leaders
-
Microsoft Corporation
-
SAP SE
-
Salesforce Inc. (Tableau)
-
IBM Corporation
-
Oracle Corporation
- *Disclaimer: Major Players sorted in no particular order
Market Opportunities and Future Outlook
Public sector modernization offers a practical adoption lane for BI platforms and services through standardization and data readiness programs. The Government Digital Service published its roadmap for modern digital government in January 2026, and a data asset management policy issued in May 2026 requires departments to identify and report data assets to improve interoperability and AI readiness. That supports increased demand for cataloging, lineage, and governed self-service analytics across government. The Department for Business and Trade also published the Smart Data 2035 Strategy in March 2026 to facilitate secure data sharing across the economy, creating room for BI vendors and integrators that can operationalize consent, data quality, and standardized sharing within analytics products.
Capacity build-out is another near-term whitespace that improves the economics and feasibility of large-scale analytics, model-assisted BI, and real-time decision intelligence. In July 2026, Ark Data Centres announced an GBP 807 million expansion of its Longcross Park campus in Surrey, including a new 36MW facility, while Nebius signed a 22MW capacity agreement with Kao Data at Harlow as part of a larger UK AI infrastructure program. These announcements align with the UK Compute Roadmap direction and expand available compute for BI modernization, including workloads that combine dashboards with generative-AI-assisted analysis and agentic automation. The UK Digital Standards Strategy (2026 to 2030), published in June 2026, adds further support for an interoperability-oriented environment across AI and cybersecurity standards, creating additional space for compliance-grade governance features and cross-platform integration offerings in UK BI deployments.
Recent Industry Developments
- July 2026: Ark Data Centres announced an GBP 807 million investment to expand its Longcross Park campus in Surrey, including a new 36MW facility. Greater local capacity supports data-intensive BI and AI-augmented analytics deployments that require predictable performance and residency-aligned hosting options. It also increases the addressable footprint for BI vendors and integrators delivering cloud, hybrid, and managed analytics stacks.
- November 2025: Microsoft announced the general availability of Fabric in UK sovereign-cloud regions. This expanded platform availability helps public sector and regulated buyers align analytics and data processing with residency and governance requirements. It also strengthens Microsoft’s ability to bundle data engineering, warehousing, and BI consumption in a single governed environment for UK customers.
- July 2024: The Financial Conduct Authority’s Consumer Duty regulation entered into force, increasing expectations that customer outcomes and product recommendations are supported by current, high-quality data. This raised the urgency for streaming and near-real-time analytics in UK financial services, accelerating investment in decision intelligence pipelines that feed BI dashboards and operational applications. The compliance pressure also elevates demand for auditability, lineage, and explainability across analytics workflows.
Research Methodology Framework and Report Scope
Market Definition and Coverage
For this study, the United Kingdom business intelligence market covers spending on BI software and related services that help organizations collect, model, analyze, and visualize data for better decisions, including deployments delivered on-premises or through cloud platforms.
Scope exclusions: This sizing excludes generic IT outsourcing and custom app development work when it is not tied to BI platform delivery, implementation, or ongoing BI-specific support.
Segmentation Overview
- By Component
- Software
- Services
- By Deployment Mode
- On-premises
- Cloud
- Hybrid
- By Organization Size
- Small and Medium Enterprises
- Large Enterprises
- By End-user Vertical
- Banking, Financial Services and Insurance
- Information Technology and Telecom
- Retail and Consumer Goods
- Manufacturing and Logistics
- Healthcare and Life Sciences
- Other End-user Verticals
Data Sources, Market Sizing, and Validation
Desk Research
We start by grounding the market boundary and demand signals using public references that help keep assumptions realistic for the United Kingdom. Sources such as the UK Office for National Statistics, the Bank of England, the UK government data portal, and guidance from the Information Commissioner's Office are used to frame digital activity, sector spend direction, and data governance expectations.
Next, we check adoption and supplier-side clues using widely available materials, such as annual reports and investor presentations of relevant providers, trusted industry press, and UK tech and digital association publications. To strengthen company-level revenue mapping and track product focus changes, we also use a paid subscription for company financials and intelligence, along with a paid patent database to understand where BI functionality is evolving. The sources mentioned are illustrative only, and many other public and paid references were reviewed for data collection, validation, and clarification.
Primary Interviews and Surveys
Primary work is used to pressure-test the market boundary and turn adoption signals into sizing inputs, with a focus on UK buyers and delivery partners that see budgets and renewal cycles firsthand. We speak with BI platform users, systems integrators, managed service teams, and product specialists so pricing ranges, implementation timelines, and cloud migration pace can be checked, then applied back into the model.
Distribution of primary research fieldwork respondents
| Company type | Respondent position |
|---|---|
| Top tier: 31% | CXOs: 19% |
| Mid tier: 49% | Functional/Unit leaders: 28% |
| Smaller Players: 20% | Managers: 53% |
Market-Sizing & Forecasting
The market is sized using a top-down build that reconstructs the UK BI spending pool by linking software and services demand to enterprise digitization and analytics adoption, and then allocating it across the BI use cases included in scope. We corroborate results with selective bottom-up approximations using sampled vendor revenue disclosures, partner channel checks, and typical UK average selling price ranges multiplied by estimated active user or workload volumes.
Key inputs in the model include the UK cloud adoption pace for analytics workloads, renewal and subscription patterns, typical implementation effort by deployment model, share of spend going to services during rollouts, and changes in data and privacy requirements that can affect project timelines. Where bottom-up inputs are incomplete, gaps are handled through conservative extrapolation from comparable UK buyer cohorts and partner-reported deal mix, followed by review against macro spending direction.
For forecasting, scenario analysis is used so the model can reflect different speeds of cloud migration, AI-assisted analytics uptake, and public sector modernization timing, and these scenarios are narrowed using the most common expectations heard during interviews. Outputs are kept in USD using consistent exchange-rate timing assumptions for the modeled years so year-over-year movement is not distorted by currency swings.
Data Validation & Update Cycle
We validate the model in several passes, starting with internal variance checks across growth rates, pricing movement, and services attach assumptions, which helps flag any unrealistic jumps early. Results are then compared against independent market signals such as subscription growth patterns, large deal announcements, and UK enterprise IT spend direction, and any outliers are reviewed before sign-off.
When a gap or unusual change is found, the analyst team re-contacts selected respondents to confirm whether it reflects a real market shift or an assumption issue. Reports are refreshed annually, with interim updates when material events occur, and before delivery we do a final review pass so clients receive the latest updated view.
Mordor Intelligence's United Kingdom Business Intelligence Market Size Compared With Other Published Estimates
Published market sizes for UK business intelligence often differ because the scope boundary is not always the same, and the price and deployment assumptions can be applied in different ways. Some estimates lean more toward software publisher revenue, while others mix in broader analytics work that is not always BI specific.
Customer renewal signals and UK partner-validated services attach rates are the checks that keep Mordor Intelligence's estimate aligned to BI platform spend, rather than drifting into adjacent data services or generic IT work.
Benchmark comparison
| Source | Market Size | Gaps in Research Methodology |
|---|---|---|
| Mordor Intelligence | USD 1.18 B (2025) | |
| Regional Consultancy A | USD 4.30 B (2024) | Uses a broader interpretation of BI that can bundle adjacent analytics and transformation work, and the base year and currency handling are not clearly normalized to a single spending boundary. |
| Trade Journal B | USD 1.46 B (2025) | Appears closer to software publisher revenue only, which can undercount implementation and managed BI services that UK buyers typically purchase alongside platform subscriptions. |
The spread in published values mainly comes from what is counted as BI, plus whether services are treated as part of the market or left out, and this is amplified when different base years are used. By keeping assumptions tied to observable renewal behavior, realistic services mix, and consistent USD conversion timing, the final figure stays traceable to clear spending drivers and repeatable steps.
Key Questions Answered in the Report
What is the projected value of the United Kingdom business intelligence market in 2031?
It is forecast to reach USD 2.23 billion by 2031, growing at a 10.89% CAGR.
Which deployment mode is expanding the fastest?
Cloud deployments are advancing at a 17.80% CAGR, underpinned by the government’s Cloud First policy and sovereign-cloud regions.
Which vertical will see the highest growth through 2031?
Healthcare and life sciences lead with a 16.70% CAGR, driven by National Health Service investments in federated data platforms.
How are small and medium enterprises influencing market dynamics?
SMEs are adopting low-cost, cloud-based analytics at an 18.30% CAGR, narrowing the gap with large enterprises and spurring demand for intuitive platforms.
What major restraint could slow adoption?
A persistent shortage of advanced analytics talent, estimated at 178,000 unfilled roles in 2025, constrains project delivery for many organizations.