
Market Overview
| Study Period | 2020 - 2031 |
|---|---|
| Forecast Data Period | 2026 - 2031 |
| Base Year Market Size (2025) | USD 1.01 Billion |
| Market Size (2026) | USD 1.14 Billion |
| Market Size (2031) | USD 2.13 Billion |
| Growth Rate (2026 - 2031) | 13.22 % |
| Market Concentration | Medium |
Major Players *Disclaimer: Major Players sorted in no particular order Image © Mordor Intelligence. Reuse requires attribution under CC BY 4.0. | |
United Kingdom 3D Printing Market Analysis by Mordor Intelligence
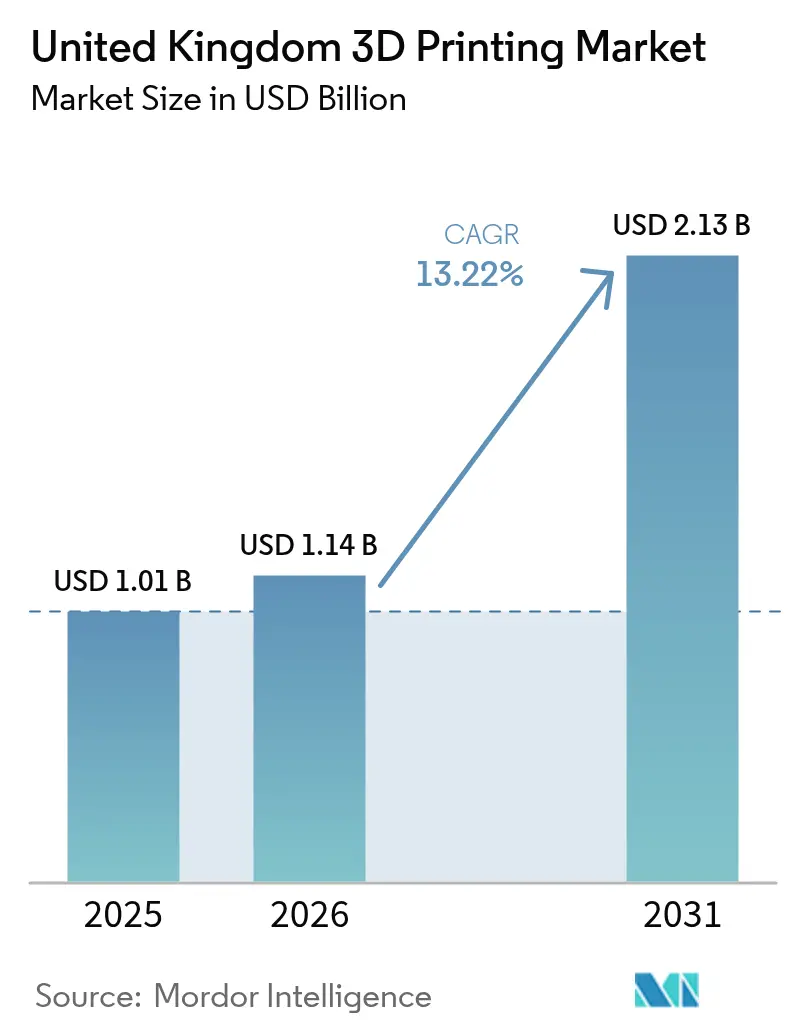
The United Kingdom 3D printing market size was valued at USD 1.01 billion in 2025 and estimated to grow from USD 1.14 billion in 2026 to reach USD 2.13 billion by 2031, at a CAGR of 13.22% during the forecast period (2026-2031). Strong government grants, defense‐linked on-site metal printing mandates, and an NHS pathway for hospital-based device fabrication form the core growth engine. Industrial customers continue to dominate purchases, but rapidly improving desktop hardware and additive-ready design software are widening the addressable user base. Certified titanium and aluminum powders keep aerospace demand high, while fast-moving ceramic applications are opening diversification opportunities. Parallel skills initiatives and Net-Zero regulations reinforce adoption momentum across automotive, rail, and renewable-energy supply chains.[1]
Key Report Takeaways
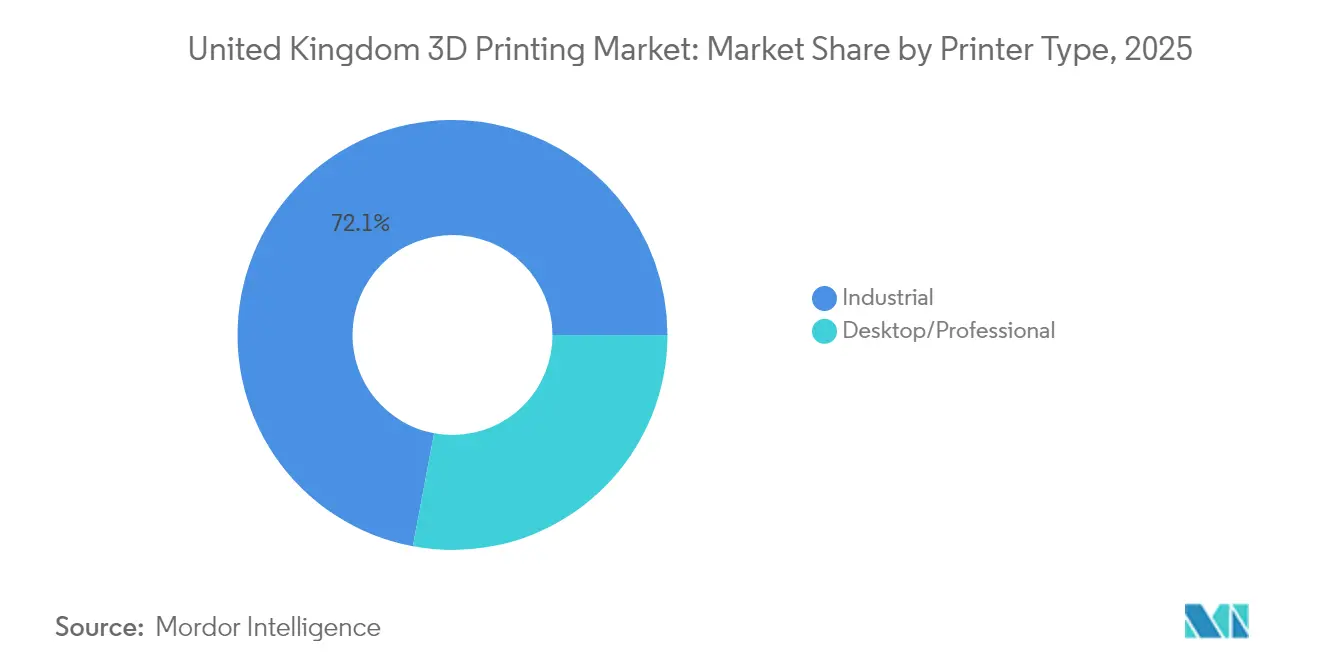
- By Printer Type, Industrial printer systems led with 72.05% of United Kingdom 3D printing market share in 2025, while desktop and professional systems are projected to clock the fastest 14.21% CAGR through 2031.
- By Material Type, Metal materials commanded 50.35% share of the United Kingdom 3D printing market size in 2025; ceramic materials are slated to rise at a 14.56% CAGR to 2031.
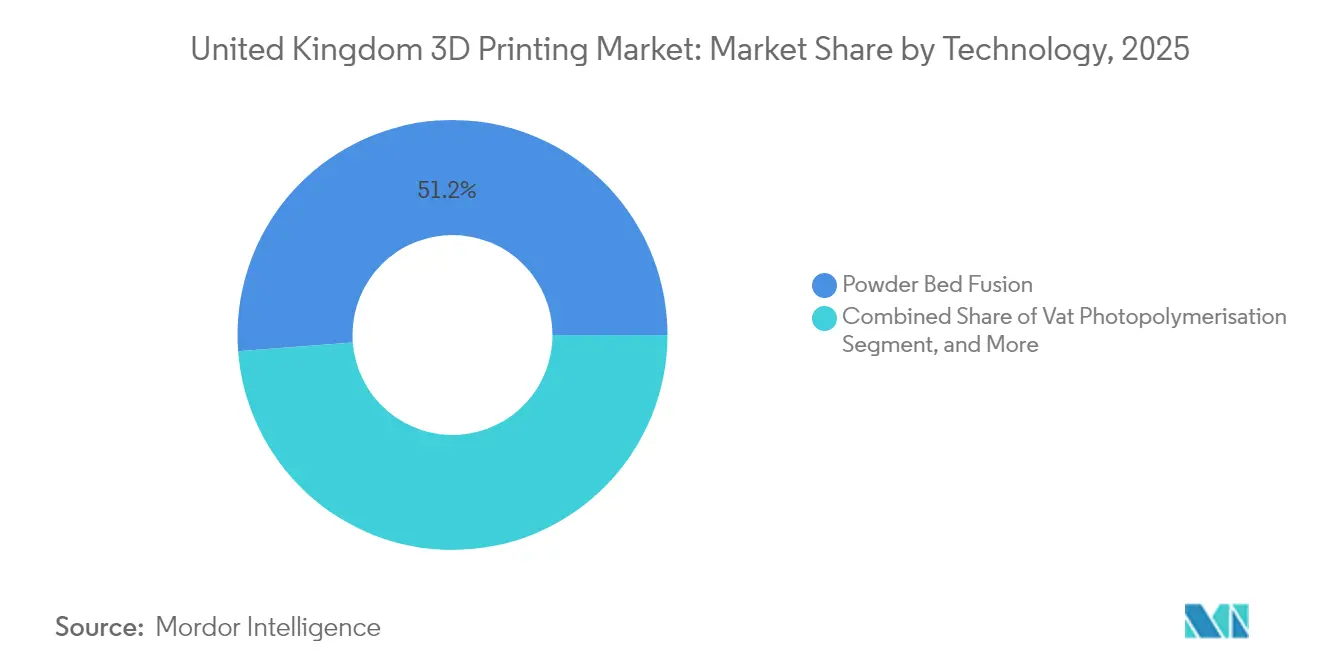
- By Technology, Powder bed fusion secured 51.20% share of the United Kingdom 3D printing market size in 2025, whereas vat photopolymerization shows the strongest 14.88% CAGR outlook.
- By Application, Aerospace and defense retained 32.68% United Kingdom 3D printing market share in 2025, yet healthcare and medical devices are expanding at a 15.05% CAGR.
- By Region, England accounted for 68.95% of the United Kingdom 3D printing market size in 2025; Northern Ireland is advancing at a 14.72% CAGR.
Note: Market size and forecast figures in this report are generated using Mordor Intelligence’s proprietary estimation framework, updated with the latest available data and insights as of 2026.
Market Trends and Insights
Drivers Impact Analysis of United Kingdom 3D Printing Market*
| Driver | (~) % Impact on CAGR Forecast | Geographic Relevance | Impact Timeline |
|---|---|---|---|
| Government grants accelerate industrial adoption | +2.1% | National (England and Scotland hubs) | Medium term (2-4 years) |
| Surging demand for large-format industrial printers | +1.8% | England and Scottish manufacturing clusters | Short term (≤ 2 years) |
| NHS framework for hospital-based medical printing | +1.5% | National, early focus in England | Medium term (2-4 years) |
| Ministry of Defence offset clauses for on-site metal AM | +1.3% | National defense corridors | Long term (≥ 4 years) |
| Net-Zero regulations drive lightweight lattice parts | +1.1% | Nationwide automotive and aerospace hubs | Long term (≥ 4 years) |
| Rise of digital spares marketplaces in rail and defense | +0.9% | National networks and depots | Medium term (2-4 years) |
| Source: Mordor Intelligence | |||
Government grants accelerate industrial adoption
Made Smarter Innovation and Innovate UK programs make capital equipment grants contingent on commercial deployment within 18 months, compressing payback horizons and de-risking first-time purchases. By 2024, Innovate UK committed GBP 78 million (USD 98.5 million) to additive manufacturing projects that span automotive tooling, certified flight parts, and hospital devices. The Aerospace Technology Institute’s matching funds reduce certification costs for powder bed fusion components, encouraging prime contractors to qualify full assemblies rather than single parts. Grant conditions also require detailed skills transfer plans, pushing equipment vendors to bundle training with every sale. As a result, small and medium enterprises secure industrial-grade printers that were previously out of reach, widening the supplier base for Tier-1 manufacturers.[2]
Surging demand for large-format industrial printers
Automotive toolmakers and architecture studios increasingly request cubic-meter build volumes to consolidate multicomponent jigs into single prints. Large-format systems such as the BigRep ONE enable production of bumper molds, HVAC ducts, and casting patterns in a single overnight run, reducing fixture lead time by up to 70% and slashing transport-related emissions. English and Scottish clusters are adopting these platforms first because of co-located composite shops and foundries that can immediately consume the printed tooling. Equipment leasing models, aided by accelerated tax allowances, support rapid fleet expansion for service bureaus.
NHS framework for hospital-based medical printing
The MHRA-endorsed pathway allows ISO 13485-accredited hospital labs to print surgical guides, maxillofacial implants, and prosthetics without per-device regulatory submissions. Early pilots at major English trusts trimmed device turnaround from four weeks to less than twenty-four hours and lowered unit costs by 60-80%. Resulting clinical success stories drive copycat adoption in Scotland and Wales. Materials suppliers benefit from steady volumes of photopolymers and PEEK filament certified for in-situ sterilization, while software vendors capture revenue from patient-specific modeling modules.
Ministry of Defence offset clauses for on-site metal AM
Defense contracts now oblige primes to integrate live metal powder bed fusion cells within production lines, ensuring secure, on-demand spares. The LAMDA project injected GBP 15 million (USD 18.9 million) into certifying titanium and aluminum alloys for flight-critical parts, accelerating qualification by harmonizing test protocols across air, land, and sea systems. Tier-1 suppliers like BAE Systems run 24-hour AM bays that also serve civil customers, unlocking economies of scale. Powder producers secure long-term volume contracts, stabilizing local supply and reducing import dependency.
Restraints Impact Analysis of United Kingdom 3D Printing Market*
| Restraint | (~) % Impact on CAGR Forecast | Geographic Relevance | Impact Timeline |
|---|---|---|---|
| High cap-ex and OPEX of metal systems | -1.9% | Nationwide industrial regions | Short term (≤ 2 years) |
| Skills shortage in design-for-additive and QC | -1.6% | Scotland and Northern England | Medium term (2-4 years) |
| Metal-powder price volatility post-Ukraine conflict | -1.2% | National titanium and alloy markets | Short term (≤ 2 years) |
| IP liability uncertainty for on-demand parts | -0.8% | Service providers nationwide | Long term (≥ 4 years) |
| Source: Mordor Intelligence | |||
High cap-ex and OPEX of metal systems
Production-class metal printers cost GBP 500,000–2 million (USD 631,000–2.5 million) and demand parallel investment in heat treatment, machining, and non-destructive testing. Metal powder, often 30–40% of total part cost, escalated 25–30% in 2024 amid supply shocks. SMEs struggle to pencil profitability without batch volumes that aerospace programs rarely offer. Leasing pools and shared hubs ease entry but introduce scheduling friction and IP leakage fears. Equipment makers now bundle closed-loop powder handling and in-chamber monitoring to shrink operating expense, yet breakeven horizons remain two to four years for most adopters.[3]
Skills shortage in design-for-additive and QC
Topology optimization, support design, and in-process inspection remain scarce competencies. The High Value Manufacturing Catapult highlights a two- to three-year lag before new graduates attain production-level proficiency. Industry responds with joint curricula: Renishaw funds additive modules at UK universities, while Skills England underwrites fast-track certifications for displaced machinists. Nevertheless, limited instructor capacity slows cohort throughput, capping short-term scaling potential.
*Our forecasts treat driver/restraint impacts as directional, not additive. The impact forecasts reflect baseline growth, mix effects, and variable interactions.
United Kingdom 3D Printing Market Segment Analysis
By Printer Type:
Industrial systems hold the lead yet accessible desktops narrow the gapIndustrial machines captured 72.05% United Kingdom 3D printing market share in 2025 as government subsidies favor production-grade hardware and as Tier-1 aerospace OEMs expanded certified lines. Desktop and professional platforms, though smaller, are climbing at a 14.21% CAGR because colleges and micro-businesses now justify in-house validation prints that compress design cycles. The United Kingdom 3D printing market size for desktop systems is projected to almost double by 2031, helped by sub-USD 10,000 resin machines that approach medical-grade accuracy.
Hybrid offerings blur categories: mid-sized gantry printers bundle industrial motion control with desktop-style UI, offering line changeover in minutes rather than hours. Vendors court education customers with subscription models that combine hardware, slicer updates, and curriculum content, ensuring sticky annual revenue. In parallel, industrial fleet operators add robot-assisted depowdering to scale throughput, minimizing labor dependencies that previously capped utilization.

By Material Type:
Metals dominate but ceramic momentum risesMetal powders delivered 50.35% of 2025 revenue, anchored in titanium and aluminum alloys for defense airframes and civil engine components. The United Kingdom 3D printing market size for metals benefits from multi-year framework agreements that shelter end users from spot price spikes. Ceramics, however, post the fastest 14.56% CAGR as dental crowns, semiconductor packages, and thermal-shock-resistant tooling shift from subtractive routes to binder-jet and stereolithography options.
Polymer filaments and resins sustain prototyping demand and enter functional roles through carbon-fiber-filled grades that replace machined aluminum fixtures. Composite pellets for large-format printers gain share in automotive jigs as OEMs target five-day concept-to-fit timelines. Powder suppliers invest in local atomization lines to derisk import reliance, while ceramic feedstock players exploit readily available raw minerals, smoothing price curves relative to metals.
By Technology:
Powder bed fusion retains authority amid photopolymer surgePowder bed fusion held 51.20% of the 2025 value, reflecting widespread qualification across Rolls-Royce engines and NHS cranial implants. Tight layer control and 30 µm laser spot sizes secure the dimensional stability required for safety-critical geometries. Vat photopolymerization, racing ahead at a 14.88% CAGR, dominates dental aligners and jewelry masters where surface finish trumps tensile strength.
Material extrusion remains the entry point for vocational schools testing design iteration, while binder jetting gains traction for stainless steel pumps that favor speed over ultimate tensile. Directed energy deposition, though niche, underpins in-situ repair of turbine blades at RAF bases, cutting aircraft downtime. Equipment roadmaps converge toward multi-process workcells that seamlessly alternate deposition and five-axis milling, promising single-setup part realisation.
By Application:
Healthcare growth nibbles at aerospace leadAerospace and defense still account for 32.68% revenue, due to backlog conversions and export engine programs. Yet the United Kingdom 3D printing market size in healthcare is accelerating at 15.05% CAGR as MHRA guidance legitimizes point-of-care manufacturing. Patient-specific cranial plates, scoliosis braces, and surgical drill guides illustrate the breadth of medical uptake.
Motorsport outfits leverage AM for race-weekend iterations, validating wind-tunnel tweaks overnight. Rail operators print cab components for legacy fleets, avoiding twelve-month tooling waits. Construction pilots explore concrete printing for complex staircases, although regulatory codes slow broad adoption. Consumer electronics brands toy with conductive polymer traces for integrated antenna housings, indicating future diversification.
Geography Analysis
England contributed 68.95% of the 2025 spend due to Midlands aerospace clusters, West Midlands automotive plants, and London’s access to venture finance. England remains the nucleus of additive activity, hosting Jaguar Land Rover’s tooling centers, Rolls-Royce’s lattice flight-part line, and Renishaw’s headquarters. Regional Made Smarter offices shepherd more than 60% of funded projects inside England, especially across the Midlands, where apprenticeship pipelines are deepest. Financial institutions in London structure equipment leases at competitive rates, boosting adoption among supply-chain SMEs.
Scotland combines offshore energy heritage with aerospace R&D to build a balanced AM portfolio. Aberdeen yards print corrosion-resistant valve components for subsea kits, mitigating extended North Sea downtime. Glasgow’s innovation district attracts photopolymer startups that cater to the city’s dental labs. Government support arrives via zero-interest loans pegged to job-creation targets, accelerating machine installs at SMEs.
Wales exploits its automotive lineage, where composite-laden FDM jigs cut Aston Martin fixture costs by 30%. Cardiff University’s research hub feeds graduates to local contract printers. Northern Ireland’s 14.72% CAGR is fueled by Bombardier using on-site additive to shrink nacelle spare part lead times, while Belfast software startups supply build monitoring solutions bundled with machine sales incentives.
Regulatory Landscape
The UK regulatory environment for 3D printed products is anchored in the UKCA regime and broader product-safety reforms. The Product Safety and Metrology etc. (Amendment) Regulations 2024 removed the expiry date for recognition of certain EU product requirements, supporting continuity for manufacturers that rely on EU test evidence and conformity assessment alongside UKCA marking. The Product Regulation and Metrology Act 2025 also introduced powers to update product-safety and metrology frameworks, which is relevant for additive manufacturing where software, feedstock, and process controls influence product characteristics.
Designated standards and enforcement pathways remain central for regulated end uses such as aerospace, defense, and healthcare. Standards published by the Secretary of State (drawing on bodies such as BSI, CEN/CENELEC, ISO, IEC, and others) underpin conformity approaches, while BSI Committee AMT/8 supports additive-manufacturing-specific standardization in the UK. In 2026, the government opened consultation on Product Safety Framework Reform, including proposed obligations on online marketplaces, and the Department for Business and Trade reiterated support for industrial digitalization through the Made Smarter adoption programme at the Make UK National Manufacturing Conference in March 2026, strengthening policy visibility for SMEs considering 3D printing.
Value Chain Analysis
The UK 3D printing value chain starts with hardware OEMs and software providers (design, slicing, simulation, and build monitoring), alongside feedstock suppliers for metals, polymers, and ceramics. These inputs feed into production cells operated by end users (notably aerospace and defense) and service bureaus, then into post-processing ecosystems that cover heat treatment, machining, surface finishing, sterilization (for medical), and non-destructive testing, followed by qualification documentation and distribution of finished parts or digital inventories. With a high share of industrial systems and powder bed fusion, certified metal powders, process control, and metrology capabilities remain key upstream constraints and differentiators.
On the downstream side, defense programs are tightening integration between production and maintenance networks, bringing capability in-house and closer to depots and bases, while also creating procurement bottlenecks that can slow onboarding of agile suppliers. The Ministry of Defence published its Defence Advanced Manufacturing Strategy in March 2025, promoting additive manufacturing for resilience and a hub-and-spoke model for forward-deployed production, and 2026 activity shows execution moving from pilots to baseline use in programs. Examples include Rheinmetall UK formalizing additive manufacturing as the baseline method for specific Challenger 3 components (June 2026) and QinetiQ deploying additive manufacturing at HM Naval Base Clyde to support Royal Navy submarine maintenance and AUKUS-aligned standards (June 2026). Localization of equipment assembly and service is also strengthening the chain, as shown by Caracol partnering with UK integrators to provide in-country integration and support for robotic additive systems (April 2026), reducing downtime risk for industrial users.
Competitive Landscape
The supplier base is moderately fragmented; the five largest vendors account for roughly 55% of installed revenue, leaving white space for consolidation. Renishaw blends metrology with dual-laser powder bed fusion, differentiating with closed-loop control that slashes scrap rates. Photocentric champions photopolymer LCD economies, selling resin formulations with 25% margin uplift over hardware. Wayland Additive deploys neutral-atom e-beam technology aimed at high-density tungsten parts for defense optics.
Service bureaus pursue vertical integration. 3DPRINTUK broadened its HP MJF fleet and insourced maintenance crews, raising uptime to 95% and capturing larger aerospace blanket orders. Rapid Fusion demonstrated a robot-tended cell that runs 24 hours with one supervisor, easing the labor bottleneck. Hybrid machine builders partner with CAM software firms to embed AI-driven parameter search, shortening job-qualification cycles and lowering the skills threshold for first-time adopters.
M&A interest rises as desktop vendors eye industrial markets. Polymer specialist RYSE 3D, fresh from a 58% sales surge and a King’s Award, is rumored to scout strategic investors. Materials providers lock in long-term powder contracts to hedge volatility and secure ISO compliance for end-use parts. Certification remains a moat: ISO 9001 and ISO 13485 accreditations unlock regulated sectors, prompting smaller players to pool resources for shared audit expenses.
United Kingdom 3D Printing Industry Leaders
-
Renishaw plc
-
Stratasys Ltd.
-
EOS GmbH
-
Materialise NV
-
Nikon SLM Solutions AG
- *Disclaimer: Major Players sorted in no particular order

United Kingdom 3D Printing Market Companies Covered in this Report
- Renishaw plc
- Stratasys Ltd.
- EOS GmbH
- Materialise NV
- Nikon SLM Solutions AG
- 3D Systems Corporation
- Wayland Additive Ltd.
- Photocentric Ltd.
- Desktop Metal Inc.
- Formlabs Inc.
- Velo3D Inc.
- Ultimaker BV
- Roboze SpA
- Additive Industries BV
- Axial3D Ltd.
- AMFG Ltd.
- AI Build Ltd.
- GE Additive (General Electric Company)
- HP Development Company LP
- Impress Dental Manufacturing Ltd.
- GEOMIQ Ltd.
- Protolabs Inc.
Market Opportunities and Future Outlook
White space is widening where UK buyers need repeatable, production-grade throughput rather than prototyping, particularly across polymer series manufacturing, defense sustainment, and regulated medical workflows. Recent facility investments point to demand for automation and near-continuous production: AMufacture expanded an industrial 3D printing facility in Portsmouth with robotic handling and multiple HP Multi Jet Fusion systems (January 2026), and TriMech-backed 3DPRINTUK increased HP Multi Jet Fusion capacity by 60% by adding three HP 5210 PRO systems (February 2025). Together, these moves create room for complementary offerings in QA automation, in-line inspection, and post-processing capacity that aligns with higher MJF utilization.
Public funding and coordination mechanisms also open near-term routes for SMEs and consortia to scale capability and certification. Innovate UK launched an advanced manufacturing supply chain innovation competition on 27 April 2026 with up to GBP 6.5 million available for collaborative industrial research projects, supporting multi-partner programs that combine additive manufacturing with digital manufacturing, AI, and robotics. Additive Manufacturing UK (AMUK) also maintains a cross-industry action plan and roadmap to broaden adoption, which can support more standardized qualification practices and stronger pipelines from R&D to production in aerospace, defense, and healthcare. The clearest opportunity clusters around solutions that reduce total cost of ownership for metal systems (powder handling, monitoring, and QA) and around secure digital spares workflows where defense and rail users are shifting from physical inventory toward on-demand production models.
Recent Industry Developments in United Kingdom 3D Printing Market
- July 2026: Rheinmetall UK formalized additive manufacturing as the baseline production method for air ducting components within the Challenger 3 Main Battle Tank programme. The move shifts AM from prototyping into serial, program-linked output and increases demand for qualified polymer processes, repeatable QA, and defense-grade documentation across the supply chain.
- November 2025: Renishaw and Materialise launched a next-generation Build Processor (NxG BP) to strengthen integration between Materialise Magics and Renishaw RenAM metal additive systems. Tighter software-to-machine workflow control supports higher utilization and more consistent builds for regulated applications, reinforcing the role of data preparation and parameter governance in production environments.
- December 2024: RYSE 3D reported a 58% increase in annual printer sales and received the King’s Award for Innovation. Stronger domestic performance for a UK-based polymer specialist points to broader SME uptake and supports expansion of local reseller, materials, and training ecosystems around desktop and professional platforms.
United Kingdom 3D Printing Market Report Scope and Research Methodology
Market Definition and Coverage
This market covers revenue generated in the United Kingdom from 3D printing systems, related materials, and supporting software and services that enable parts to be made layer by layer for industrial and professional use cases.
Scope exclusions: Purely hobbyist do it yourself kits, general CNC machining, and non additive prototyping tools are not counted in this market sizing.
Segments Covered in This Report
- By Printer Type
- Industrial
- Desktop/Professional
- By Material Type
- Metal
- Polymer
- Ceramic
- Composite/Other
- By Technology
- Powder Bed Fusion
- Material Extrusion (FDM / FFF)
- Vat Photopolymerisation
- Binder Jetting
- Directed Energy Deposition
- By Application
- Aerospace and Defence
- Automotive and Motorsport
- Healthcare and Medical Devices
- Construction and Architecture
- Consumer Products and Electronics
- Other Industrial Applications
- By Region
- England
- Scotland
- Wales
- Northern Ireland
Data Sources, Market Sizing, and Validation
Desk Research
Desk research starts by mapping how additive manufacturing demand shows up in the UK, and then we align it to measurable spend categories like equipment, materials, and service revenues. We referenced public sources such as the UK Office for National Statistics for manufacturing output context, HM Revenue and Customs trade statistics for relevant equipment and material flows, and the UK Intellectual Property Office for patent signals that indicate technology momentum.
To keep assumptions realistic, we also reviewed sources such as the British Standards Institution for applicable standards references, peer reviewed journals covering adoption trends and material usage, and association and cluster publications for sector level signals (for example, aerospace and medical device manufacturing communities). Company annual reports, investor presentations, and reputable press were used to cross check installed base statements, capacity additions, and pricing narratives, supported by a paid subscription that helps with company financials and patent screening. These desk sources are not exhaustive, and many other public references were reviewed for data collection, validation, and clarification.
Primary Interviews and Surveys
Primary work focused on interviews and short surveys with UK based stakeholders across printer distribution, service bureaus, material supply, and end user procurement teams. We tested adoption pace by technology, typical price bands, utilization patterns, and how orders shift across England, Scotland, Wales, and Northern Ireland, and then used those inputs to tighten the model assumptions that desk research could not fully confirm.
Distribution of primary research fieldwork respondents
| Company type | Respondent position |
|---|---|
| Top tier: 33% | CXOs: 12% |
| Mid tier: 51% | Functional/Unit leaders: 35% |
| Smaller Players: 16% | Managers: 53% |
Market-Sizing & Forecasting
The sizing model is built using top-down and bottom-up logic, so the total is first reconstructed from a UK demand pool and then checked against supplier and channel signals before finalizing. On the top-down side, we link manufacturing activity and adoption indicators to spend by component type, which is then distributed across major use environments.
Key inputs that were tracked include printer shipment and replacement cycles by class, average selling prices by technology family, materials consumption per active machine, service bureau utilization rates, and the share of production versus prototyping use cases that impacts recurring material demand. Where a bottom-up view was needed, we used selective roll ups from sampled supplier revenues, distributor channel checks, and observed ASP times volume ranges to confirm that the top-down totals stay plausible. When a data gap appears for a niche technology or material, the estimate is backfilled using comparable penetration rates and then pressure tested through expert feedback.
For forecasting, scenario analysis is used and the scenarios are anchored to a small set of variables that are easy to observe over time, such as industrial capex conditions, regulated medical device activity, and aerospace and automotive program cycles. The final forecast path is adjusted only after assumptions on pricing progression and utilization are revalidated with interview feedback.
Data Validation & Update Cycle
Validation is done by triangulating totals across multiple lenses, such as component shares, technology mix, and implied materials intensity per installed base. Outliers are flagged when year over year growth, prices, or utilization shifts are not consistent with interview feedback or with independent signals like trade flows and manufacturing output trends.
Before sign off, the model goes through a step by step analyst review so calculation logic, unit conversions, and currency timing are consistent across years. Reports are refreshed annually, and if a material event occurs (for example, a major policy change, a supply disruption, or a sharp shift in capex), the key assumptions are rechecked and the numbers are updated. Right before delivery, we run a final refresh pass so the client receives the latest available view.
Mordor Intelligence's United Kingdom 3d Printing Market Size Measured Against Other Published Estimates
Published numbers for the UK 3D printing market can look far apart because each publisher chooses its own scope, base year, and what gets counted as revenue. Differences also show up when one model leans more on aggressive price and penetration curves, or when currency timing and inflation handling are not explained clearly.
Some estimates fold in a wider set of digital manufacturing revenues or apply very fast growth rates over a short window. In Mordor Intelligence, the UK market is counted as 3D printing hardware, materials, software, and services tied directly to additive manufacturing activity, and adjacent manufacturing tools that do not rely on layer by layer production are kept out.
Benchmark comparison
| Source | Market Size | Gaps in Research Methodology |
|---|---|---|
| Mordor Intelligence | USD 1.14 B (2026) | |
| Industry Publisher A | USD 0.94 B (2024) | Uses a different base year and framing that can undercount near term UK spend if newer industrial installations and post-2024 price moves are not fully reflected, and the component split assumptions are not transparently tied back to utilization or materials intensity. |
| Global Publisher B | USD 1.55 B (2023) | Starts from an earlier base year and applies a higher growth profile into 2030, which can inflate the current size if faster penetration and ASP expansion are assumed without enough checks against UK manufacturing output and technology mix by end use. |
The table shows that the spread is mostly explained by what is included, which year is treated as the starting point, and how fast adoption and pricing are assumed to move. By tying the total back to observable UK demand signals and then cross checking with supplier and channel feedback, our estimate stays traceable to clear variables and can be repeated with the same steps in future updates.
Key Questions Answered in the Report
How big is the United Kingdom 3D printing market in 2026?
The market stands at USD 1.14 billion in 2026 and is on track for a 13.22% CAGR to 2031.
Which segment grows fastest through 2031?
Healthcare and medical devices expand at a 15.05% CAGR, outpacing all other application areas.
What printer category leads spending today?
Industrial systems hold 72.05% share, reflecting strong aerospace and automotive demand.
Which material type is gaining momentum beyond metals?
Ceramic feedstocks post a 14.56% CAGR due to uptake in dental, electronics, and high-temperature components.
Why is Northern Ireland significant for future growth?
Targeted incentives and aerospace cluster investment lift Northern Ireland’s CAGR to 14.72%, the highest across UK regions.