
Market Overview
| Study Period | 2021 - 2031 |
|---|---|
| Forecast Data Period | 2026 - 2031 |
| Base Year Market Size (2025) | 6.91 gigawatt |
| Market Volume (2026) | 7.61 gigawatt |
| Market Volume (2031) | 12.29 gigawatt |
| Growth Rate (2026 - 2031) | 10.06 % |
| Market Concentration | Medium |
Major Players *Disclaimer: Major Players sorted in no particular order Image © Mordor Intelligence. Reuse requires attribution under CC BY 4.0. | |
United Arab Emirates Solar Energy Market Analysis by Mordor Intelligence
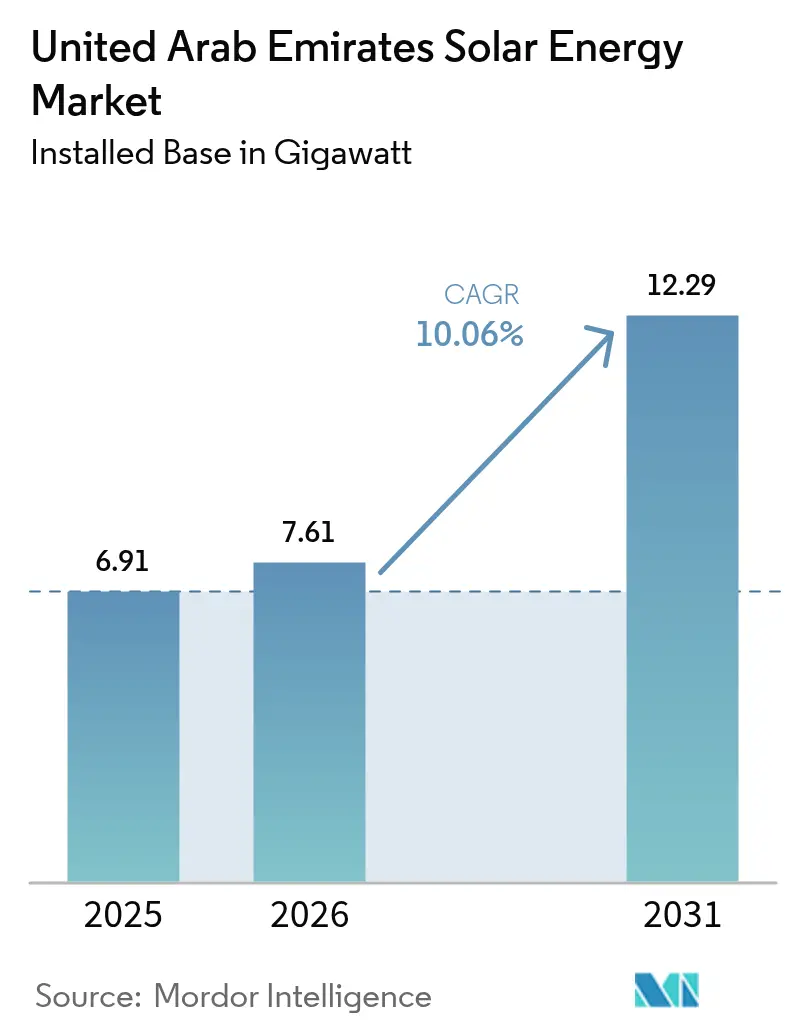
United Arab Emirates Solar Energy Market size in 2026 is estimated at 7.61 gigawatt, growing from 2025 value of 6.91 gigawatt with 2031 projections showing 12.29 gigawatt, growing at 10.06% CAGR over 2026-2031.
The expansion is anchored in enforceable federal decarbonization law, ultra-competitive IWPP procurement that locks in record-low tariffs, and a parallel strategy to secure renewable electricity for large-scale green hydrogen exports. Additional lift comes from falling module and battery prices, routine deployment of bifacial and TOPCon technologies, and a supportive banking ecosystem that extends long-tenor ESG-linked loans to developers and corporate offtakers. At the same time, grid reinforcement projects, water-use restrictions that disadvantage CSP, and land-lease competition with real-estate megaprojects temper the growth slope but do not alter the upward trajectory. Competitive dynamics feature Chinese equipment suppliers delivering cost leadership, state-backed Emirati utilities steering site allocation and offtake, and European developers bidding aggressively for IWPP concessions, all of which stimulate steady capacity additions and catalyze downstream service opportunities across construction, O&M, and storage integration.
Key Report Takeaways
- By technology, Solar Photovoltaic commanded 88.12% of the UAE solar energy market share in 2025 and is forecast to grow at a 10.33% CAGR to 2031.
- By grid type, on-grid systems held 99.06% of 2025 capacity, while the off-grid segment is projected to expand at an 18.02% CAGR through 2031.
- By end user, utility-scale plants represented 74.62% of installed capacity in 2025, whereas residential installations are anticipated to record a 15.05% CAGR to 2031.
- Abu Dhabi accounted for more than 60.25% of installed capacity in 2025 and is targeting over 7.65 GW by 2031, making it the largest contributor within the UAE solar energy market.
Note: Market size and forecast figures in this report are generated using Mordor Intelligence’s proprietary estimation framework, updated with the latest available data and insights as of 2026.
United Arab Emirates Solar Energy Market Trends and Insights
Drivers Impact Analysis*
| Driver | (~) % Impact on CAGR Forecast | Geographic Relevance | Impact Timeline |
|---|---|---|---|
| Government net-zero mandates and feed-in tariffs | +2.1% | National, early gains in Abu Dhabi and Dubai | Medium term (2-4 years) |
| Utility-scale park tendering under IWPP model | +2.5% | Abu Dhabi (EWEC), Dubai (DEWA) | Short term (≤ 2 years) |
| Declining module and storage costs | +1.8% | Global, direct impact on UAE procurement | Short term (≤ 2 years) |
| Hybrid solar-hydrogen pilots | +1.2% | Abu Dhabi industrial zones, Dubai Maritime City | Long term (≥ 4 years) |
| Mandatory green-building codes | +0.9% | Dubai, Abu Dhabi, Sharjah | Medium term (2-4 years) |
| Corporate PPAs backed by ESG-linked loans | +0.7% | National, concentrated in Dubai and Abu Dhabi free zones | Medium term (2-4 years) |
| Source: Mordor Intelligence | |||
Government Net-Zero Mandates and Feed-In Tariff Structures Accelerate Procurement
Federal Decree-Law No. 11/2024, effective May 2025, converts voluntary climate pledges into binding obligations through a national carbon registry and verified MRV protocols, obliging heavy industry to procure renewable electricity or buy offsets. DEWA’s Phase 6 tender in the Mohammed bin Rashid Al Maktoum Solar Park achieved a record tariff of USD 1.6215 cents per kilowatt-hour in 2024, removing the cost rationale for gas baseload expansion. Updated NDC targets commit to a 47% emissions cut by 2035 and 19.8 GW of renewables by 2030, pushing utilities and corporates toward solar PPAs. The D33 Industry Friendly Power Policy lets factories size rooftop systems up to full connected load, streams compensation at 10.5 fils per kilowatt-hour, and shortens payback periods to under four years.[1]Dubai Electricity & Water Authority, “DEWA Official Documents,” dewa.gov.ae These converging policies lower investment risk, pace procurement schedules, and embed solar into corporate decarbonization roadmaps.
Utility-Scale Park Tendering Under IWPP Model Drives Gigawatt Deployments
EWEC's pipeline of three 1.5 GW projects, Al Zarraf, Al Khazna, and Al Ajban, under the IWPP structure, allocates minority equity to winning consortia while Abu Dhabi retains majority ownership, de-risking financing and pushing bids below 2 cents per kilowatt-hour. EWEC plans 1.4 GW of solar additions per year between 2027 and 2037, enabling renewables to supply more than half of Abu Dhabi's electricity demand. Dubai mirrors this scale through a 1.8 GW sixth phase at its flagship park that will serve 540,000 homes and displace 2.36 million t of CO₂ annually. The size and cadence of these tenders standardize EPC processes, yet expose the pipeline to potential land-handover or grid-interconnection delays that can ripple through capacity forecasts.
Declining Module and Storage Costs Compress Tariff Floors
Global utility-scale PV LCOE fell 12% year-on-year in 2023 as Chinese factories oversupplied modules, while battery storage costs dropped 89% between 2010 and 2023.[2]International Renewable Energy Agency, “Renewable Power Generation Costs 2023,” irena.org Masdar’s USD 6 billion plan, unveiled in January 2025, couples 5 GW of PV with more than 19 GWh of batteries to deliver 1 GW of firm capacity for evening peaks. EWEC is adding 400 MW of one-hour storage by 2026, improving frequency regulation and voltage support. Accelerating cost deflation signals that by 2027, solar plus four-hour storage could clear below 3 cents per kilowatt-hour, eclipsing the short-run marginal cost of gas peakers and reshaping dispatch stacks.
Hybrid Solar-Hydrogen Pilots Position the UAE as a Green Fuel Exporter
DEWA’s pilot electrolyzer has produced 90 t of hydrogen since 2021, validating coupling intermittently powered electrolysis with the grid. Masdar linked a 1 GW solar project to Emirates Steel Arkan in 2024 to decarbonize steelmaking. A TotalEnergies–Masdar partnership aims to supply sustainable aviation fuel to Dubai International Airport, signaling downstream demand for green molecules. National strategy targets 1 million t of hydrogen by 2030, implying 10 GW of extra PV demand that is largely export-oriented. Execution hinges on electrolyzer imports, offtake contracts, and port infrastructure, but underpins a durable call on solar build-out.
Restraints Impact Analysis*
| Restraint | (~) % Impact on CAGR Forecast | Geographic Relevance | Impact Timeline |
|---|---|---|---|
| Grid-integration bottlenecks in desert load centers | -1.3% | Remote sites in Abu Dhabi, transmission corridors | Short term (≤ 2 years) |
| Land-lease competition with real-estate projects | -0.8% | Coastal Abu Dhabi and Dubai | Medium term (2-4 years) |
| Competition from ultra-low-cost Gulf wind | -0.6% | Saudi Arabia, Oman exports, domestic wind sites | Medium term (2-4 years) |
| Water-use restrictions for CSP cooling | -0.4% | Abu Dhabi CSP sites | Long term (≥ 4 years) |
| Source: Mordor Intelligence | |||
Grid-Integration Bottlenecks in Desert Load Centers Constrain Dispatch
Utility-scale parks in remote desert areas outpace transmission build-out, leading to midday curtailment that erodes revenue. TRANSCO upgrades run through 2027 and will add high-voltage lines and STATCOMs to stabilize voltage swings. EWEC’s 400 MW battery program, due in 2026, tackles intra-day imbalances, but evening peak coverage still primarily relies on gas turbines.[3]Aletihad Newspaper, “EWEC Secures Four New Sites for Renewable Energy,” en.aletihad.ae Lack of a wholesale market prevents time-of-use price signals that could incentivize flexible demand. Off-grid microgrids at industrial sites offer a workaround and illustrate why the off-grid segment is projected to log an 18.8% CAGR, but their absolute contribution remains modest.
Land-Lease Competition with Real-Estate Megaprojects Escalates in Coastal Zones
Four new EWEC sites totaling 75 km² were approved in December 2024 after lengthy negotiations with tourism, transport, and defense agencies, underscoring competing land priorities. Dubai concentrates projects in the Seih Al Dahal desert reserve because coastal land commands real-estate premiums. Environmental impact assessments add months to schedules near protected habitats. Floating PV is viewed as an option, yet no commercial-scale project has been sanctioned domestically, despite Masdar signing a 5 GW floating PV MOU in Egypt in 2024.
*Our forecasts treat driver/restraint impacts as directional, not additive. The impact forecasts reflect baseline growth, mix effects, and variable interactions.
Segment Analysis
By Technology: PV Extends Dominance While CSP Stalls on Water Limits
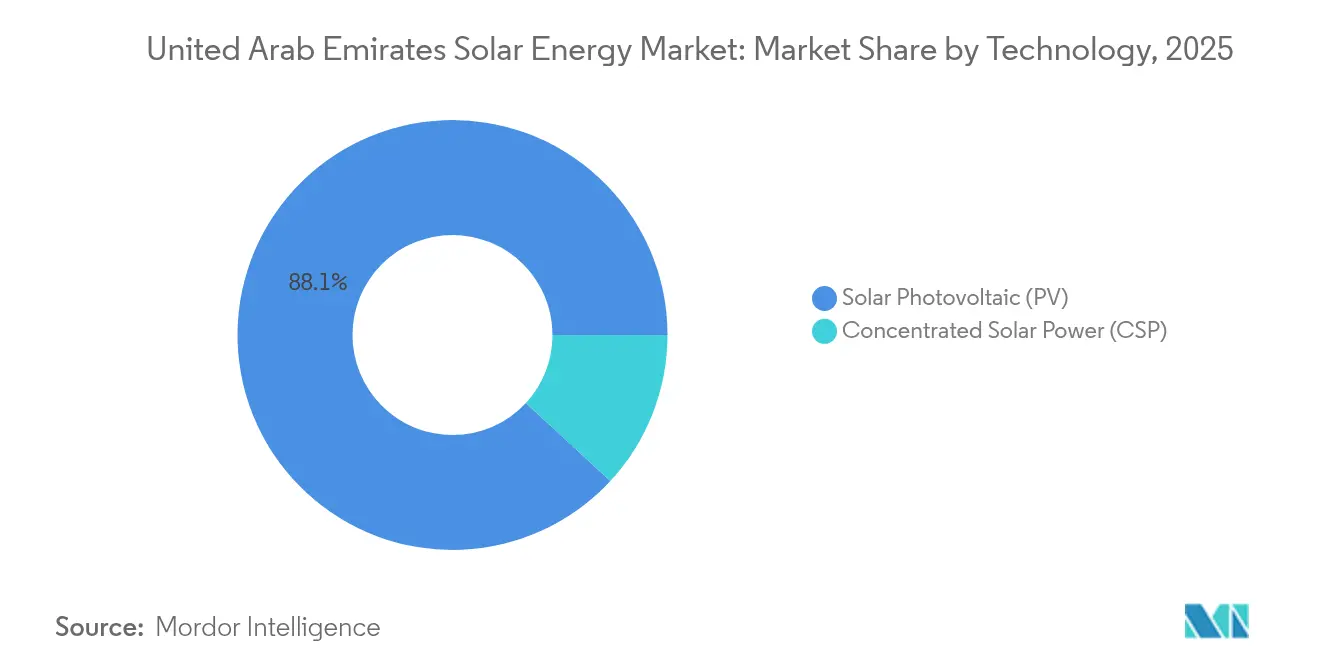
Solar Photovoltaic held 88.12% of installed capacity in 2025 and is forecast at a 10.33% CAGR to 2031 as bifacial panels become standard in IWPP tenders, lifting energy yield by up to 20% compared with monofacial modules. The UAE solar energy market size for PV is projected to cross 10.8 GW by 2031, reinforcing its primacy in meeting federal clean-energy quotas. Al Dhafra’s 2 GW plant validated bifacial deployment with a performance ratio above 85%, encouraging TOPCon uptake that trims system LCOE through higher efficiency. The UAE solar energy market benefits from GSO IEC 61215 standards that reduce failure rates amid extreme heat and humidity. Concentrated Solar Power remains below 11.88% of capacity because cooling water is scarce and the capital cost is high. Noor Energy 1 proves CSP can deliver post-sunset energy via 15-hour molten salt storage, yet no new CSP tenders emerged after 2024, signaling investor preference for PV plus batteries.
CSP’s longer construction cycle and higher leverage ratios complicate financing in a tariff environment where PV bids keep falling. Water-use restrictions tighten further under national conservation policies and push developers toward dry cooling, which erodes thermal efficiency. Storage cost compression strengthens the economic case for PV hybrids, crowding CSP out of future procurement schedules and consolidating the UAE solar energy market around crystalline silicon technologies.


By Grid Type: Off-Grid Solutions Scale From a Small Base as Transmission Lags
On-grid systems captured 99.06% of capacity in 2025, reflecting comprehensive transmission coverage in urban corridors. The UAE solar energy market size for on-grid assets is set to exceed 12.15 GW by 2031, anchored by IWPP megaprojects that feed directly into TRANSCO and DEWA networks. Off-grid microgrids, however, are rising at an 18.02% CAGR, driven by industrial sites, island communities, and defense outposts that face long grid-connection queues. ADNOC Distribution’s service-station program shows diesel displacement economics, with Dubai stations generating 6,300 MWh and cutting 2,900 t of CO₂ by end-2024.
Ignite Energy Access chose Abu Dhabi for its global headquarters in March 2025, signaling policy support for exporting off-grid solutions to Africa and South Asia. Domestic growth remains niche because grid tariffs are low and access is widespread. Nonetheless, microgrids provide a hedge against curtailment risk and reduce diesel burn where connection costs are prohibitive, enriching the value proposition within the broader UAE solar energy market.
By End User: Utility-Scale Keeps Lead While Residential and C&I Accelerate
Utility-scale plants made up 74.62% of 2025 capacity underpinned by 2 GW-class IWPPs. The UAE solar energy market share for utility-scale is forecast to stay above 70% through 2031, despite faster percentage growth in rooftops, thanks to the sheer size of new Abu Dhabi and Dubai parks. Residential adoption is set to expand at a 15.05% CAGR, lifted by Shams Dubai's net-metering that waives 10% of connection fees and offers zero-interest financing. Growth, however, is confined to villa owners because strata rules prevent apartment residents from tapping shared roofs.
Commercial and industrial rooftops receive a strong tailwind from the D33 policy, which slashes connection charges by 25% and allows export at 10.5 fils per kilowatt-hour. TotalEnergies delivered a 7 MWp array for DHL that generates 10 GWh yearly and pays back in under four years. CleanMax's HSBC-backed program shows that bankers see low default risk in C&I PPAs, unlocking non-recourse structures that accelerate roll-outs. Rooftop load factors, shading, and structural limitations remain physical constraints, yet C&I demand is now a defined, bankable segment within the UAE solar energy market.

Geography Analysis
Abu Dhabi led installed capacity in 2025 on the back of EWEC's 2 GW Al Dhafra plant and three 1.5 GW projects in the pipeline. The emirate targets cumulative solar above 7.65 GW by 2031 and complements this build-out with 400 MW of battery storage to smooth intermittency. EWEC's IWPP formula draws consortia that pair state-backed capital with foreign technology, keeping tariffs below 1.7 cents per kilowatt-hour and reinforcing Abu Dhabi's cost leadership within the UAE solar energy market. Masdar's USD 6 billion hybrid program, announced in 2025, underscores the emirate's role as a hub for dispatchable renewable power and frames its plan to serve 700,000 homes with round-the-clock clean electricity.
Dubai follows with the Mohammed bin Rashid Al Maktoum Solar Park that is targeting 5.25 GW by 2031, including a 1.8 GW sixth phase scheduled for completion in 2027. Shams Dubai net-metering registered 200 MW of rooftop systems by end-2023, and the D33 policy makes C&I solar cost-competitive for manufacturers and data centers. Dubai Airports' 39 MW rooftop project demonstrates C&I scale and will meet 6.5% of the main airport's demand while offsetting 23,000 t of CO₂ annually.
Sharjah and the Northern Emirates contribute smaller volumes but showcase diversification. Emerge delivered the 60 MW Sajaa plant in Sharjah, the first utility-scale solar asset in that emirate. Distributed generation for government buildings and SMEs is expanding, yet fragmented permitting slows rooftop deployment compared with Abu Dhabi and Dubai. Federal decarbonization mandates are expected to harmonize rules, which should lift the Northern Emirates' participation in the UAE solar energy market over the forecast period.
Regulatory Landscape
The UAE solar market operates under a dual framework that pairs federal climate and compliance requirements with emirate-level utility regulations and permitting. Federal Decree-Law No. 11/2024 on the Reduction of Climate Change Effects, effective 30 May 2025, formalizes climate governance through a national carbon registry and MRV requirements, with compliance obligations applying across public and private entities by 30 May 2026. This structure reinforces corporate demand for renewable electricity procurement and documented emissions reductions.
On the technical side, distributed and utility solar projects must meet mandatory equipment and safety requirements aligned with IEC standards (including IEC 61215 and IEC 61730), while local utilities apply their own interconnection and approval processes. In Dubai, DEWA administers Shams Dubai through detailed technical standards and an equipment eligibility regime that typically relies on third-party testing from ILAC-accredited laboratories under ISO/IEC 17025, creating a clear but documentation-heavy pathway for compliant rooftop PV deployment.
Competitive Landscape
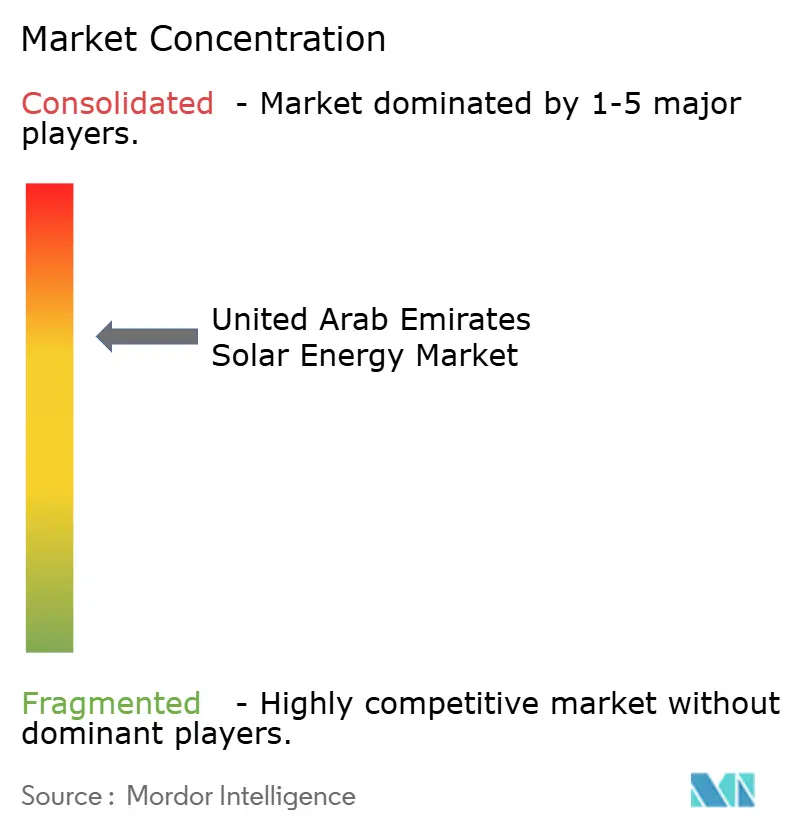
The UAE solar energy market is moderately concentrated. State-linked entities, Masdar, DEWA, TAQA, and EWEC, retain control over site allocation, grid access, and offtake contracts, ensuring orderly build-out and tariff discipline. Chinese manufacturers JinkoSolar, Canadian Solar, LONGi, and Trina Solar secure large module orders through cost leadership, especially in bifacial and TOPCon categories. European developers such as EDF Renewables, Engie, and TotalEnergies partner with regional players like ACWA Power to compete for IWPP stakes, focusing on debt structuring and EPC efficiency to edge bids below competing consortia.
Masdar’s corporate restructuring in 2022 pooled assets from Mubadala, TAQA, and ADNOC, creating a vertically integrated renewable champion with a 100 GW 2030 target and a parallel plan for 1 million t of hydrogen output.[5]Utilities Middle East, “Solar Titans: The Companies Powering a Renewable Future,” utilities-me.com Inverter suppliers Huawei Digital Power and Sungrow differentiate through higher conversion efficiency and integrated storage controls, with Sungrow showcasing its 98.8%-efficient SG150CX at WFES 2025. Independent power producers such as CleanMax, Enerwhere, and Yellow Door Energy carve out the rooftop PPA space, bundling O&M and financing to serve corporates that prefer off-balance-sheet solutions.
White-space opportunities include floating PV, agrivoltaics, and captive solar for industrial clusters in free zones, none of which have reached commercial scale domestically. Developers explore these niches at trade shows like Intersolar Middle East but await favorable land or water regulations to unlock bankable pilots.
United Arab Emirates Solar Energy Industry Leaders
Masdar (Abu Dhabi Future Energy Company)
Sunergy Solar
MAYSUN SOLAR FZCO
ACWA Power
CleanMax Mena FZCO
- *Disclaimer: Major Players sorted in no particular order

Market Opportunities and Future Outlook
Large-scale solar-plus-storage is shifting from pilot-scale integration to a more defined procurement and bankability pathway, which creates room for BESS supply, integration engineering, and long-tenor financing structures. A near-term proof point is Masdar reaching financial close in July 2026 on a USD 6.1 billion round-the-clock project combining 5.2 GW of solar PV with 19 GWh of battery storage in Abu Dhabi, alongside major system supply awards for storage equipment. This broadens the addressable market beyond daytime PV generation into firm capacity and grid services.
Utility procurement volumes also support near-term demand across EPC, O&M, module and inverter supply, and grid-connection works as Dubai and Abu Dhabi expand their tender pipelines. DEWA issued an RFP in November 2025 for the 7th phase of the Mohammed bin Rashid Al Maktoum Solar Park, covering 2,000 MW PV plus 1,400 MW of battery storage, which indicates ongoing scaling of hybrid configurations. At the same time, emirate-level rooftop programs and corporate PPAs support a parallel opportunity set in C&I solar, energy management, and compliance-grade reporting aligned with the federal MRV framework.
Recent Industry Developments
- July 2026: Masdar reached financial close on a USD 6.1 billion round-the-clock clean energy project in Abu Dhabi combining 5.2 GW of solar PV with 19 GWh of battery storage. The financing structure, backed by a large bank group, further institutionalizes solar-plus-storage as a mainstream utility-scale product in the UAE and strengthens the pipeline for high-volume equipment and integration contracts.
- November 2025: Dubai Electricity and Water Authority (DEWA) issued the request for proposal for the 7th phase of the Mohammed bin Rashid Al Maktoum Solar Park, tendering 2,000 MW of solar PV alongside 1,400 MW of battery energy storage. This procurement indicates that hybrid PV-plus-storage configurations are becoming standard in Dubai tenders, widening opportunities for storage developers, integrators, and inverter-control platforms.
- December 2024: Emirates Water and Electricity Company (EWEC) obtained approval for four new solar sites totaling about 75 km2 to host up to 4.5 GW of additional capacity by 2030. Securing land at this scale reduces a key development bottleneck in Abu Dhabi and supports a steadier cadence of IWPP project awards, grid-connection work, and long-term O&M demand.


Research Methodology Framework and Report Scope
Market Definition and Coverage
For this study, the UAE solar energy market is defined as the operational and planned solar power capacity added and available in the country, expressed in installed capacity terms. It reflects solar PV and CSP projects connected to the grid and, where applicable, smaller off-grid installations.
Scope exclusions: We exclude unrelated renewable sources, pure component trading not tied to UAE installations, and downstream retail electricity billing value beyond what is supported by capacity additions.
Segmentation Overview
- By Technology
- Solar Photovoltaic (PV)
- Concentrated Solar Power (CSP)
- By Grid Type
- On-Grid
- Off-Grid
- By End-User
- Utility-Scale
- Commercial and Industrial (C&I)
- Residential
- By Component (Qualitative Analysis)
- Solar Modules/Panels
- Inverters (String, Central, Micro)
- Mounting and Tracking Systems
- Balance-of-System and Electricals
- Energy Storage and Hybrid Integration
Data Sources, Market Sizing, and Validation
Desk Research
Desk work starts with mapping the UAE solar project pipeline and operating base, then aligning it with public power sector reporting. We lean on public sources such as IRENA renewables statistics, IEA solar and electricity data series, and UAE government energy strategy releases, followed by regulator and utility disclosures where commissioning dates are clarified.
To keep assumptions realistic, we also review sources such as UN Comtrade trade flows for solar-related equipment signals, peer reviewed papers on UAE solar resource and performance, and press releases tied to tender awards and COD updates. Company filings, investor presentations, and reputable business press help us cross-check ownership structures and timing. Select paid database subscriptions are used for company financials and intelligence, patent lookups, and shipment-level trade checks where the public trail is thin. These examples are illustrative, and many other public sources were also referenced for data collection, validation, and clarification.
Primary Interviews and Surveys
Primary discussions are run with developers, EPC and O&M participants, equipment distributors, large electricity offtakers, and sector advisors to confirm what is actually being built in the UAE and what is being delayed. Inputs from stakeholders across the UAE help us pressure-test desk assumptions on commissioning slippage, realized capacity additions, and the split between utility-scale projects and rooftop activity before finalizing the model.
Distribution of primary research fieldwork respondents
| Company type | Respondent position |
|---|---|
| Top tier: 32% | CXOs: 14% |
| Mid tier: 52% | Functional/Unit leaders: 35% |
| Smaller Players: 16% | Managers: 51% |
Market-Sizing & Forecasting
The market is first reconstructed using a top-down and bottom-up blend, where national capacity targets, utility planning statements, and project tender awards are translated into annual installed GW additions. After that, totals are checked using selective bottom-up approximations, such as summing a tracked set of large UAE projects, then sampling typical project sizes and timing patterns for smaller C&I and residential systems.
Key inputs include annual commissioned capacity (GW), announced and awarded pipeline capacity, grid connection timelines, the expected PV versus CSP mix, and tender tariff levels that influence build-out pace. We also watch indicators like module import trends and public updates on solar park phases, because these tend to signal when procurement and construction are moving. For forecasting, scenario analysis is used to reflect optimistic and conservative commissioning cases, and the final path is aligned to what experts consider most likely given permitting, financing, and grid readiness. Where a smaller segment cannot be fully enumerated, we apply penetration-style assumptions anchored to verified rooftop program rules and then validate the implied additions with interview feedback.
Data Validation & Update Cycle
Outputs are validated by comparing modeled annual additions with independent signals, such as project COD announcements, utility capacity statements, and renewable statistics releases. Any large variance triggers an internal review of drivers like timing shifts, double counting of phases, or mix changes, and then follow-up questions are sent to relevant interviewees.
Before sign-off, the dataset and calculations go through multi-step analyst checks, including unit consistency checks, year-on-year reasonability reviews, and cross-validation against adjacent power sector totals. The report is refreshed annually, and interim updates are made when material events occur, such as major tenders, commissioning delays, or policy changes. Right before delivery, a final pass is completed so clients receive the latest updated view available.
Mordor Intelligence's United Arab Emirates Solar Energy Market Sizing Compared With Other Published Estimates
Published market numbers for UAE solar often do not match because the unit of measurement is not always the same, and the definition of what is counted can shift. Some sources talk in installed capacity, others report project investment value, and a few blend generation output with spending, which makes quick comparisons tricky.
Tender award trackers, COD announcements, and utility capacity disclosures are the evidence checks that keep Mordor Intelligence's estimate tied to installed GW additions (PV and CSP, across grid types and end users), instead of mixing in capex, equipment revenues, or electricity value. Differences also come from whether forecasts assume faster commissioning, whether CSP is treated as fully comparable to PV in timing, and how currency timing is handled when an estimate is in USD rather than in GW.
Benchmark comparison
| Source | Market Size | Gaps in Research Methodology |
|---|---|---|
| Mordor Intelligence | USD 7.61 B (2026) | |
| Regional Consultancy A | USD 6.20 B (2024) | Reported as an investment-style USD value tied to projects and related activity, which can include EPC and storage scope, rather than installed capacity in GW. |
| Trade Journal B | USD 6.40 B (2024) | Definition is not tightly separated between capacity, generation, and broader market activity, so the number can blend multiple measures and may not be aligned to a single installed-capacity measure. |
The table shows that most of the spread is explained by measurement choice and scope boundaries, not by a simple arithmetic difference. By sticking to visible capacity signals and then cross-checking them against project timing and pipeline status, the sizing stays repeatable and easier to validate year over year.


Key Questions Answered in the Report
How large is the UAE solar energy market in 2026?
Installed capacity totals 7.61 GW in 2026 and is forecast to climb to 12.29 GW by 2031.
Which technology leads current installations?
Solar Photovoltaic accounts for 88.12% of capacity owing to bifacial and TOPCon efficiency gains.
What policy drives corporate procurement?
Federal Decree-Law No. 11/2024 mandates verified emissions cuts and pairs with DEWA net-metering and virtual wheeling to spur PPAs.
Where are the biggest new projects located?
Abu Dhabi hosts three 1.5 GW IWPPs and Dubai is adding 1.8 GW in Phase 6 of its flagship solar park.
How fast are off-grid systems expanding?
Off-grid microgrids are set to grow at an 18.02% CAGR through 2031, though from a small base focused on industrial and island sites.
Which companies dominate module supply?
JinkoSolar, Canadian Solar, LONGi, and Trina Solar lead shipments, benefiting from scale and cost leadership.
Page last updated on:


 Your data is secure and never sold or shared.


