
Market Overview
| Study Period | 2020 - 2031 |
|---|---|
| Forecast Data Period | 2026 - 2031 |
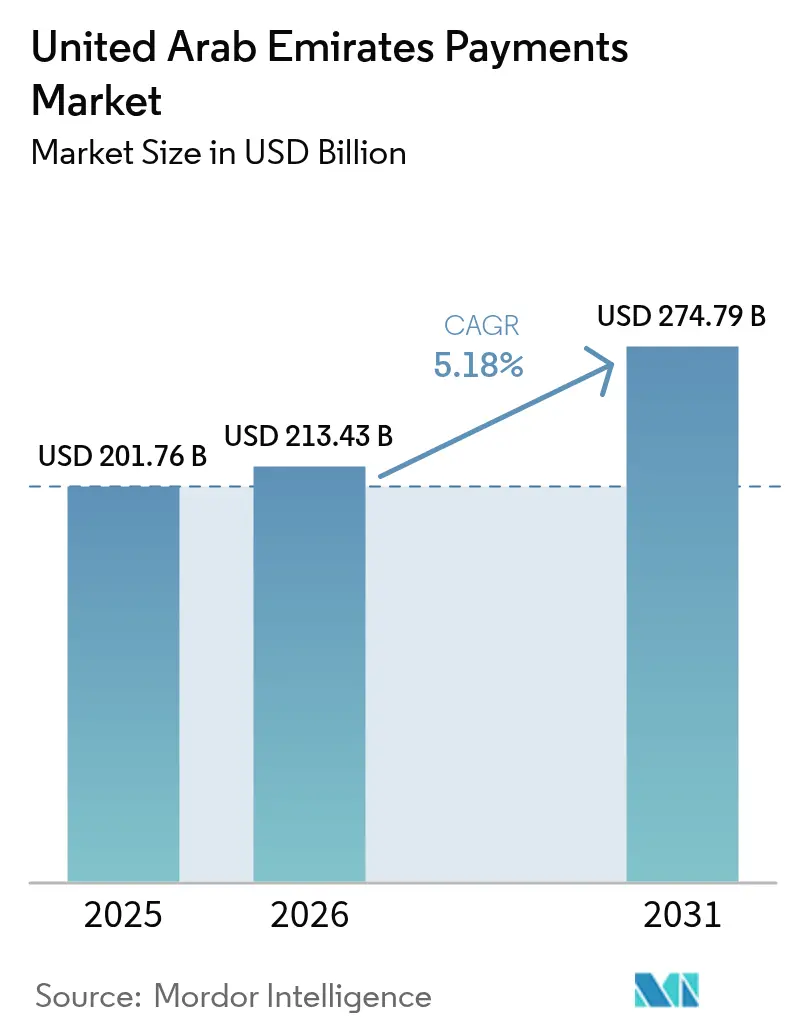
| Base Year Market Size (2025) | USD 201.76 Billion |
| Market Size (2026) | USD 213.43 Billion |
| Market Size (2031) | USD 274.79 Billion |
| Growth Rate (2026 - 2031) | 5.18 % |
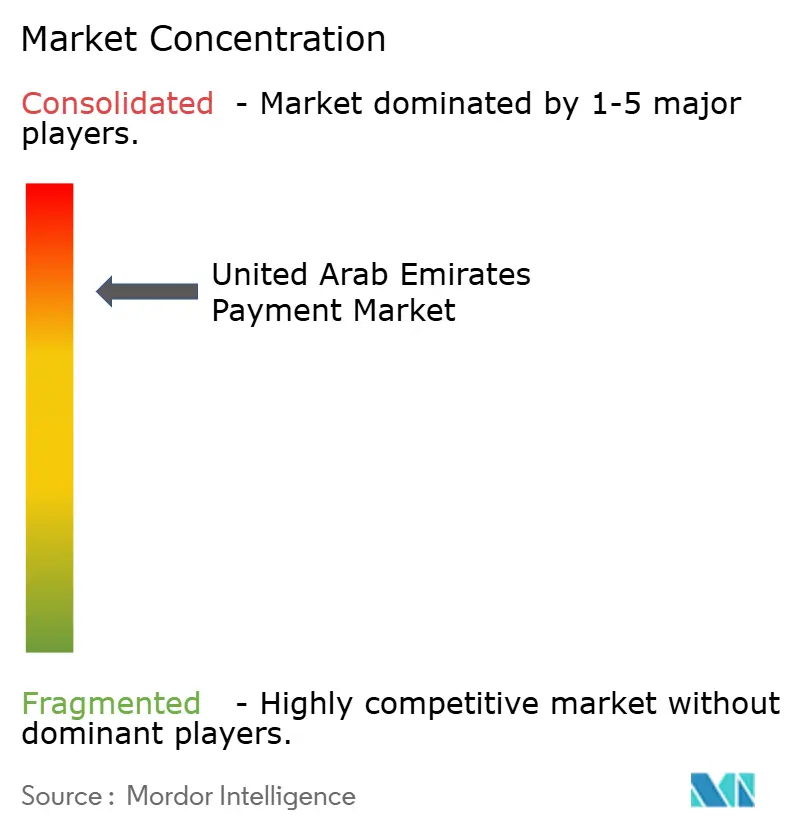
| Market Concentration | High |
Major Players *Disclaimer: Major Players sorted in no particular order Image © Mordor Intelligence. Reuse requires attribution under CC BY 4.0. | |
United Arab Emirates Payments Market Analysis by Mordor Intelligence
The United Arab Emirates payments market size was valued at USD 201.76 billion in 2025 and is estimated to grow from USD 213.43 billion in 2026 to reach USD 274.79 billion by 2031, at a CAGR of 5.18% during the forecast period (2026-2031). Rising migration from legacy card rails to sovereign infrastructure, accelerated issuance of Jaywan-branded cards, and early-stage Digital Dirham pilots are reshaping retail checkout, invoice settlement, and cross-border spending patterns. Near-ubiquitous contactless acceptance, real-time AANI transfers, and QR interoperability with India’s UPI are lowering friction for both tourists and residents, while stringent data-residency mandates are forcing cloud processors to deploy in-country nodes, lifting fixed costs yet improving sovereign control. Incumbent acquirers continue to dominate physical commerce, but global platforms licensed in 2025 are pressuring pricing in e-commerce, which remains the fastest-growing channel. Heightened cyber-fraud targeting hospitality point-of-sale environments is simultaneously driving tokenization and biometric rollouts, albeit compressing margins for smaller providers.
Key Report Takeaways
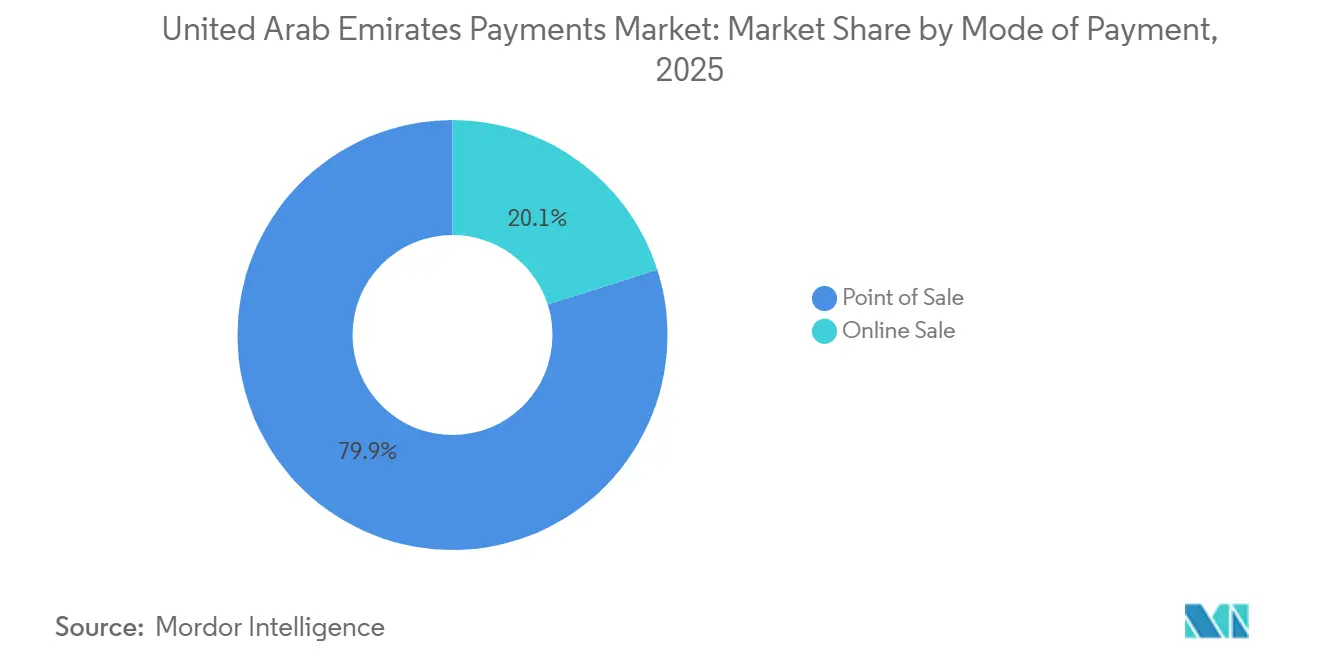
- By mode of payment, point-of-sale transactions held 79.92% of the United Arab Emirates payments market share in 2025, while online channels are projected to expand at a 6.37% CAGR through 2031.
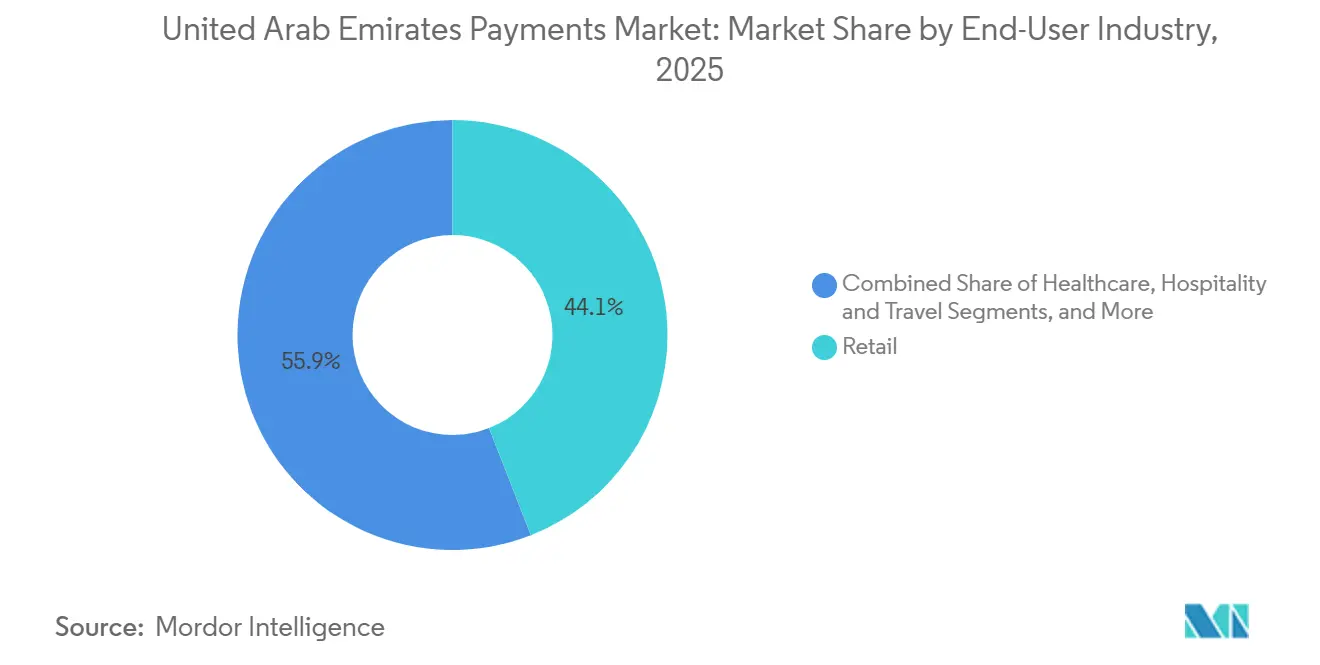
- By end-user industry, retail accounted for 44.06% share of the United Arab Emirates payments market size in 2025, whereas entertainment and digital content is poised to grow at a 5.89% CAGR through 2031.
Note: Market size and forecast figures in this report are generated using Mordor Intelligence’s proprietary estimation framework, updated with the latest available data and insights as of 2026.
Market Trends and Insights
Drivers Impact Analysis of United Arab Emirates Payments Market*
| Driver | (~) % Impact on CAGR Forecast | Geographic Relevance | Impact Timeline |
|---|---|---|---|
| Domestic Card-Scheme “Jaywan” Routing Keeps Interchange In-Country | +1.2% | National, early adoption in Dubai and Abu Dhabi | Medium term (2-4 years) |
| AANI Real-Time Rail Unlocks SME Instant Settlement and Bill-Pay | +1.0% | National, concentrated in Dubai, Abu Dhabi, Sharjah | Short term (≤ 2 years) |
| Tourist-Driven Cross-Border QR (UPI, RuPay) Traffic Surge | +0.9% | Dubai, Abu Dhabi, Sharjah (high tourist zones) | Short term (≤ 2 years) |
| CBDC “Digital Dirham” Lowers Cash-Handling Cost for Banks | +0.8% | National, pilot phase in Abu Dhabi and Dubai | Long term (≥ 4 years) |
| BNPL at POS Boosts High-Ticket Retail Conversion | +0.7% | Dubai, Abu Dhabi (premium retail corridors) | Medium term (2-4 years) |
| Open-Finance API Mandates Accelerate Fintech Product Launches | +0.6% | National, regulatory framework led by Central Bank | Medium term (2-4 years) |
| Source: Mordor Intelligence | |||
Domestic Card-Scheme “Jaywan” Routing Keeps Interchange In-Country
Jaywan, introduced in 2024, reroutes domestic card traffic away from global networks and retains interchange inside the banking system, trimming acquirer costs by roughly 30-40 basis points per swipe.[1] By mid-2025 the scheme enrolled 12 banks and 8 million cardholders, with acceptance at 95% of terminals nationwide. Merchants see lower merchant-discount rates on local volume, funding faster device upgrades and nudging cash-heavy segments toward digital receipts. Co-badging with Visa and Mastercard protects cross-border acceptance, ensuring travelers retain spend flexibility. Mandatory inclusion of Jaywan on all new cards by 2027 compresses migration timelines and accelerates terminal replacement cycles.[2]
AANI Real-Time Rail Unlocks SME Instant Settlement and Bill-Pay
Operational since 2024, AANI clears payments under 10 seconds and had 1.4 million users executing 500,000 transactions daily by December 2025. Liquidity caps at AED 100,000 (USD 27,200) limit systemic risk yet satisfy 90% of SME invoices. Dubai’s licensing portal now embeds AANI, meaning entrepreneurs receive trade licenses within minutes after fee payment.[3] Large utilities such as DEWA collect bills in real time, cutting reconciliation cycles and surfacing dynamic-pricing alerts to consumers. Fintechs access open APIs, embedding instant pay-by-link features into accounting software; Mashreqbank’s NEOPAY processed 320,000 such checkouts in its first three months.
Tourist-driven cross-border QR payments capture visitor spend
Network International enabled UPI QR codes at 150,000 merchants by December 2025, capturing spend from 3.5 million Indian tourists. Shoppers bypass currency-conversion fees, lifting purchase frequency 18% at Dubai Mall and Yas Island.[4] Settlement clears in dirhams via pre-funded pools, delivering funds within 24 hours. Emirates NBD replicated the model for UnionPay QR to serve 1.2 million Chinese visitors. Bilateral QR pacts with Saudi Arabia, Egypt, and Pakistan under the Central Bank’s 2025 road map position the United Arab Emirates payment market as a regional hub.
Digital Dirham CBDC reduces cash-handling overheads
A wholesale Digital Dirham pilot launched in Q4 2025 reduced interbank settlement from hours to seconds while eliminating correspondent fees. First Abu Dhabi Bank posted 40% cost savings on cross-border trade-finance transactions settled on the ledger. A retail pilot scheduled for mid-2026 in Masdar City will test programmable wallets for transit and utilities. Automated escrow functions could streamline real-estate deals, while conditional tax-withholding features offer fiscal transparency. Banks expect 20-25% lower cash-handling overhead as adoption scales, freeing staff for advisory services.
Restraints Impact Analysis of United Arab Emirates Payments Market*
| Restraint | (~) % Impact on CAGR Forecast | Geographic Relevance | Impact Timeline |
|---|---|---|---|
| ATM-Level Cash Preference in Rural Northern Emirates Persists | -0.5% | Ajman, Umm Al Quwain, Ras Al Khaimah, Fujairah | Long term (≥ 4 years) |
| Cyber-Fraud Rings Targeting Hospitality POS Increase Acquirer Risk | -0.4% | Dubai, Abu Dhabi (hospitality corridors) | Short term (≤ 2 years) |
| High MDR for Foreign Cards Suppresses SME Acceptance Growth | -0.3% | National, acute in Sharjah and Northern Emirates | Medium term (2-4 years) |
| Data-Residency Rules Raise Cloud-Cost Base for PSPs | -0.3% | National, enforcement by ADGM and DIFC | Medium term (2-4 years) |
| Source: Mordor Intelligence | |||
ATM-Level Cash Preference in Rural Northern Emirates Persists
ATM withdrawals in Ajman, Umm Al Quwain, Ras Al Khaimah, and Fujairah remain 40-50% higher than Dubai averages, reflecting sparse terminal density and cultural leanings toward cash for purchases under AED 50 (USD 13.6). A 2024 survey showed 62% of merchants lacked card readers because monthly fees erode slim grocery and fuel margins. Patchy mobile coverage in mountainous zones hampers QR and NFC uptake. Although a 2025 subsidy program waives device fees for a year, consumer mistrust and limited digital awareness slow conversion. Cross-border remittance workers also reinforce cash ecosystems by favoring exchange houses over e-wallets.
Cyber-Fraud Rings Targeting Hospitality POS Increase Acquirer Risk
Card-skimming and malware incidents in hotel and restaurant terminals climbed 35% in 2025, exploiting high staff turnover and tourist card volumes. Chargebacks at Network International’s hospitality merchants rose 22%, prompting a rapid shift to point-to-point encryption and tokenization across 18,000 devices. PCI-DSS v4.0 demands annual penetration testing and multi-factor authentication, costs that smaller acquirers struggle to absorb. Real-time breach reporting, mandated by the Central Bank in June 2025, carries fines up to AED 1 million (USD 0.27 million) for non-compliance. The resulting compliance burden tightens margins even as biometric authentication improves traveler confidence.
*Our forecasts treat driver/restraint impacts as directional, not additive. The impact forecasts reflect baseline growth, mix effects, and variable interactions.
United Arab Emirates Payments Market Segment Analysis
By Mode of Payment:
Physical Rails Dominate, Yet Online Surges From a Smaller BasePoint-of-sale transactions controlled 79.92% of 2025 value in the United Arab Emirates payments market, supported by 92% NFC-enabled terminal coverage and contactless card penetration of 87%. The United Arab Emirates payments market size booked to online channels remains smaller but is expanding at a 6.37% CAGR on the back of wallet tokenization, one-click checkout, and AANI account-to-account links. Debit and credit cards still anchor in-store spend, yet buy-now-pay-later plans offered by Tabby and Tamara are diverting electronics and furniture receipts away from revolving credit, compressing interest revenue for issuers.[5]
Digital wallets held 12% of in-store value in 2025, a share expected to climb as Payit, eWallet, and super-apps embed loyalty points and utility bill-pay inside single screens. Online‐only penetration is deeper: roughly 35% of e-commerce orders now close with wallet credentials instead of manual card entry, trimming checkout abandonment rates. Cash-on-delivery has fallen to 18% of parcels, partly because couriers levy fees for cash handling and partly due to merchant discounts on prepaid orders. High-ticket web purchases such as automobiles and jewelry increasingly settle via AANI transfers that dodge credit-card limits and currency-conversion surcharges, signaling a gradual tilt toward direct account debits in the United Arab Emirates payments market.
By End-User Industry:
Retail Commands Volume, Entertainment AcceleratesRetail delivered 44.06% of 2025 transaction value, reflecting 70 shopping malls in Dubai and a tourist retail spend topping USD 30 billion in 2024. Nevertheless, the segment is maturing as shop floors already support near-universal contactless acceptance, pushing acquirers to differentiate on loyalty analytics and real-time fraud scoring. In contrast, entertainment and digital content is registering the fastest clip at a 5.89% CAGR, fueled by subscription streaming and in-game micro-transactions that leverage carrier billing to bypass app-store fees.
Healthcare payments are pivoting from cash counters to embedded insurance adjudication; telemedicine claims now reconcile in 48 hours after mandatory EHR integration. Government and utilities crossed the 98% digital-collection threshold in 2025, chiefly due to DEWA’s AANI integration, which cut reconciliation lags and eliminated AED 12 million in annual cash overhead. Hospitality and travel benefit from high tourist footfall but shoulder elevated chargeback and compliance costs, underscoring the need for biometric-first checkouts across the United Arab Emirates payments market.

Geography Analysis
Dubai and Abu Dhabi anchor investment and innovation, yet their regulatory hues diverge. Dubai’s DIFC sandbox licensed 15 new payment service providers in 2025, drawing Stripe, Checkout.com, and other API-first processors aiming to shave cross-border fees for e-commerce merchants. Tourist inflows amplify QR acceptance, with Network International activating UPI codes on 150,000 terminals, a maneuver that aligns the United Arab Emirates payments market with rupee-linked wallets. Abu Dhabi’s ADGM imposes tight data-residency rules, requiring in-country cloud nodes; the policy raises capex yet attracts corporates that value sovereign oversight.
Sharjah leverages municipal subsidies that waive device rental for micro-retailers but still grapples with high interchange on foreign cards, sustaining a price gap between domestic Jaywan volume and overseas tourist spend. Spillover from Dubai’s terminal network is visible, yet migrant workers in Sharjah tilt toward remittance-heavy cash ecosystems that slow wallet adoption. The Northern Emirates record ATM-to-digital ratios 50% above national averages, complicated by mountainous coverage gaps and legacy cash habits.
Financial-inclusion incentives launched in 2025 subsidize terminals and mandate zero monthly fees for micro-merchants, yet uptake is patchy outside urban cores. Consumer education campaigns now pair QR how-to videos with village-level merchant roadshows, a tactic intended to curb cash leakage and pull the Northern Emirates into the mainstream of the United Arab Emirates payments market.
Regulatory Landscape
The Central Bank of the UAE (CBUAE) regulates retail payment systems, payment service providers, card schemes, stored value facilities, and payment token services through its rulebook framework. A key step for crypto-adjacent payment activity is the CBUAE Payment Token Services Regulation, effective August 31, 2024. It defines regulated activities including issuance, conversion, and custody or transfer of payment tokens, and it sets licensing expectations for entities providing token-based payment services.
In 2025, Federal Decree-Law No. (6) of 2025 (effective September 16, 2025) broadened the statutory basis for CBUAE supervision of technology-enabled financial services, including new infrastructures that can be used in payments. Alongside this, the Telecommunications and Digital Government Regulatory Authority (TDRA) governs the Trust Services Framework under Federal Decree-Law No. (46) of 2021, with licensing compliance for Trust Service Providers tied to a December 31, 2025 deadline. This connects to e-signatures, seals, and digital identification used in onboarding and transaction authorization across the payments stack.
Value Chain Analysis
The UAE payments value chain begins with rule-setting and licensing by the CBUAE, followed by national infrastructure layers operated by Al Etihad Payments, including the AANI instant payments rail that connects banks and licensed PSPs. Issuers (banks and eligible fintech programs) provision accounts and cards, while domestic scheme routing (Jaywan) and international networks support authorization and settlement. On the acceptance side, acquirers and payment gateways onboard merchants across POS and online channels, linking terminals, QR acceptance, and checkout plugins to processing platforms. Large utilities and government entities also act as anchor billers, pulling instant payments into recurring collections.
Downstream, merchants, marketplaces, and free-zone ecosystems embed payments into commerce, logistics, and invoicing workflows, while PSPs add services such as tokenization, fraud tools, reconciliation, and reporting. The chain increasingly extends into embedded finance for SMEs, including invoice and supply-chain finance integrations, and into alternative rails such as regulated token-based payments. Core friction points remain compliance and operating costs, including data residency, security controls such as PCI-DSS v4.0, and incident reporting, alongside merchant economics in cash-heavy areas where device fees and MDR sensitivity slow acceptance expansion.
Competitive Landscape
The United Arab Emirates payments market remains moderately concentrated: Network International, First Abu Dhabi Bank, and Emirates NBD process roughly 55-60% of acquiring volume, yet that grip is easing as licensed newcomers nibble at e-commerce lanes. Network International banks on scale, rolling out tokenization, biometric authentication, and UPI QR codes across 150,000 points of sale. Emirates NBD mirrors the strategy with UnionPay QR for Chinese tourists. First Abu Dhabi Bank, meanwhile, uses Digital Dirham pilots to seed long-term wholesale relationships.
Stripe, Checkout.com, and PayPal have entered with transparent pricing and developer-friendly SDKs, quickly onboarding SMEs that previously balked at opaque acquirer tariffs. Regional specialists Telr and PayBy differentiate through vertical modules bundling inventory management, loyalty, and financing, easing adoption hurdles for hospitality and groceries. Buy-now-pay-later leaders Tabby and Tamara processed USD 7 billion in gross merchandise value by mid-2025, converting credit-averse millennials and widening installment footprints to fashion and travel.
Emerging contenders include embedded-finance orchestrators such as M2P Fintech, which powers payroll cards for migrant workers through NowMoney. Super-apps Careem Pay and Talabat Pay weave ride-hailing, food delivery, and bill-pay into one experience, tightening user stickiness. The Central Bank’s upcoming open-banking mandate, slated for 2027, will allow account-to-account initiation, spurring direct debit models that could erode interchange further.
United Arab Emirates Payments Industry Leaders
-
Network International Holdings plc
-
First Abu Dhabi Bank PJSC
-
Emirates NBD Bank PJSC
-
Mashreqbank PSC
-
Checkout FZ-LLC
- *Disclaimer: Major Players sorted in no particular order
United Arab Emirates Payments Market Companies Covered in this Report
- Network International Holdings plc
- First Abu Dhabi Bank PJSC
- Emirates NBD Bank PJSC
- Mashreqbank PSC (NEOPAY)
- Checkout FZ-LLC (Checkout.com)
- Telr Pte Ltd.
- PayBy Technology Projects LLC
- Amazon Payment Services Middle East FZ-LLC
- Infibeam Avenues Ltd - CCAvenue UAE
- ADCB Payments LLC
- Dubai Islamic Bank PJSC
- Tabby Electronic Payments LLC
- Tamara Electronic Payments LLC
- PayTabs Payment Solutions LLC
- NowMoney Ltd.
- Payit (First Abu Dhabi Bank)
- Etisalat by e& - eWallet
- Stripe Middle East FZ-LLC
- PayPal (PayPal MENA)
- Lyve Global Payments LLC
- M2P Fintech Pte Ltd.
Market Opportunities and Future Outlook
Instant account-to-account payments are creating whitespace for pay-by-link, bill pay, and B2B invoice settlement products built above AANI and bank APIs. Adoption signals have strengthened, with Al Etihad Payments reporting in April 2026 that AANI surpassed 12.5 million registered users and reached 774,000 merchants. This merchant density supports use cases beyond P2P, including in-store QR acceptance, real-time collections for SMEs, and instant disbursements from platforms. Providers that package reconciliation, ERP or accounting connectors, and risk controls around instant transfers can displace manual bank transfers and cash collection processes.
A second opportunity area sits at the intersection of enforcement-led compliance and regulated digital assets. CBUAE licensing under the Payment Token Services Regulation (effective August 31, 2024) and the expanded statutory perimeter introduced by Federal Decree-Law No. (6) of 2025 (effective September 16, 2025) are pushing token-based payment activity toward supervised rails and bank-grade controls. That shift creates room for processors and acquirers to offer compliant tokenization, stablecoin payment acceptance where permitted, and in-country hosting architectures aligned with UAE data and security expectations, particularly for hospitality, marketplaces, and cross-border commerce flows that face elevated fraud and chargeback exposure.
Recent Industry Developments in United Arab Emirates Payments Market
- June 2026: Network International launched Slice, an instant card-based, zero-cost instalment solution for UAE shoppers and businesses that works on existing POS terminals. The rollout extends acquiring platforms into instalments at checkout without requiring merchants to change hardware, strengthening competitive differentiation versus standalone BNPL offers.
- June 2026: Network International and American Express Middle East announced an expansion of American Express acceptance in the UAE, adding more than 85,000 new locations. Broader acceptance improves the addressable base for premium card spend, while acquirers gain volume upside tied to higher-value transactions and tourist-heavy merchant categories.
- January 2026: Network International became the first payments platform to enable stablecoin payments in the UAE through AE Coin in partnership with Al Maryah Community Bank (MBank). This introduced a regulated pathway for blockchain-based payment acceptance and settlement flows, widening options for digital commerce and supply-chain use cases alongside conventional card and account-to-account rails.
United Arab Emirates Payments Market Report Scope and Research Methodology
Market Definition and Coverage
This market covers the value of payment transactions executed in the United Arab Emirates across in-store and online channels, using instruments such as cards, digital wallets, and other payment methods. We treat the market as payment value processed for purchases across key end-use industries.
Scope exclusions: We exclude bank-to-bank wholesale settlement flows, non-payment financial services revenues, and cash-only transactions that do not touch a tracked payment rail.
Segments Covered in This Report
- By Mode of Payment
- Point-of-Sale (POS)
- Card Payments
- Debit Cards
- Credit Cards
- Bank Financing Prepaid Cards
- Digital Wallets (includes Mobile Wallet)
- Other Point of Sale
- Card Payments
- Online Sale
- Card Payments
- Debit Cards
- Credit Cards
- Bank Financing Prepaid Cards
- Digital Wallets
- Other Online Sales (includes Cash on Delivery, Bank Transfer, and Buy Now Pay Later)
- Card Payments
- Point-of-Sale (POS)
- By End-User Industry
- Retail
- Entertainment and Digital Content
- Healthcare
- Hospitality and Travel
- Government and Utilities
- Other End-User Industries
Data Sources, Market Sizing, and Validation
Desk Research
Desk research starts with building a clean fact base on payment infrastructure, usage signals, and regulatory direction in the UAE. We use public sources such as the Central Bank of the UAE releases, UAE government digital-economy and smart government updates, and official statistics that indicate consumer spend and sector activity.
To connect payments demand to the real economy, we also review sources such as the UAE Federal Competitiveness and Statistics Center, IMF and World Bank macro series, and travel indicators published by tourism bodies. This is complemented with company annual reports and investor presentations from banks, acquirers, and payment processors, plus credible press coverage on product launches and rule changes. Where needed, paid subscriptions are used for company financials, news and financial screening, patent databases, and shipment-level import or export checks that help validate terminals or card-related hardware flows. The sources listed here are illustrative, and many other public documents and datasets were also used to collect data, cross-check assumptions, and clarify gaps.
Primary Interviews and Surveys
Primary work focused on testing what the desk research cannot show clearly, especially the split between POS and online value, wallet versus card behavior, and merchant adoption patterns in sectors like retail, hospitality, and government payments. We spoke with payment ecosystem participants such as banks, acquirers, processors, fintech executives, large merchants, and operational leaders, and then we validated assumptions against the UAE market context.
Distribution of primary research fieldwork respondents
| Company type | Respondent position |
|---|---|
| Top tier: 29% | CXOs: 15% |
| Mid tier: 54% | Functional/Unit leaders: 30% |
| Smaller Players: 17% | Managers: 55% |
Market-Sizing & Forecasting
The sizing model is built using a top-down and bottom-up logic, where national spending capacity and digital payment adoption are first reconstructed, and then the totals are checked with selective roll-ups. For the top-down approach, we translate UAE-level consumption and sector activity into a payment value pool, and then apply channel and instrument splits using observed adoption signals.
Key inputs used in the model include card versus wallet penetration for POS and e-commerce, contactless usage trends, sector-level sales mix (such as retail and hospitality share), average ticket size and transaction frequency patterns, and policy or infrastructure events that change routing behavior. For example, shifts in real-time transfer rails, QR acceptance expansion, and national card scheme actions are treated as triggers that can move the mix between instruments and channels.
Forecasting is done using scenario analysis supported by trend smoothing on the most stable variables, and then the scenario weights are adjusted based on what market participants expect for adoption and pricing dynamics. If a bottom-up check is needed, we use sampled merchant acceptance footprints and simplified volume times average value logic, and then we scale it carefully to avoid overstating coverage in smaller merchant categories. Any gaps in inputs are handled with conservative ranges that are later narrowed through re-contacts and cross-checks with independent demand signals.
Data Validation & Update Cycle
Validation happens in several passes so the final totals stay consistent with real-world signals. We compare outputs against independent indicators like consumer spending direction, merchant acceptance growth, and channel share shifts, and then investigate any sharp jumps that do not match known events.
Before sign-off, the model is reviewed by another analyst to check assumptions, unit consistency, and currency timing, and follow-up calls are triggered when a variance cannot be explained by a clear market change. Reports are refreshed annually, and interim updates are made when material regulatory moves, infrastructure launches, or major demand shocks occur. Right before delivery, a fresh review is done so clients receive the most current view that can be supported by the latest available evidence.
Mordor Intelligence's United Arab Emirates Payments Market Estimate Compared With Other Published Estimates
Published market sizes for UAE payments can look far apart because the underlying measure is not always the same, and the scope can quietly shift between transaction value, payment industry revenues, or only one rail like acquiring. Differences also show up when studies mix consumer and business flows unevenly, or when online commerce and POS payments are treated as overlapping rather than distinct.
By tracking channel-level payment value splits and refreshing currency timing and instrument mix assumptions, Mordor Intelligence keeps the total aligned to what is actually processed across POS and online rails in the UAE, rather than blending in revenue-only metrics or a single slice like merchant acquiring. Another recurring gap comes from inclusion rules, where some sources focus on industry take rates and revenues, while others present TPV and then label it as market size, which changes the number by a wide margin.
Benchmark comparison
| Source | Market Size | Gaps in Research Methodology |
|---|---|---|
| Mordor Intelligence | USD 201.76 B (2025) | |
| Trade Journal A | USD 18.80 B (2023) | Uses payments industry total revenues, which reflect fees and monetization, not the underlying transaction value processed across POS and online. |
| Global Consultancy B | USD 150.00 B (2024) | Represents merchant acquiring TPV, which is a subset of total payments activity and can miss non-acquired flows and certain online payment paths depending on routing. |
Looking across the table, the spread is mainly explained by what is being counted, since revenue, TPV, and total payment value are not interchangeable. Our approach makes the scope explicit and then ties the total to observable adoption and sector activity checks, which helps keep the result repeatable when the market mix shifts.
Key Questions Answered in the Report
What is the projected value of the United Arab Emirates payments market by 2031?
It is expected to reach USD 274.79 billion, rising at a 5.18% CAGR between 2026 and 2031.
Which payment mode currently owns the largest share of transactions?
Point-of-sale cards command 79.92% of 2025 value, helped by 92% NFC-enabled terminal coverage.
Which end-user sector is expanding fastest?
Entertainment and digital content is forecast to advance at a 5.89% CAGR through 2031.
How is the Digital Dirham expected to change settlement costs?
Wholesale pilots indicate a 40% cut in interbank settlement expenses and faster transaction finality.
Why do Northern Emirates still rely heavily on cash?
Sparse terminal coverage, cultural preferences, and limited mobile connectivity keep ATM withdrawals elevated.
What role does AANI play for small businesses?
It allows 24/7 instant settlements under 10 seconds, reducing working-capital lock-ups for SMEs.