
Market Overview
| Study Period | 2020 - 2031 |
|---|---|
| Forecast Data Period | 2026 - 2031 |
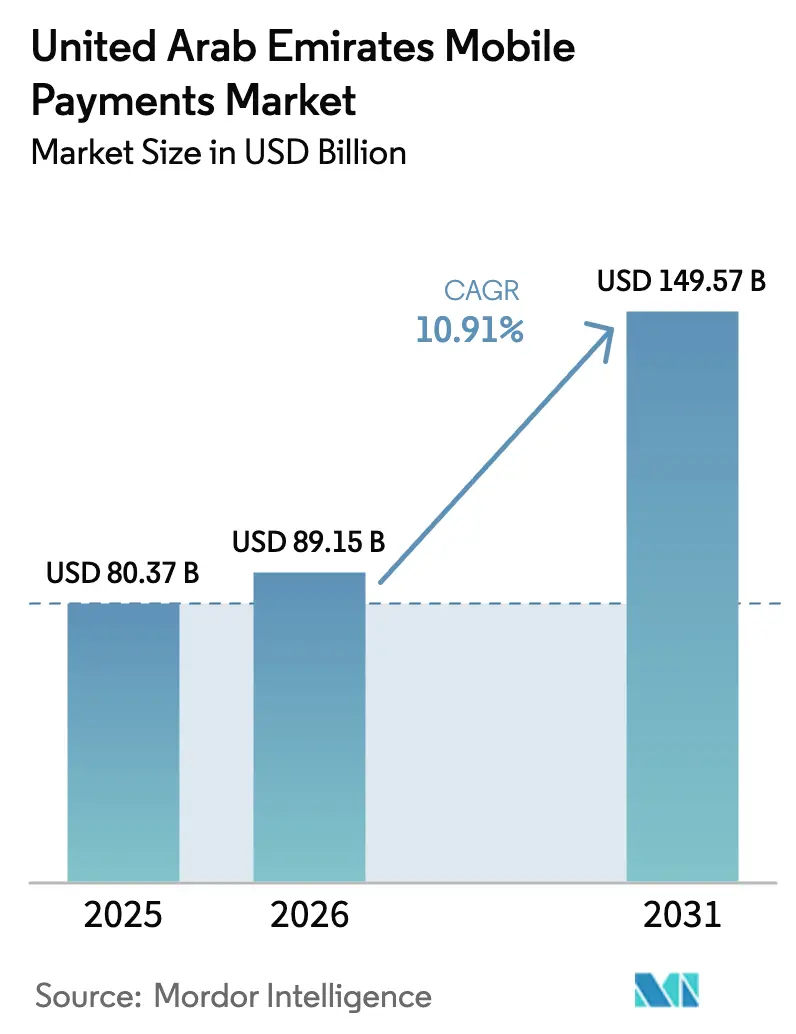
| Base Year Market Size (2025) | USD 80.37 Billion |
| Market Size (2026) | USD 89.15 Billion |
| Market Size (2031) | USD 149.57 Billion |
| Growth Rate (2026 - 2031) | 10.91% CAGR |
| Market Concentration | Medium |
Major Players *Disclaimer: Major Players sorted in no particular order Image © Mordor Intelligence. Reuse requires attribution under CC BY 4.0. | |
United Arab Emirates Mobile Payments Market Analysis by Mordor Intelligence
The UAE mobile payments market size in 2026 is estimated at USD 89.15 billion, growing from 2025 value of USD 80.37 billion with 2031 projections showing USD 149.57 billion, growing at 10.91% CAGR over 2026-2031. Government commitments to double the digital economy’s GDP contribution, rapid 5G roll-out, and a near-universal smartphone penetration rate exceeding 95% underpin this sustained expansion.[1]Global Government Fintech, “UAE ‘Financial Infrastructure Transformation Programme’ Is 85 Per Cent Complete,” globalgovernmentfintech.com Regulatory milestones such as the Central Bank’s Financial Infrastructure Transformation Programme and the Open Finance Regulation have lowered transaction frictions, encouraged data-driven innovation, and created clear rulebooks for new entrants. Intensifying bank-telco alliances, accelerating peer-to-peer (P2P) transfers, and the late-2025 launch timetable for a retail Central Bank Digital Currency (the Digital Dirham) further strengthen the outlook. Despite rising cyber-fraud sophistication, a credible regulatory stance and multi-layered biometric security tools continue to improve consumer confidence, enabling merchants and financial institutions to deepen engagement across every emirate.
Key Report Takeaways
- By payment type, proximity payments commanded 67.30% of UAE mobile payments market share in 2025, while remote payments are forecast to post a 14.05% CAGR through 2031.
- By transaction type, in-store POS led with 39.40% revenue share in 2025; P2P transfers are the fastest-growing at a 13.63% CAGR through 2031.
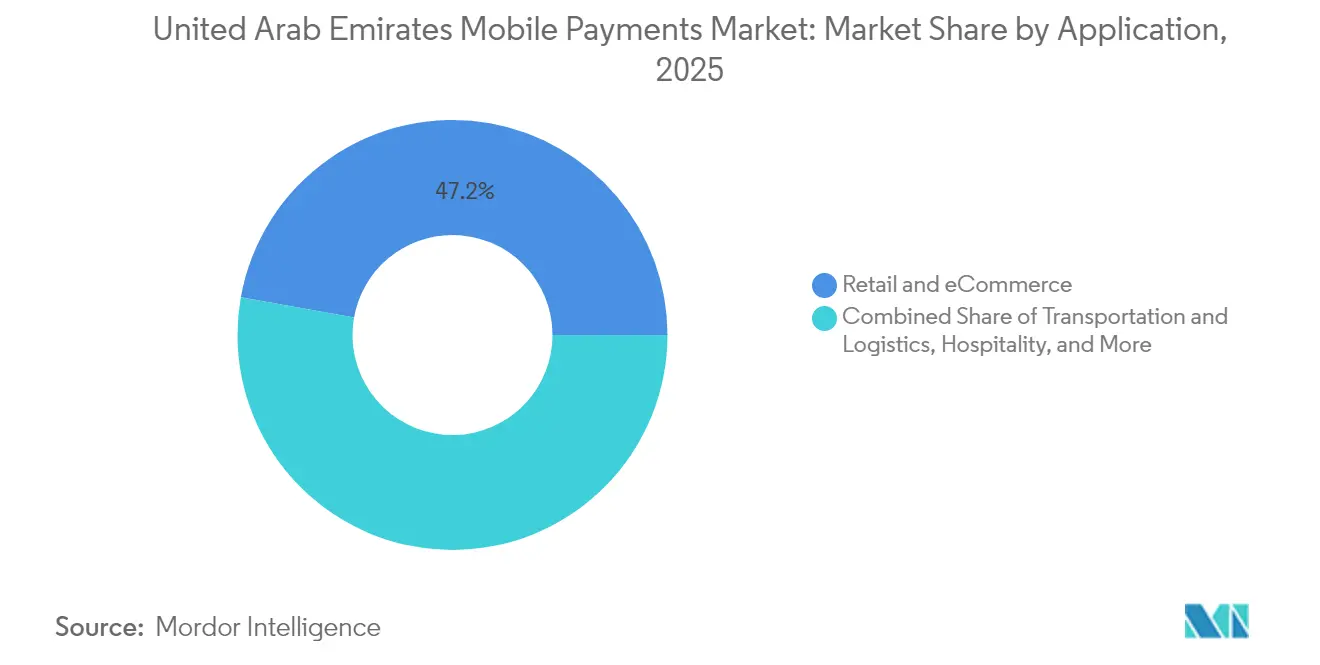
- By application, retail and eCommerce accounted for 47.20% share of the UAE mobile payments market size in 2025; transportation and logistics is advancing at a 15.31% CAGR through 2031.
- By end-user, personal users held 69.10% of value in 2025, whereas the business segment is expanding at a 12.76% CAGR to 2031.
Note: Market size and forecast figures in this report are generated using Mordor Intelligence’s proprietary estimation framework, updated with the latest available data and insights as of 2026.
United Arab Emirates Mobile Payments Market Trends and Insights
Drivers Impact Analysis*
| Driver | (~) % Impact on CAGR Forecast | Geographic Relevance | Impact Timeline |
|---|---|---|---|
| Increase in Smartphone Penetration in UAE | +1.8% | National, concentrated in Dubai and Abu Dhabi | Medium term (2-4 years) |
| Expansion of Mobile Wallet Ecosystem Backed by Local Banks & Telcos | +2.1% | National, with early gains in Dubai, Abu Dhabi, Sharjah | Long term (≥ 4 years) |
| Government-led Cashless Initiatives under UAE Vision 2031 | +1.5% | National, spill-over to broader GCC region | Long term (≥ 4 years) |
| Rising Acceptance of Contactless POS Infrastructure in Retail & Hospitality | +1.9% | Dubai core, expanding to Northern Emirates | Medium term (2-4 years) |
| Surge in Digital Remittance Inflows via Mobile Channels from Expat Workforce | +1.3% | National, concentrated in Dubai and Abu Dhabi | Short term (≤ 2 years) |
| Competitive Promotions and Loyalty Programs Accelerating User Acquisition | +1.2% | National, with focus on urban centers | Short term (≤ 2 years) |
| Source: Mordor Intelligence | |||
Smartphone Penetration Drives Infrastructure Investment
A nationwide smartphone penetration rate above 95% compels banks and telcos to scale digital channels rapidly. Emirates NBD’s ENBD X app now aggregates more than 200 services and records a 91% digital-adoption rate, evidencing the user appetite unlocked by ubiquitous 5G connectivity.[2]Emirates NBD, “ENBD X Application | Mobile Banking App in the UAE,” emiratesnbd.com Both e& and Du have spent heavily on 5G rollout; e& alone serves 189.3 million subscribers and reported 2.5× growth in monthly active users for its e& money fintech unit, underscoring ecosystem readiness.[3]e&, “e& Delivers Record Revenue and Net Profit in FY 2024,” eand.com High-speed mobile bandwidth reduces latency, enabling biometric authentication and real-time fraud analytics that are central to user trust in the UAE mobile payments market.
Banking–Telco Partnerships Reshape the Ecosystem
Integrated propositions such as First Abu Dhabi Bank’s Payit and du Pay illustrate how partnerships pool large customer bases and shared KYC frameworks to lower acquisition costs. Payit connects to 170+ corridors for remittances, while du Pay allows instant transfers to over 200 destinations, a capability welcomed by the 8.84 million expatriates who remit income regularly. These alliances create multi-service super-apps that deepen engagement and raise switching costs, bolstering revenue diversity across the UAE mobile payments market.
We the UAE 2031 Accelerates Cashless Uptake
The Vision 2031 agenda links non-oil diversification goals to digital-payment penetration, steering policy toward mandatory e-government disbursements and broadening the regulatory sandbox. Preparations to issue a retail Digital Dirham by late 2025 reflect a strategic bid to cement monetary sovereignty while testing programmable money use cases in tax collection and subsidy distribution. Such milestones act as signalling devices that bolster investor and merchant confidence in the UAE mobile payments market.
Contactless Infrastructure Expansion Drives Merchant Adoption
Over 70% of retailers reported revenue gains after enabling contactless payments, validating capex in tap-and-go terminals. Flying Tiger’s Scan & Go solution achieved a 50% user-adoption rate within the first week at Dubai Hills Mall, demonstrating consumer readiness for device-based self-checkout. As infrastructure densifies, the UAE mobile payments market gains resilience against friction that once slowed point-of-sale digitisation.
Restraints Impact Analysis*
| Restraint | (~) % Impact on CAGR Forecast | Geographic Relevance | Impact Timeline |
|---|---|---|---|
| Consumer Concerns over Data Privacy amid Expanding Open Banking | -0.8% | National, particularly affecting tech-savvy demographics | Medium term (2-4 years) |
| Fragmented Merchant Acceptance for QR Codes vs NFC Causing Friction | -1.1% | National, more pronounced in smaller emirates | Short term (≤ 2 years) |
| High Cost of Compliance with UAE Central Bank Regulations for New Entrants | -0.6% | National, affecting fintech startups | Long term (≥ 4 years) |
| Cyber-fraud Sophistication Targeting Mobile Wallets in GCC | -0.9% | Regional GCC, with UAE as primary target | Medium term (2-4 years) |
| Source: Mordor Intelligence | |||
Data-privacy concerns challenge open banking implementation
The Open Finance Regulation obliges all licensed financial institutions to facilitate safe data portability; however, many users remain wary of sharing personal details, citing risks of credential stuffing and social-engineering attacks. Although the UAE’s removal from the FATF grey list in 2024 reinforces supervisory credibility, sustained education campaigns and robust consent-handling protocols remain essential to mitigate churn and maintain the UAE mobile payments market growth trajectory.
Payment-infrastructure fragmentation impedes seamless adoption
A dual technology stack—QR and NFC—continues to tax merchant budgets. Retailers often juggle separate terminals to ensure compatibility with Apple Pay, Google Pay, and Samsung Pay, whose bank tie-ups still diverge. The digital transformation of the nol card underscores these hurdles; full iPhone compatibility is pending until 2025, limiting universal acceptance in the interim.
*Our forecasts treat driver/restraint impacts as directional, not additive. The impact forecasts reflect baseline growth, mix effects, and variable interactions.
Segment Analysis
By Payment Type: Proximity payments anchor current value as remote channels sprint ahead
Proximity payments captured 67.30% of the UAE mobile payments market in 2025, reinforced by widespread contactless POS availability across malls, restaurants, and hospitality venues. Emirates NBD’s tap-to-pay flow legitimized sub-15-second transactions, which resonates with consumers who still prefer in-person verification when purchasing higher-ticket items. As a result, the segment contributes the majority of transaction counts, even though average ticket values lean smaller, reflecting quick-service retail frequency. A dense tourist flow—over 5.29 million Indian arrivals annually—further amplifies in-person spending, especially when UPI rails bridge foreign wallets to local terminals. Remote payments, though representing a lower baseline, are projected to outpace at 14.05% CAGR, spurred by eCommerce growth, gig-economy platform wages, and mobile remittance surges. The introduction of Palm ID biometrics illustrates how policymakers intend to raise security without undermining checkout speed, an initiative expected to lift both proximity and remote clearance rates once fully commercialized. Taken together, the respective growth arcs ensure that the UAE mobile payments market remains balanced across user contexts, with contactless cards and wallets dominating brick-and-mortar venues while API-driven wallets expand digital retail.
A structural shift toward hybrid commerce also widens addressable volume. Retailers such as Flying Tiger Copenhagen saw 50% shopper uptake within a week of activating “scan-and-go” checkout, validating the business case for minimal-friction store experiences. Merchants increasingly appreciate that wallet-enabled loyalty schemes heighten sell-through rates without discounting margins. Consequently, proximity solutions are evolving into all-in-one commerce hubs that fuse inventory insights with instant settlement, while remote channels integrate social-commerce plug-ins that capitalize on influencers’ reach. The blended strategy ultimately positions the UAE mobile payments market for omnichannel resilience through 2031 and beyond.


By Transaction Type: Rapid P2P acceleration reshapes liquidity cycles
In-store POS transactions maintained a 39.40% value share in 2025 and remain a cornerstone for the tourism, luxury, and F&B verticals. Yet the Aani instant-payment service is radically altering P2P expectations by completing transfers in under 10 seconds, pushing P2P volumes to a forecast 13.63% CAGR through 2031. The platform’s phone-number routing simplifies addressing, allowing unbanked or underbanked users to transact without IBAN familiarity. A material outcome is the speedier recycling of funds into consumer spending, shortening economic velocity cycles. Person-to-merchant flows also show solid traction due to QR code ubiquity, especially for micro-ticket cafés and parking services. Complementary innovation in bill-pay and government-fee segments via DubaiPay sustains around-the-clock service delivery, thereby widening the transaction canvas and progressively replacing cash envelopes.
P2P momentum creates spill-over effects for micro-lending, salary advances, and gig-worker disbursements. Platforms such as Ziina focus on zero-fee transfers and ride the social-network virality of request links, cementing stickiness among younger cohorts. Combined, these developments reinforce systemic liquidity, lessen reliance on traditional cash cycles, and anchor the secular strength of the UAE mobile payments market.
By Application: Transportation outpaces retail in CAGR terms
Retail and eCommerce uses generated 47.20% of transaction value in 2025, underscoring the UAE’s reputation as a regional shopping hub. Merchants continually layer reward points, cash-back, and instalment options such as Abu Dhabi Islamic Bank’s Shariah-compliant Visa Installments to convert higher-basket checkouts. The shift toward gateway-level tokenization via Mastercard and Visa further reduces fraud ratios, keeping chargeback rates low. Transportation and logistics, however, is posting the fastest 15.31% CAGR as Dubai’s Roads and Transport Authority embeds the nol Pay system into retail micro-payments beyond metro gates. NFC top-ups through smartphones not only substitute ticket booths but also let commuters purchase convenience-store items, illustrating mobility-commerce convergence.
Niche uses in hospitality, education, and health care add incremental momentum. AI-powered, cashier-less EASE stores in Dubai Mall highlight how embedded payments reduce queueing and enrich data trails for predictive restocking. Simultaneously, the UAE Pass provides a secure digital identity layer accepted by over 5,000 public- and private-sector portals, meaning mobile payments can be used seamlessly across fines, licensing, and visa renewals.
By End-User: SME digitization gains pace within a consumer-first landscape
Personal wallets constituted 69.10% of transaction counts in 2025 and remain the anchor segment for the UAE mobile payments market. High usability, fee-lite structures, and diverse top-up avenues maintain adoption momentum. Meanwhile, enterprises—especially SMEs—are onboarding at a 12.76% CAGR as management teams recognize tap-to-pay as table-stakes for millennial and Gen Z customers. Solutions such as Emirates NBD Pay handle 143 currencies, accept chip-and-PIN, QR, and tokenized wallets, and deliver auto-reconciliation files that collapse manual bookkeeping cycles. Commercial Bank International’s tie-up with areeba illustrates how acquirer-processor partnerships unlock white-label gateways for fintechs, opening new revenue linchpins targeting the USD 5.7 billion UAE fintech sector projected for 2029.
Corporate uptake extends to payroll cards, spend-management analytics, and in-app credit lines. Pine Labs’ Credit+ platform, co-developed with Emirates NBD, enables merchants to offer pay-by-link and buy-now-pay-later options, nudging average order values upward. These capabilities demonstrate how the UAE mobile payments industry is broadening beyond consumer wallets and embedding deep within enterprise resource planning layers.
Geography Analysis
Dubai and Abu Dhabi collectively accounted for roughly 74.60% of the UAE mobile payments market in 2025, expanding at an anticipated 11.34% CAGR to 2031. Dubai’s Economic Agenda 2033 positions the emirate as a world-class cashless hub, with the Dubai Cashless Working Group orchestrating merchant onboarding programs, bulk terminal subsidies, and digital-literacy drives. The emirate’s hospitality-driven economy attracts heavy cross-border card inflows, amplified by UPI-QR acceptance at 60,000 outlets that streamline spending for Indian tourists. Abu Dhabi’s AED 13 billion AI-native government program likewise catalyzes wallet usage for licensing, traffic fines, and land-department fees, embedding digital settlement into public-sector touchpoints.
The Northern Emirates—Sharjah, Ajman, Ras Al Khaimah, Fujairah, and Umm Al Quwain—collectively represented 25.40% of value in 2025 but are projected to grow at 10.05% CAGR. Merchant acceptance gaps persevere, particularly around QR readiness, yet public-sector salary disbursement cards and micro-merchant QR grants are narrowing the divide. Regional banks deploy branch-lite onboarding buses, while telecom kiosks in malls handle same-day SIM-wallet linking, progressively homogenizing user experiences across emirates. Such measures widen the UAE mobile payments market footprint beyond metropolitan cores.
At a regional level, the UAE is positioning itself as the GCC’s settlement hub. Intra-GCC trade rose to USD 143 billion in 2021, but clearing still leans on correspondent banking. Emirates NBD’s 24/7 USD-clearing collaboration with Citi compresses settlement lags, with Saudi Arabia queued next for rollout. Coupled with the Digital Dirham’s 2025 launch runway, the UAE mobile payments market is set to become the region’s reference rail for real-time, multi-currency transactions.
Regulatory Landscape
Mobile payments in the UAE operate under a Central Bank of the UAE (CBUAE)-led framework for onshore payment services. Licensing and ongoing supervision are anchored in the Retail Payment Services and Card Schemes (RPSCS) Regulation, supported by the CBUAE rulebook for retail payment services. CBUAE supervision covers stored value facilities, retail payment services, card schemes, and payment token services, with oversight of payment systems aligned to the CPSS-IOSCO Principles for Financial Market Infrastructures (PFMI), including distinctions between designated (systemically important) and non-designated systems.
During the study period, Federal Decree-Law No. 6 of 2025 (effective September 16, 2025) expanded the set of licensed financial activities and reinforced licensing and compliance expectations for payment service providers. Entities captured under the updated framework have a transition window to regularize licensing status until September 16, 2026, shaping market entry timelines and compliance budgeting for fintechs and non-bank payment players alongside AML/CFT/CPF obligations under Federal Decree-Law No. 10 of 2025 and Cabinet Resolution No. 134 of 2025.
Value Chain Analysis
The UAE mobile payments value chain starts with regulated payment service providers and account holders (banks and non-banks) operating under CBUAE oversight. It then extends through wallet issuers and stored value facilities, payment gateways and aggregators, acquiring and processing infrastructure, and acceptance endpoints. Within the CBUAE retail payments perimeter, licensing spans multiple retail payment service categories including payment account issuance, payment instrument issuance, merchant acquiring, payment aggregation, fund transfer, payment token services, payment initiation, and payment account information services, which together define where value is created across onboarding, authorization, clearing, and settlement.
At the acceptance and consumer interface layer, device OEM wallets such as Apple Pay and platform wallets such as Google Wallet build on tokenization and bank enablement for NFC payments at POS and in-app checkout. For remote commerce, payment gateways and orchestrators connect merchants to local and cross-border payment methods, including through platforms such as Amazon Payment Services serving online businesses. Risk, compliance, and fraud management run across the chain, with KYC/AML screening, token services, and transaction monitoring shaped by CBUAE thematic reviews and payment system supervision requirements.
Competitive Landscape
The UAE mobile payments market demonstrates moderate concentration yet rising rivalry as large banks, telcos, and fintechs vie for user primacy. Emirates NBD maintains leadership through a one-third share of national credit-card spend and recorded AED 27.1 billion (USD 7.38 billion) profit before tax in 2024, of which digital channels contributed a sizable volume uplift. Its Aani instant-payment adoption fold brought cross-bank interoperability, internally cutting manual reconciliation costs and externally locking in customer stickiness. Telecommunications group e& leverages its vast subscriber base to cross-sell its e& money wallet, which tripled international transfer volumes in 2024, proving that telcos possess viable cost-of-acquisition advantages through embedded airtime incentives.
First Abu Dhabi Bank differentiates via Payit, which waives minimum balance requirements—an effective play to capture first-salary accounts for newly arrived expatriates and consequently own remittance flow adjacency. Abu Dhabi Islamic Bank takes an Islamic-finance angle, launching personal-finance managers and Shariah-compliant instalment products that appeal to faith-conscious demographics. Fintech-bank infrastructure partnerships are on the rise; Commercial Bank International’s areeba deal furnishes turnkey BIN-sponsorship and PCI infrastructure to challenger wallets, compressing time-to-market cycles.
International processors such as Checkout.com and Paymentology are embedding deeper by acting as orchestration layers for local players, thereby lowering latency and enabling A/B testing of new tender types. Disruptors including Ziina concentrate on social P2P flows, whereas palm-vein biometrics being trialled by the Federal Authority hints at a next wave of hardware-anchored differentiation. Competitive intensity therefore hinges on customer-experience depth, cross-border liquidity access, and compliance stamina as rules on tokenized assets evolve.
United Arab Emirates Mobile Payments Industry Leaders
Amazon Payment Services
Google Pay
Samsung Pay
Apple Pay
NOW Money
- *Disclaimer: Major Players sorted in no particular order


Market Opportunities and Future Outlook
Open finance and regulated data portability create whitespace for consent-led payment initiation and account information services. These functions can reduce checkout friction and support more personalized wallet propositions. The CBUAE thematic review also highlighted rapid scaling in the sector, including 195% customer base growth in stored value facilities and retail payment services between 2023 and 2024, which signals a larger reachable base for wallets, P2P, and embedded payments beyond traditional card-led flows. The transition window for entities captured by the 2025 CBUAE Law through September 16, 2026 also concentrates provider regularization efforts into a defined period, supporting clearer counterparty selection for banks, merchants, and platforms working with licensed aggregators and token service providers.
New payment experiences remain an actionable opportunity where pilots are visible and merchant pain points persist. CBUAE has run a biometric payment solution pilot (face and palm recognition) in a test phase at the Emirates Institute of Finance, pointing to a pathway for faster authentication at high-throughput locations while maintaining strong security controls. At the same time, ongoing QR versus NFC fragmentation at the merchant layer supports demand for acceptance-side consolidation, including single-terminal, multi-rail acceptance and unified reconciliation, particularly for SMEs operating across Dubai and the Northern Emirates. This includes use cases that blend transport, retail micro-payments, and government fee collection.
Recent Industry Developments
- June 2026: SixthFactor indicates 70.7% of UAE residents are more willing to use digital wallets like Apple Pay, Google Pay, and Samsung Wallet than cash or physical cards. The trend points to growing wallet adoption and supports faster uptake of wallet-based payments and merchant acceptance across the UAE.
- April 2026: Al Etihad Payments (Aani) reports 12.5 million registered users with infrastructure connecting 74 licensed financial institutions. The scale and reach of the instant payments backbone strengthen cross-bank interoperability and facilitate real-time settlement across the UAE.
- January 2026: Visa Middle East expands wallet acceptance for government related payments in the UAE, including Apple Pay, Google Pay, and Rupay. This broadens merchant acceptance and increases wallet utility in public sector payments.


Research Methodology Framework and Report Scope
Market Definition and Coverage
This market covers the value of payments made through a mobile device in the United Arab Emirates, where the phone is used to start and authenticate the transaction and a digital channel completes it. It includes proximity and remote mobile payments across consumer and business usage.
Scope exclusions: It excludes cash payments and card transactions where the phone is not used as the payment instrument (for example, a physical card swipe at the point of sale).
Segmentation Overview
- By Payment Type
- Proximity Payments
- Remote Payments
- By Transaction Type
- Peer-to-Peer (P2P)
- In-store Point-of-Sale (POS)
- Person-to-Merchant (P2M/Checkout)
- Other Transaction Types
- By Application
- Retail and eCommerce
- Transportation and Logistics
- Hospitality and Food-Service
- Government and Public Sector
- Other Applications (Education, Healthcare)
- By End-user
- Personal
- Business
Data Sources, Market Sizing, and Validation
Desk Research
Desk research was used to set the UAE payments context, map the main rails, and pin down the measurable signals that influence mobile payment use in retail and online commerce. Public sources such as the Central Bank of the UAE publications, UAE government digital economy and payments initiatives, and official statistics releases helped us align definitions and avoid counting the same activity twice.
To translate demand signals into a usable model, we also reviewed materials such as annual reports and investor presentations from financial institutions, payments acceptance updates from industry associations, and reputable press coverage of rule changes and infrastructure launches. Where needed, we referenced paid subscriptions focused on company financials and intelligence, news and financials, and patent databases to cross-check timelines and product readiness. The sources listed here are illustrative only, and many other references were used for data collection, validation, and clarification.
Primary Interviews and Surveys
Primary work focused on validating what is actually counted as a mobile payment in day to day UAE commerce, and how fast usage is shifting across proximity and remote use cases. We spoke with a mix of payment ecosystem participants and merchant side stakeholders, and then used their inputs to test assumptions on transaction mix, average ticket patterns, and adoption constraints across major emirates.
Distribution of primary research fieldwork respondents
| Company type | Respondent position | Region |
|---|---|---|
| Top tier: 32% | CXOs: 20% | |
| Mid tier: 46% | Functional/Unit leaders: 25% | |
| Smaller Players: 22% | Managers: 55% |
Market-Sizing & Forecasting
Sizing starts from a top-down build where the total UAE non-cash activity is reconstructed into a mobile addressable pool using channel mix and payment instrument adoption. It is then filtered through mobile specific usage patterns so only transactions initiated and confirmed through a mobile device remain in the count.
To keep the numbers practical, we tracked inputs such as smartphone penetration and active mobile internet use, contactless acceptance readiness at merchants, e-commerce share of retail spend, consumer comfort with wallet based authentication, and the mix of proximity versus remote transactions. Where gaps appeared in published series, we used conservative ranges and then narrowed them after re-checking with interview feedback and consistency checks across adjacent indicators.
Forecasts were built using scenario analysis supported by trend smoothing, since policy changes and infrastructure rollouts can shift adoption faster than a straight line. Assumptions on transaction growth and value growth were separated, because average ticket behavior differs by use case, and that difference matters in the UAE.
Data Validation & Update Cycle
Validation is done by triangulating the model outputs against independent signals, and then re-testing any large variance before final sign-off. Checks include year over year growth sanity tests, share of channel comparisons, and cross-referencing the implied mobile payment intensity against known adoption and acceptance milestones.
Before publication, results go through a multi-step internal review where assumptions, formulas, and source linkages are inspected, and outliers are challenged until they can be explained. Reports are refreshed annually, and interim updates are done when material events occur, such as major regulatory changes or infrastructure launches. Right before delivery, we perform a fresh pass so clients receive the latest updated view.
Mordor Intelligence's United Arab Emirates Mobile Payments Market Estimate Compared With Other Published Estimates
Published market numbers for UAE mobile payments can look far apart, even when they are all trying to describe the same shift toward phone based commerce. The main reasons usually come down to what is being counted, which year is treated as the base, and whether the figure represents payment value or a smaller revenue slice.
Merchant acquiring revenue and fees sit outside Mordor Intelligence's scope here, since the model tracks transaction value flowing through mobile initiated payments rather than provider take rates. Differences also come from whether stored wallet balances are treated like spending, how remote in-app checkouts are counted, and how fast average ticket values are assumed to move with inflation and category mix. When refresh timing differs, currency conversion and late-year demand swings can also create visible gaps in the published totals.
Benchmark comparison
| Source | Market Size | Gaps in Research Methodology |
|---|---|---|
| Mordor Intelligence | USD 80.37 B (2025) | |
| Regional Consultancy A | USD 0.47 B (2024) | Measures merchant acquiring revenue from mobile related payment acceptance, so it captures provider take rates and not the full value of mobile initiated transactions. |
| Industry Journal B | USD 4.18 B (2024) | Tracks mobile wallet market activity at the wallet layer, which can focus on wallet accounts and stored value use and may not fully represent total mobile payment value across proximity and remote checkouts. |
The spread in the table is mainly explained by whether a study is counting transaction value, wallet layer activity, or revenue earned from acceptance. By keeping inputs tied to observable adoption and channel signals, and by separating volume growth from ticket growth, the sizing stays easier to replicate and easier to audit across years.


Key Questions Answered in the Report
What is the current value of the UAE mobile payments market?
The UAE mobile payments market size is valued at USD 89.15 billion in 2026 and is forecast to reach USD 149.57 billion by 2031.
Which payment type leads the UAE mobile payments market?
Proximity payments hold 67.30% market share, supported by extensive contactless POS infrastructure across retail and hospitality venues.
How fast are P2P mobile transfers growing in the UAE?
Peer-to-peer transfers are advancing at a 13.63% CAGR through 2031, driven by instant-payment platforms such as Aani.
Why is the transportation segment growing the fastest?
Dubai’s nol Pay integration into public transport and retail micro-payments is propelling transportation applications at a 15.31% CAGR through 2031.
What role will the Digital Dirham play?
The Digital Dirham, scheduled for late 2025, will introduce a retail central bank digital currency that can reduce settlement costs and support cross-border interoperability.
Which companies dominate the competitive landscape?
Emirates NBD, e&, and First Abu Dhabi Bank are leading players, with Emirates NBD alone capturing one-third of national credit-card spending.
Page last updated on:






