United Arab Emirates Food Products Market Size and Share
Market Overview
| Study Period | 2021 - 2031 |
|---|---|
| Base Year For Estimation | 2025 |
| Forecast Data Period | 2026 - 2031 |
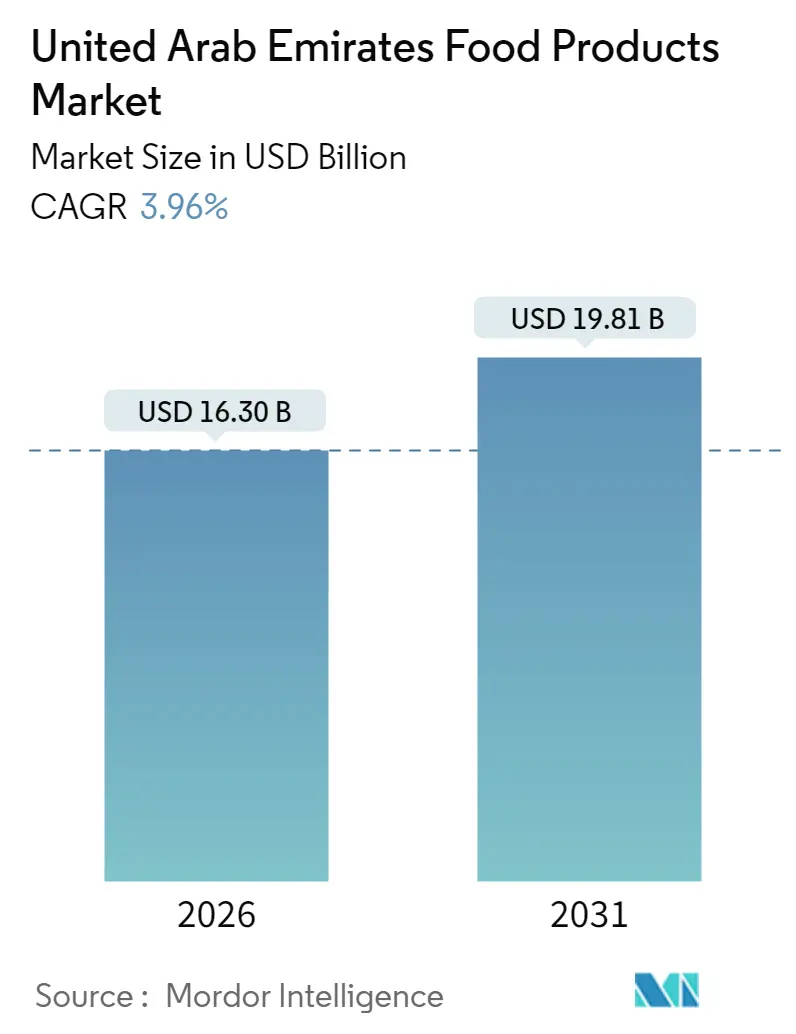
| Market Size (2026) | USD 16.3 Billion |
| Market Size (2031) | USD 19.81 Billion |
| Growth Rate (2026 - 2031) | 3.96% CAGR |
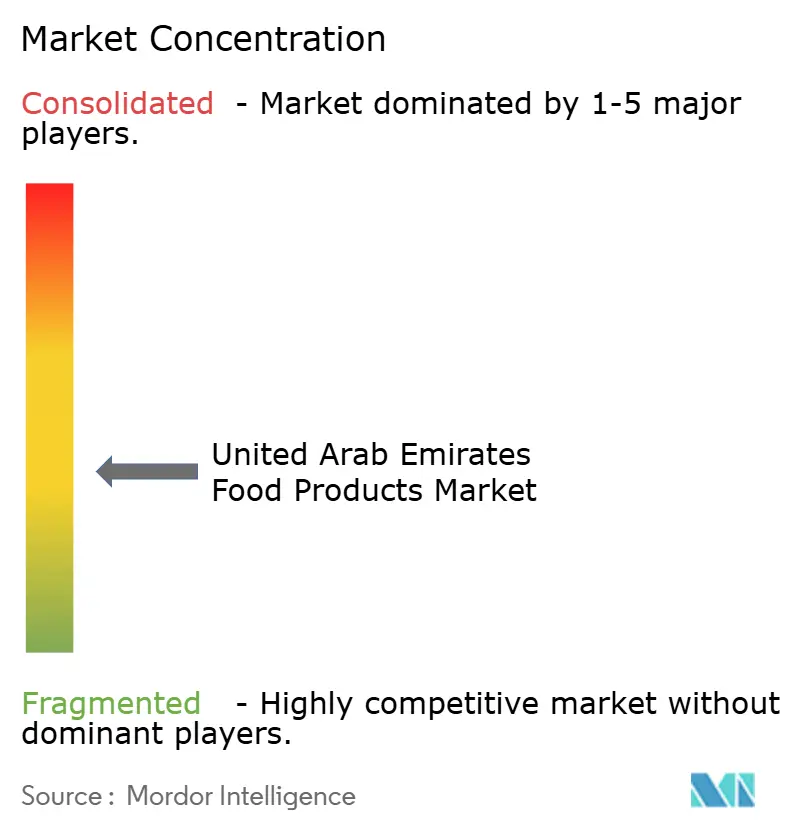
| Market Concentration | Medium |
Major Players
*Disclaimer: Major Players sorted in no particular order Image © Mordor Intelligence. Reuse requires attribution under CC BY 4.0. |
|
United Arab Emirates Food Products Market Analysis by Mordor Intelligence
United Arab Emirates (UAE) food products market size in 2026 is estimated at $16.3 billion, growing from 2025 value of $15.68 billion with 2031 projections showing USD 19.81 billion, growing at 3.96% CAGR over 2026-2031. The market capitalizes on the UAE's strategic position as a re-export center and its reliance on food imports, presenting significant opportunities for global suppliers within established food safety frameworks. The diverse expatriate population, combined with rising consumer awareness and increasing disposable income, fuels sustained demand for high-quality organic products and international cuisine varieties. The market's growth is further supported by the UAE's robust retail infrastructure, with modern supermarket chains offering extensive product selections to meet evolving consumer preferences and dietary requirements.
Key Report Takeaways
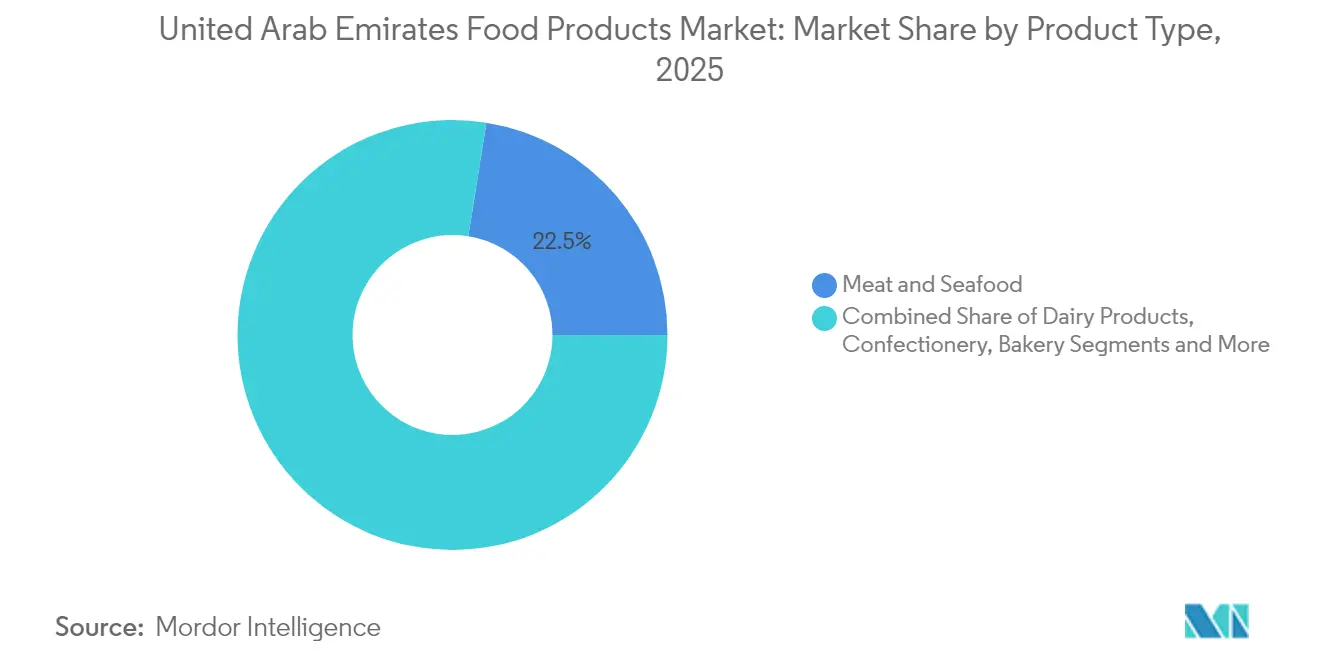
- By product type, meat and seafood captured 22.48% of the United Arab Emirates food products market share in 2025, while ready-to-eat meals are projected to post a 4.16% CAGR during 2026-2031.
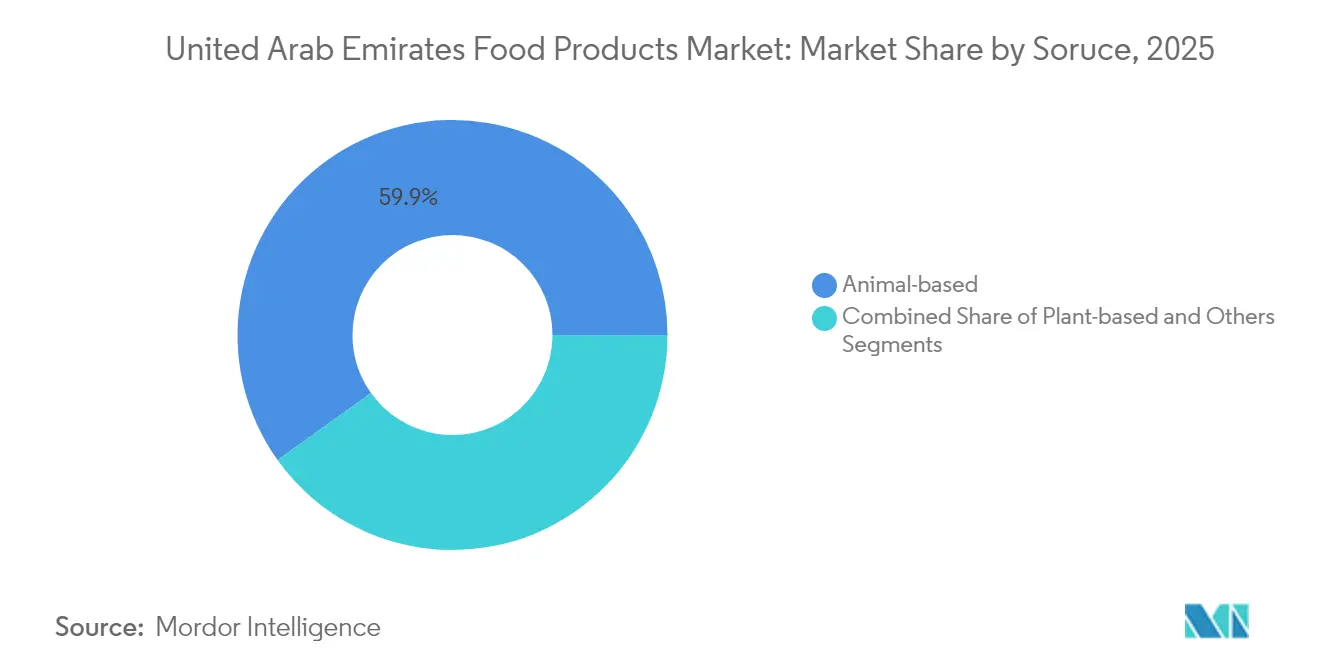
- By source, animal-based items held a 59.87% share in 2025; plant-based alternatives will advance at a 5.35% CAGR through 2031.
- By nature, conventional goods contributed a 84.81% share to the United Arab Emirates food products market in 2025, whereas organic products are on track for a 4.82% CAGR.
- By distribution channel, off-trade outlets controlled 71.98% of 2025 sales, but on-trade venues are expected to clock a 4.28% CAGR to 2031.
- By geography, Dubai led with a 41.28% share of 2025 revenue, while Abu Dhabi is expected to achieve the fastest growth, recording a 5.55% CAGR throughout the forecast period.
Note: Market size and forecast figures in this report are generated using Mordor Intelligence’s proprietary estimation framework, updated with the latest available data and insights as of January 2026.
United Arab Emirates Food Products Market Trends and Insights
Driver Impact Analysis
| Driver | (~) % Impact on CAGR Forecast | Geographic Relevance | Impact Timeline |
|---|---|---|---|
| Growing expatriate population | +0.8% | Dubai and Abu Dhabi | Long term (≥ 4 years) |
| Busy lifestyles and convenience demand | +0.6% | Dubai and Sharjah urban corridors | Medium term (2-4 years) |
| Expanding tourism sector | +0.9% | Dubai, Abu Dhabi, spill-over to Northern Emirates | Medium term (2-4 years) |
| Rising organic and clean-label preferences | +0.4% | Affluent zones across UAE | Long term (≥ 4 years) |
| Strategic food-security investments and local production drive | +0.5% | Abu Dhabi and Al Ain agri-tech clusters | Long term (≥ 4 years) |
| Enhanced cold-chain and e-commerce infrastructure improves access | +0.3% | National, anchored in Jebel Ali and KEZAD corridors | Medium term (2-4 years) |
| Source: Mordor Intelligence | |||
Growing Expatriate Population Drives Demand for Diverse Food Categories
The United Arab Emirates has a significant expatriate population, with expats comprising 88.5% of the total population in 2024, according to EmiratisationGate. The UAE food products market serves diverse consumer segments with distinct preferences [1]Emiratisation Gate, "Growth of the Expatriate Population,"emiratisationgate.org. Single professionals prefer smaller package sizes for convenience, while affluent consumers choose premium brands. Western expatriates drive organic food sales through health-conscious purchases, and South Asian communities maintain demand for traditional ingredients like spices, lentils, and halal-certified meats. The implementation of extended residency permits strengthens the market's consumer base, supporting continued multicultural demand that influences product offerings and retail strategies.
Busy Lifestyles Fuel Demand for Packaged and Ready-to-Eat Foods
The accelerating urban lifestyle across major emirates in the UAE drives significant growth in convenience food categories, particularly in Dubai, Abu Dhabi, and Sharjah. Ready-to-eat and ready-to-cook meals have emerged as the fastest-growing segment, supported by increasing disposable income and time constraints among working professionals. Dubai residents consume meals outside their homes approximately three times per week, an increase from the previous year, reflecting a fundamental shift in eating patterns toward convenience and time-saving options. This trend is further reinforced by the expanding network of food delivery services and the growing presence of international quick-service restaurant chains across the region.
Expanding Tourism Sector Increases Demand in Retail and HoReCa Channels
The tourism growth generates significant demand across retail and foodservice sectors, with international visitor spending expected to reach AED 228.5 billion in 2025[2] Hospitality Net, “Hospitality Net,” hospitalitynet.org. Infrastructure investments drive market growth, particularly through Dubai's development of the world's largest fresh food hub, which aims to enhance regional food distribution networks. The expansion of cold chain logistics capabilities ensures consistent product availability across tourism areas, supporting the hospitality sector's growth. The importance of food tourism is evident through Dubai's culinary achievements, with three restaurants receiving Michelin Green stars in 2024. This recognition emphasizes the region's commitment to sustainability and culinary excellence, attracting international visitors seeking unique dining experiences and contributing to the market's expansion.
Rising Demand for Organic and Clean-Label Products Shapes Consumer Preferences
Health-conscious consumers in the UAE are driving the demand for organic and clean-label products. High-income expatriates, particularly Westerners, are favoring organic products due to their premium positioning, as reported by retailers. Additionally, the UAE's halal certification assures quality and strengthens the clean-label appeal, attracting Muslim consumers who prioritize both health and religious compliance. Furthermore, government initiatives in food labeling are amplifying ingredient transparency, further bolstering this trend. These initiatives aim to enhance consumer trust and encourage informed purchasing decisions, thereby supporting the growth of organic and clean-label food products.
Restraints Impact Analysis
| Restraint | (~) % Impact on CAGR Forecast | Geographic Relevance | Impact Timeline |
|---|---|---|---|
| Rising obesity concerns reduce fried and sugary intake | −0.3% | Major city centres | Medium term (2-4 years) |
| Volatility in global ingredients prices elevates costs | −0.5% | National processing hubs | Short term (≤ 2 years) |
| Evolving food-safety regulations increase compliance outlay | −0.4% | Nationwide, strongest in HoReCa | Short term (≤ 2 years) |
| Consumer price sensitivity limits premium product uptake | −0.2% | Low- to middle-income districts | Medium term (2-4 years) |
| Source: Mordor Intelligence | |||
Rising Obesity Concerns Reduce Consumption of Fried and Sugary Products
The UAE's public health initiatives targeting obesity reduction impact high-calorie food categories, as many adults and children are classified as overweight based on recent assessments. Government measures, including health education programs, school food guidelines, and taxes on sugar-sweetened beverages, affect consumption of confectionery and high-sugar products. Nutrition labeling requirements and health warnings have enhanced consumer awareness and promoted healthier alternatives. While school-based interventions show varied outcomes, with persistent high consumption of sugar-sweetened beverages among students, the growing health-conscious trends create opportunities for reduced sugar, salt, and fat products. Food manufacturers respond through product reformulation and health-focused marketing, though this requires increased R&D investment and affects profit margins.
Volatility in Global Ingredients Prices Affects Production Costs and Pricing
A high level of import reliance makes the UAE particularly vulnerable to global price volatility and supply chain disruptions. Key ingredients such as wheat, sugar, dairy products, cooking oils, and animal feed are predominantly imported from regions like North America, Europe, and Asia. Ingredient price volatility creates significant cost pressures across the UAE's food and beverage supply chain. Factors such as geopolitical conflicts (e.g., the Russia-Ukraine war), climate change affecting crop yields, and disruptions in international logistics have contributed to sharp fluctuations in prices of essentials like grains, oils, and dairy inputs. These rising input costs are squeezing profit margins for food manufacturers and forcing many to either absorb the additional costs or pass them on to consumers through higher retail prices.
Segment Analysis
By Product Type: Meat and Seafood Dominance Amid Ready-Meal Innovation
The meat and seafood segment commands 22.48% market share in 2025, reflecting the UAE's high protein consumption and its diverse population comprising South Asian and Western expatriates. The UAE's strategic location and infrastructure, particularly Dubai's Jebel Ali Port, facilitate the efficient import of meat and seafood from global suppliers.
The ready-to-eat and ready-to-cook meals segment is projected to grow at a 4.16% CAGR during 2026-2031, driven by urbanization and rising demand for convenient, high-quality meal solutions. Regional production capacity is increasing, as evidenced by Al Ghurair Foods' investment in December 2024 in an Abu Dhabi poultry facility. The facility targets to produce 10 million day-old chicks and 10,000 metric tons of poultry meat annually. This investment aligns with the growing trend of local production to meet rising consumer demand and reduce reliance on imports, ensuring a steady supply of fresh and processed poultry products.
Note: Segment shares of all individual segments available upon report purchase
By Nature: Conventional Dominance alongside Organic Upswing
Conventional products hold an 84.81% market share in 2025, supported by competitive pricing, extensive distribution networks, and established consumer trust. The segment strengthens its position through bulk sales in hypermarkets and an expanding range of private-label offerings across the UAE food and beverage market. The conventional segment maintains its dominance through strategic partnerships with retailers, efficient supply chain management, and continuous product innovation to meet evolving consumer preferences.
The organic segment grows at a 4.82% CAGR, driven by rising household disposable incomes and increased consumer awareness about chemical residues in food products. Government agricultural initiatives support the expansion of certified organic farming areas. Consumer preferences for clean-label products now include minimally processed dairy products, natural sweeteners, and detailed ingredient declarations, prompting mainstream brands to reformulate products to meet these requirements. The organic segment's growth is further supported by increasing health consciousness among consumers and the rising adoption of sustainable farming practices.
By Source: Established Animal Lines and Accelerating Plant-Based Traction
Animal-based products account for 59.87% of the UAE food and beverage market in 2025, with dairy and meat products serving diverse ethnic consumer preferences. The market maintains consistent growth through well-established import networks and expanding domestic production facilities. The robust supply chain infrastructure and increasing local production capabilities ensure reliable product availability across the Emirates. For instance, Abu Dhabi Agriculture and Food Safety Authority (ADAFSA) has launched a “Livestock Fodder Support Program.” This initiative aims to provide UAE livestock and poultry producers with convenient access to high-quality feed at competitive prices, supporting and sustaining local production.
The plant-based alternatives segment is expected to grow at a 5.35% CAGR, supported by Abu Dhabi's new vegan meat production facility that manufactures halal, allergen-free protein alternatives. The "others" category, which includes hybrid protein snacks and functional beverages, demonstrates significant potential for innovative ingredient formulations and product development in response to evolving consumer demands.
Note: Segment shares of all individual segments available upon report purchase
By Distribution Channel: Retail Scale and Foodservice Revival
Hypermarkets and supermarkets dominated the UAE food and beverage market with 71.98% of sales in 2025, offering consumers extensive product variety, competitive private-label options, and regular promotions. These off-trade channels maintain their market leadership through strategic pricing strategies, diverse product portfolios, and consistent promotional campaigns that attract value-conscious consumers.
The on-trade segment is experiencing a 4.28% CAGR, benefiting from tourism growth, changing local dining habits, and new restaurant concepts. This growth is particularly evident in Dubai's increasing restaurant density and Abu Dhabi's culinary developments in commercial areas, while convenience stores in residential neighborhoods complement the distribution network by meeting immediate consumer needs through strategic locations and targeted product offerings.
Geography Analysis
Dubai accounts for 41.28% of the UAE food and beverage market sales in 2025, driven by its port logistics efficiency, tourism sector, and multicultural population. The emirate's infrastructure initiatives, including the Fresh Food Hub and Food District project, strengthen supply chain reliability. The presence of premium retail locations provides consumers access to diverse international cuisines. Sustained investments and high regional disposable income levels maintain the market's growth momentum.
Abu Dhabi demonstrates the highest growth rate among emirates with a projected 5.55% CAGR, driven by strategic investments in agricultural technology, aquaculture, and alternative protein development. The Khalifa Economic Zones Abu Dhabi (KEZAD) integrates grain mills, beverage production facilities, and the region's largest PET recycling plant, optimizing supply chain efficiency. ADAFSA's QR-coded farm certification system enhances consumer trust in local products, including vertical farm produce and aquaculture items. The expansion of cultural attractions, including the Louvre Abu Dhabi and Yas Island theme parks, creates food service opportunities, while luxury hotel developments like Saadiyat Grove enhance the dining landscape .
Sharjah and the northern emirates capitalize on cost-effective industrial zones and their strategic location near Dubai's consumer base. Improved highway networks and cold-chain infrastructure reduce transportation times to expanding residential areas. The development of KEZAD and Food Tech Valley facilities will expand production capabilities across the UAE, increasing the food and beverage market's regional coverage.
Competitive Landscape
The UAE food products market maintains a moderate concentration level, with multinational corporations and local companies competing for market share. Global players like Nestlé, PepsiCo, and Mars utilize their established brands to maintain significant market presence. Regional companies such as Agthia, Al Islami, and Al Marai maintain strong market positions through comprehensive halal product offerings and competitive pricing strategies.
Mid-sized companies target specific market segments, including premium snacks and plant-based proteins, through e-commerce platforms, influencer partnerships, and frequent product launches. These companies demonstrate agility in responding to changing consumer preferences and market dynamics, enabling them to capture niche market opportunities effectively.
Companies differentiate themselves through technology adoption, focusing on e-commerce platforms, supply chain improvements, and digital marketing initiatives to enhance consumer reach. Market opportunities remain abundant in plant-based alternatives, sustainable packaging solutions, and premium organic products, where consumer demand consistently surpasses current supply levels. New market entrants can establish strong market presence through focused product innovation and targeted marketing approaches that address specific consumer needs and preferences.
United Arab Emirates Food Products Industry Leaders
-
BRF S.A.
-
Almarai Co.
-
The Savola Group
-
Mars Incorporated
-
Nestlé S.A.
- *Disclaimer: Major Players sorted in no particular order
Recent Industry Developments
- January 2025: Al Islami Foods launched its Extra-Large Shrimps range, featuring three products. The shrimps are sourced from clean waters and prepared with strict quality control measures. This premium product line reflects Al Islami's focus on providing healthy and sustainable seafood options to consumers.
- October 2024: Pure Ice Cream, which produces brands like Kwality Ice Creams and Hershey's Ice Cream, has signed a musataha agreement to build a production facility in Dubai Industrial City. This project involves an AED 80 million investment in the region's leading manufacturing and logistics hub
- February 2024: Hunter Foods, a gourmet snack manufacturer, introduced its latest offerings—mushroom chips and okra chips—at Gulfood in Dubai. These new products aim to meet the growing demand for healthy and innovative snack options in the market.
Research Methodology Framework and Report Scope
Market Definitions and Key Coverage
Our study defines the United Arab Emirates food products market as the aggregate value of edible goods, fresh, processed, and packaged, sold through retail counters or served through HoReCa outlets inside the country during a calendar year, net of documented re-exports.
Scope exclusions include alcoholic or soft beverages, pet foods, and animal feed, which are outside the sizing frame.
Segmentation Overview
-
By Product Type
- Meat and Seafood
- Dairy Products
- Confectionery
- Bakery
- Savoury Snacks
- Spices and Seasonings
- Edible Oil
- Ready-to-Eat/Ready-to-Cook Meals
- Baby Food
- Soups and Sauces
- Spreads
- Others
-
By Source
- Animal-based
- Plant-based
- Others
-
By Nature
- Conventional
- Organic/Clean-label
-
By Distribution Channel
- HoReCa/Foodservice
-
Retail
- Supermarkets/Hypermarkets
- Convenience/Grocery Stores
- Online Retail Stores
- Other Distribution Channels
-
By Geography
- Dubai
- Abu Dhabi
- Sharjah
- Others
Detailed Research Methodology and Data Validation
Primary Research
Mordor analysts interviewed importers, modern trade buyers, quick-commerce operators, cold-chain logisticians, and food safety officials across Dubai, Abu Dhabi, and Sharjah. These conversations validated typical landing costs, shrinkage rates, and channel mark-ups, and they surfaced early signals on plant-based adoption and cold-store expansions that do not yet appear in published data.
Desk Research
We begin by mapping the demand pool using open datasets such as UAE Federal Competitiveness & Statistics Centre trade sheets, Dubai Customs import tallies, FAO food balance tables, and USDA GAIN exporter guides, which clarify local production gaps and re-export volumes. Macroeconomic baselines come from the Central Bank of the UAE and IMF outlooks, while consumption pivots are tracked through Euromonitor dashboards and UAE F&B Business Group briefings. Company revenues are screened through D&B Hoovers to flag leading processors and distributors. This list is illustrative; several additional public records and paywalled datasets complemented our desk review.
Market-Sizing & Forecasting
A top-down construct converts official production plus net imports for twelve core product clusters into retail-equivalent values after deducting re-exports and institutional procurement leakages. Results are stress-tested with bottom-up checkpoints, sampled SKU price scans and supplier roll-ups for meat, dairy, and bakery, to fine-tune average selling prices. Key variables steering the model include expatriate population growth, per-capita caloric intake trends, cold-chain capacity additions, organized retail floor space, import tariff shifts, and food inflation. Forecasts are generated through multivariate regression blended with scenario analysis to reflect differing tourism flows and subsidy policies, with coefficient ranges vetted by our primary panel. Data gaps in niche categories (e.g. gourmet spreads) are bridged through analog benchmarks from comparable GCC markets.
Data Validation & Update Cycle
Before sign-off, cross-functional analysts run variance and anomaly sweeps against historical ratios, sister GCC benchmarks, and corporate filings. Any deviation beyond preset thresholds triggers re-contact of field sources. Reports refresh every twelve months, and interim updates are issued when events, such as tariff changes or pandemic shocks, materially shift a driver. A final analyst pass ensures clients receive the latest calibrated view.
Why Mordor's UAE Food Products Baseline Commands Reliability
Published estimates often diverge because firms blend groceries with beverages, mix retail with foodservice, or overlook re-export effects.
Key gap drivers include scope breadth, inflation handling, currency translation dates, and refresh cadence. By isolating edible goods only, adjusting for mandatory halal compliance costs, and renewing drivers annually, Mordor delivers a disciplined, like-for-like baseline.
Benchmark comparison
| Market Size | Anonymized source | Primary gap driver |
|---|---|---|
| USD 15.68 B (2025) | Mordor Intelligence | - |
| USD 37.5 B (2024) | Regional Consultancy A | bundles beverages and foodservice; no re-export deduction |
| USD 40.07 B (2024) | Industry Journal B | consumer spend lens inflates value; currency averaged mid-year |
| USD 39.75 B (2025) | Emerging Analytics C | expenditure-based model plus beverage add-on; assumes uniform 5% ASP rise |
The comparison shows that once beverage turnover, hospitality meals, and double-counted re-exports are stripped out, our 2025 baseline aligns tightly with measured goods moving through UAE retail and HoReCa channels. This disciplined scoping and annual recalibration underpin the confidence that clients place in Mordor's numbers.
Key Questions Answered in the Report
What is the forecast value of the United Arab Emirates food products market by 2031?
The market is projected to reach USD 19.81 billion by 2031.
Which product segment currently commands the largest share?
Meat and seafood products lead with 22.48% of 2025 sales.
How fast is the plant-based sector growing?
Plant-based alternatives are expected to post a 5.35% CAGR between 2026 and 2031.
Why is on-trade growth outpacing retail?
Tourism recovery and higher dining-out frequency are driving a 4.28% CAGR for on-trade venues.


