Market Overview
| Study Period | 2020 - 2031 |
|---|---|
| Base Year For Estimation | 2025 |
| Forecast Data Period | 2026 - 2031 |
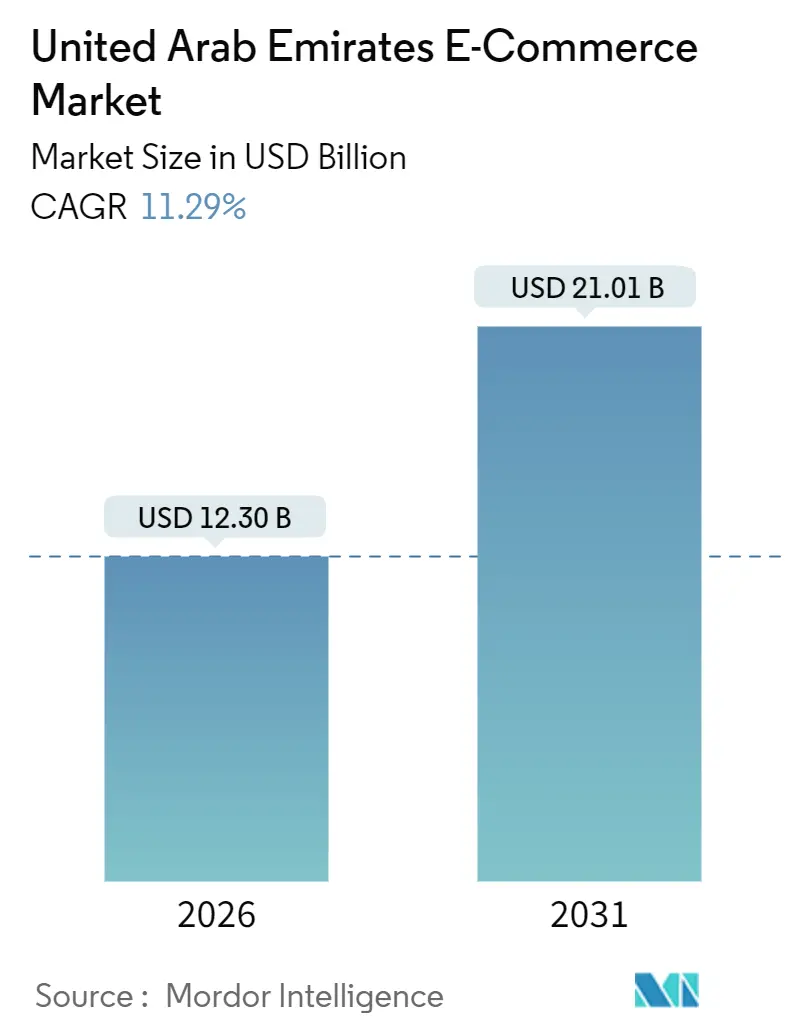
| Market Size (2026) | USD 12.30 Billion |
| Market Size (2031) | USD 21.01 Billion |
| Growth Rate (2026 - 2031) | 11.29% CAGR |
| Market Concentration | Medium |
Major Players *Disclaimer: Major Players sorted in no particular order Image © Mordor Intelligence. Reuse requires attribution under CC BY 4.0. | |
United Arab Emirates E-Commerce Market Analysis by Mordor Intelligence
The United Arab Emirates e-commerce market size reached USD 12.30 billion in 2026 and is forecast to climb to USD 21.01 billion by 2031, reflecting an 11.29% CAGR over the period. Mandatory UAE Pass digital identity, the nationwide Aani instant-payment rail, and foreign-ownership reforms are lowering onboarding friction, shrinking cash-on-delivery reliance, and attracting foreign capital, respectively. Mobile biometric authentication, escalating social-commerce adoption, and fast-growing buy-now-pay-later (BNPL) options are pushing checkout conversion higher while broadening ticket sizes. Investment in micro-fulfillment, 5G connectivity, and cloud infrastructure continues to compress delivery lead times, a vital differentiator as platforms intensify same-day and 15-minute service propositions. However, last-mile costs in sparsely populated emirates, price wars in quick-commerce, and compliance outlays under the 2022 Personal Data Protection Law threaten margin expansion even for the largest operators.
Key Report Takeaways
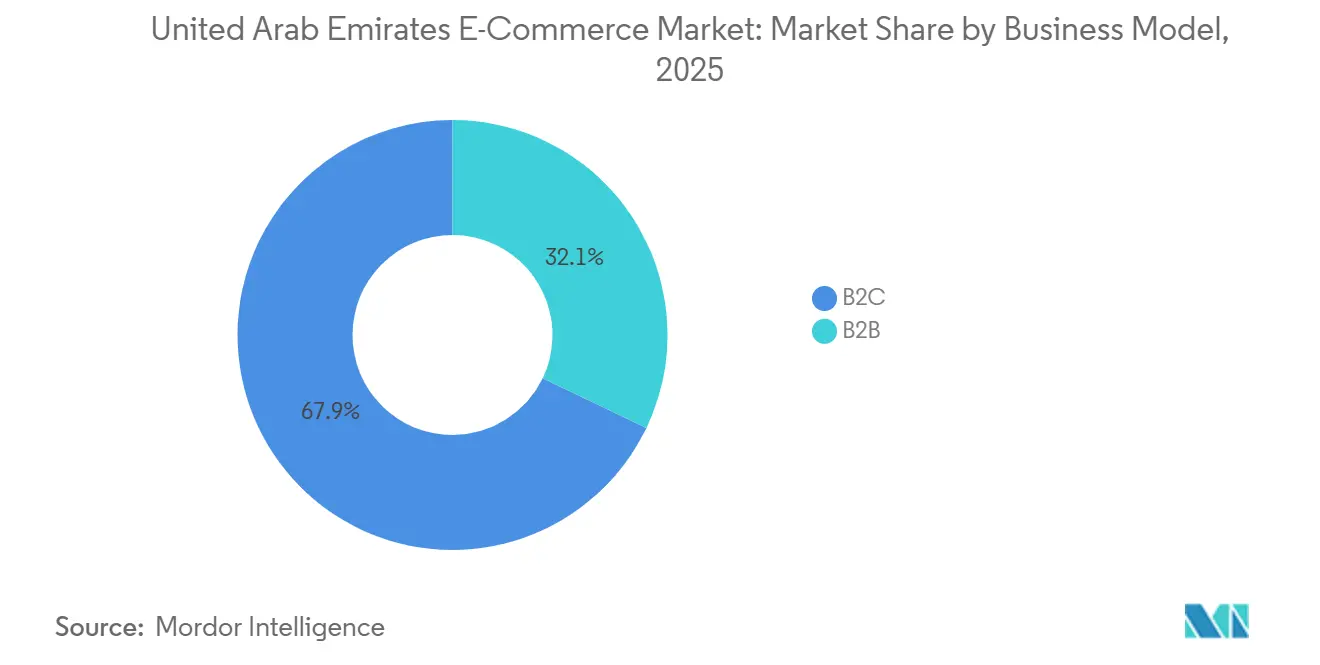
- By business model, business-to-consumer transactions led with 67.89% revenue share in 2025, while business-to-business channels are projected to expand at a 17.43% CAGR through 2031.
- By device type, smartphones accounted for 78.67% of the UAE e-commerce market share in 2025, and the segment is expected to grow at 16.24% CAGR through 2031.
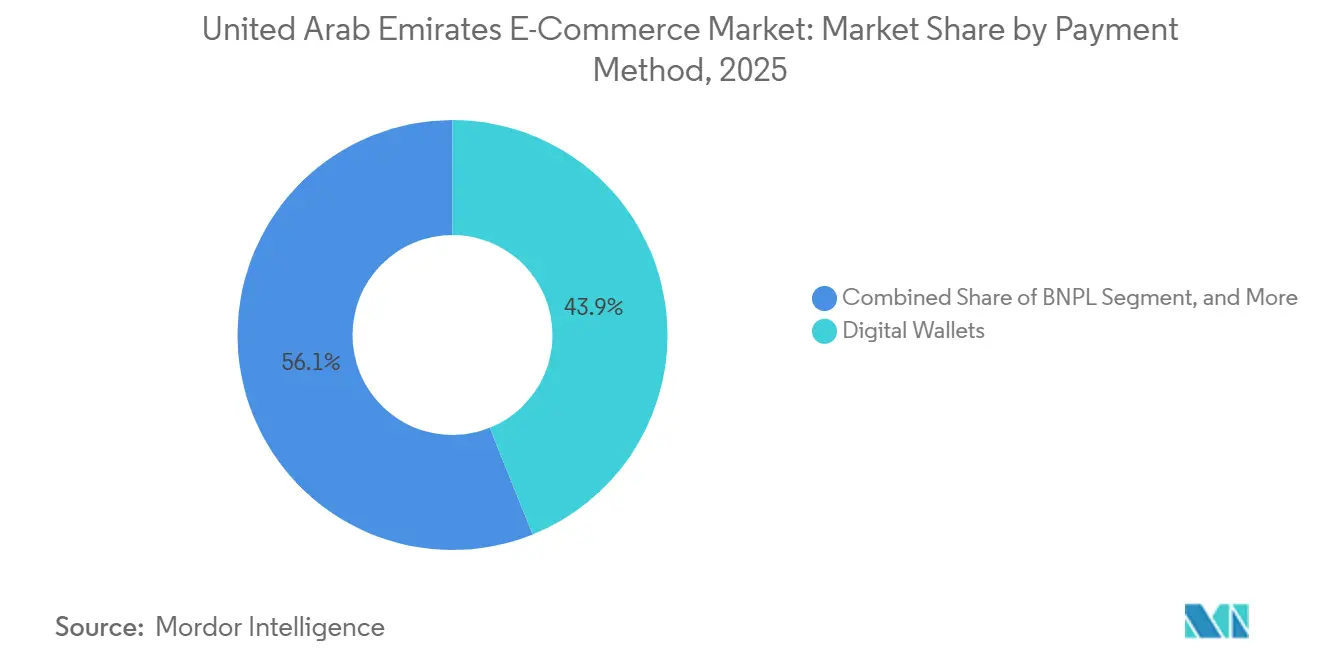
- By payment method, digital wallets held 43.92% share of the UAE e-commerce market size in 2025, whereas BNPL exhibits the fastest trajectory at a 13.27% CAGR to 2031.
- By product category, fashion and apparel commanded 21.59% share in 2025, but food and beverages are forecast to log the highest 13.16% CAGR through 2031.
Note: Market size and forecast figures in this report are generated using Mordor Intelligence’s proprietary estimation framework, updated with the latest available data and insights as of January 2026.
United Arab Emirates E-Commerce Market Trends and Insights
Drivers Impact Analysis
| Driver | (~) % Impact on CAGR Forecast | Geographic Relevance | Impact Timeline |
|---|---|---|---|
| Mandatory Federal UAE Pass Digital Identity Accelerating Shopper On-Boarding | +2.1% | National, peaks in Dubai and Abu Dhabi | Short term (≤ 2 years) |
| Social-Commerce Momentum via TikTok Shop and Instagram Checkout | +1.9% | National, strongest in urban Gen Z and millennial cohorts | Short term (≤ 2 years) |
| Rapid Uptake of Mobile Wallets Improving Checkout Conversion | +1.8% | National, led by Dubai, Abu Dhabi, Sharjah | Medium term (2-4 years) |
| Nationwide Instant Payment Platform (Aani) Reducing Cash-On-Delivery Reliance | +1.7% | National, early gains in Dubai, Abu Dhabi, Sharjah | Medium term (2-4 years) |
| Adoption of Foreign-Ownership Reforms Lowering Barriers for Global E-Tailers | +1.5% | National free zones and major emirates | Medium term (2-4 years) |
| High Disposable Income Fueling Luxury Online Purchases | +1.3% | Dubai and Abu Dhabi with Sharjah spillover | Long term (≥ 4 years) |
| Source: Mordor Intelligence | |||
Understand The Key Trends Shaping This Market
Download PDF
Mandatory Federal “UAE Pass” Digital Identity Accelerating Shopper On-Boarding
UAE Pass surpassed 11 million users by early 2025 and processed 2.6 billion transactions across 322 public and private services, embedding single sign-on at checkout and lifting first-time conversion as much as 40%.[1]UAE Pass, “UAE Pass Statistics and Adoption,” UAEPASS.AE Cart abandonment among Gen Z drops sharply when registration drops below three steps, and federal regulators compel integration for all government-facing platforms, pushing private retailers to follow suit. Age verification for restricted goods, fraud mitigation via verified credentials, and reduced chargebacks, historically 1.2-1.8% of GMV, combine to make identity a revenue driver rather than a compliance box. The familiar login reduces friction on mobile, where 78.67% of 2025 transactions originated, reinforcing the UAE e-commerce market’s mobile-first bias. As platforms widen biometric authentication before the March 2026 SMS OTP sunset, adoption will surge in Sharjah and Ajman, where smartphone penetration lags Dubai by only eight percentage points.
Social-Commerce Momentum via TikTok Shop and Instagram Checkout
Checkout.com’s 2024 survey found 96% of UAE respondents expect to transact inside social apps by 2030, and 86% had already done so.[2]Checkout.com, “UAE E-Commerce Payment Trends Report 2024,” CHECKOUT.COM TikTok’s algorithm surfaces product videos to 77% of Middle East and North Africa users, while Instagram Checkout collapses discovery and payment into one scroll. Direct-to-consumer brands exploit viral reach to cut paid-search costs, posting return-on-ad-spend multiples three to five times greater than keyword campaigns. Noon and Namshi have embedded shoppable video, keeping users inside proprietary apps and capturing impulse buys before shoppers migrate to external feeds. Content-led merchandising shortens the path to purchase but also spikes demand volatility, forcing warehouses to adopt predictive analytics and dynamic slotting for trending SKUs. The behavior shift rewards agile assortments and penalizes legacy catalogers, reshaping the United Arab Emirates e-commerce market as content and commerce converge.
Rapid Uptake of Mobile Wallets Improving Checkout Conversion
Digital wallets held 43.92% of payments in 2025 as e and money leveraged Etisalat’s 13 million subscribers and PayIt secured 15 000 merchant integrations. The Central Bank directed the retirement of SMS-based OTPs by March 2026, catalyzing biometric sign-in that mobile apps already support. Checkout.com data shows cash-on-delivery volumes fell 37% over four years, and 74% of users say they would default to card or wallet if COD vanished. Micro-installments under AED 500 (USD 136) on e and money capture impulse fashion and electronics purchases, raising average order frequency 20-25% year on year. Wallets also deliver richer data streams, location tokens, SKU-level spend, empowering retailers to personalize offers in real time. Combined, faster authentication and granular data accelerate sales conversion across the United Arab Emirates e-commerce market, even as payment method diversity grows.
Nationwide Instant Payment Platform (Aani) Reducing Cash-On-Delivery Reliance
Launched in 2023, Aani reached 1.4 million users by March 2025, clearing more than 500 000 daily transactions in under 10 seconds with month-on-month growth of 27%.[3]Central Bank of the UAE, “Aani Instant Payment Platform User Statistics,” CENTRALBANK.AE Pre-payment reduces customer refusal rates by 12-15 percentage points, enabling merchants to release inventory immediately and cut working-capital cycles. Cash-on-delivery once accounted for 50-60% of UAE e-commerce orders, inflating reverse-logistics expense and tying carriers to paper workflows. Zero merchant discount rates on sub-AED 100 transactions, covering 40% of grocery baskets, incentivize quick-commerce operators to push prepaid orders. By embedding QR checkout inside UAE Pass, banks remove the need for card numbers altogether, reinforcing a virtuous loop of speed, security, and loyalty in the UAE e-commerce market.
Restraints Impact Analysis
| Restraint | (~) % Impact on CAGR Forecast | Geographic Relevance | Impact Timeline |
|---|---|---|---|
| High Last-Mile Costs in Non-Addressable Areas | -1.4% | Northern emirates and remote zones | Long term (≥ 4 years) |
| Margin Pressure from Quick-Commerce Price Wars | -1.2% | Dubai, Abu Dhabi, Sharjah with spillover regions | Short term (≤ 2 years) |
| Compliance Costs under UAE Personal Data Protection Law 2022 | -0.9% | National, heavier on mid-to-large platforms | Medium term (2-4 years) |
| Customer Trust Issues with Counterfeit Goods on Cross-Border Platforms | -1.1% | National cross-border shopper base | Medium term (2-4 years) |
| Source: Mordor Intelligence | |||
Adoption of Foreign-Ownership Reforms Lowering Barriers for Global E-Tailers
Delivery in Fujairah, Ras Al Khaimah, and Umm Al Quwain costs AED 35-50 (USD 9.50-13.60) per parcel, double Dubai’s AED 15-25, and absorbs 28-53% of platform logistics budgets.[4]UAE Federal Transport Authority, “Last-Mile Infrastructure Proposal,” FTA.GOV.AE Sparse populations and limited addressing force carriers to batch shipments into two- or three-day routes, diluting the value proposition for perishables and pharmaceuticals. Operators that subsidize rural deliveries surrender eight to 12 margin points, while those that enforce higher minimums cede market share to brick-and-mortar. The Federal Transport Authority proposes shared lockers and hub-and-spoke consolidation beyond 2027, but near-term profitability hinges on adaptive routing, crowd-sourced drivers, and pick-up nodes at petrol stations. Persistent cost friction drags UAE e-commerce market CAGR, particularly in northern emirates where growth potential remains under-monetized.
High Disposable Income Fueling Luxury Online Purchases
Talabat’s USD 32 million Instashop acquisition in March 2025 sparked aggressive discounting from Noon Minutes and Careem Now, slicing average order values by 15-20%. Each micro-fulfillment hub costs AED 2-5 million (USD 545,000-1.36 million) and needs 200-300 daily orders to break even, yet venture-funded platforms chase share before consolidation. Instashop’s 2024 GMV hit USD 631 million, up 16%, but operating losses widened as subsidies funded 15-minute guarantees. The parallel with ride-hailing’s mid-2010s cash-burn phase raises investor concern, especially as rising interest rates lift capital costs. Until rational pricing returns, margin erosion will restrain overall UAE e-commerce market profitability even while topline revenue grows.
Segment Analysis
By Business Model: B2B Channels Outpacing Consumer Growth
Business-to-consumer transactions generated 67.89% of 2025 value, anchoring the United Arab Emirates e-commerce market, yet business-to-business platforms are projected to post the highest 17.43% CAGR through 2031. Tradeling handled 200 000 monthly deals and exceeded USD 1 billion in annualized GMV after closing a USD 100 million Series B in July 2024. B2B portals compress procurement cycles from weeks to hours, bundling credit, freight, and e-invoicing in a single interface. Enterprises switching from emailed purchase orders report 30-50% process cost savings, a compelling narrative amid sustainability audits and Scope 3 reporting demands. As B2B marketplaces embed SKU-level carbon disclosures, corporate buyers optimize both price and environmental footprint. E-invoicing mandates phased in since 2024 add urgency, nudging even small suppliers to digitize.
The UAE e-commerce market share advantage currently favors B2C, but C2C listings, led by Dubizzle’s 16 million monthly visits, highlight secondary-goods liquidity rather than net new GDP. B2C margins compress as Amazon.ae and Noon trade free shipping thresholds and same-day promises, whereas B2B enjoys negotiated pricing and larger basket sizes. Tradeling’s ERP integrations with SAP and Oracle simplify reconciliation, removing a perennial adoption barrier. New entrants focusing on vertical niches, construction materials, hotel supplies, signal white-space still untapped. Over the forecast window, the UAE e-commerce market size attributed to B2B may double its 2026 base if regulatory catalysts, notably phased e-invoicing and green-procurement targets, hold.
Get Detailed Market Forecasts at the Most Granular Levels
Download PDF
By Device Type: Smartphone Dominance Reinforced by Biometric Authentication
Smartphones processed 78.67% of 2025 orders and are projected to expand at 16.24% CAGR, the quickest rate among devices. The Central Bank’s March 2026 ban on SMS OTPs pivots authentication to fingerprint and facial recognition, raising mobile checkout speed by 30-40% against desktop. UAE carriers Etisalat and du count 22 million combined subscribers, and both zero-rate data for partner shopping apps. 5 G coverage touches 95% of residents, lowering latency below 20 ms and enabling high-definition product video and AR try-ons. As a result, the UAE e-commerce market sees repeat mobile purchase frequency climb 20-25% year on year.
Desktop and laptop retain relevance for enterprise and bulk buyers needing multi-tab comparison, yet their growth trails the overall market. Voice assistants and smart TVs remain emergent but gain mindshare as Amazon Alexa and Google Assistant sync purchase histories. The United Arab Emirates e-commerce market size tied to smartphone channels is expected to eclipse USD 15 billion by 2031, underpinned by app-exclusive flash sales and location-based push alerts. Retailers experimenting with chat-based interfaces inside UAE Pass anticipate even higher engagement, linking identity, loyalty, and payments in one tap. Meanwhile, platform optimization for foldable screens, predicted to reach 1 million users locally by 2027, promises richer browsing without desktop trade-offs.
By Payment Method: BNPL Surging as Tabby and Tamara Scale
Digital wallets dominated 43.92% of 2025 transaction value, yet BNPL is poised for the fastest 13.27% CAGR to 2031. Tabby completed a USD 160 million Series E at a USD 3.3 billion valuation in February 2025 and, together with Tamara, now covers 40 million GCC consumers.[5]Tabby, “Series E Funding Announcement,” TABBY.AI Both firms processed USD 6 billion in annualized UAE volume across 30 000 merchants, with virtual cards widening acceptance beyond direct integrations. Minimum order thresholds rose to AED 300 to curb micro-fraud, steering BNPL toward electronics, furniture, and luxury fashion.
Credit and debit cards benefit from 120% penetration but face decelerating growth as Gen Z bypasses legacy banking in favor of embedded finance. Aani’s instant settlement further eats into bank transfers, a method traditionally favored for high-ticket items. The UAE e-commerce market size captured by BNPL could surpass USD 4 billion by 2031 if current user-acquisition velocity holds. Default-rate analytics, powered by the USD 5 billion AWS cloud build-out, improve underwriting accuracy and protect margins even as volumes scale.[6]Amazon Web Services, “UAE Cloud Infrastructure Investment,” AWS.AMAZON The interplay between wallet cash-backs, BNPL ease, and biometric security will shape payment arithmetic, forcing merchants to juggle MDR fees against uplift in basket size.
Note: Segment shares of all individual segments available upon report purchase
Get Detailed Market Forecasts at the Most Granular Levels
Download PDF
By B2C Product Category: Food and Beverages Accelerating on Quick-Commerce Infrastructure
Fashion led 2025 category share at 21.59%, anchored by Namshi’s 2 million actives and Shein’s global funnel, yet food and beverages are projected to register a 13.16% CAGR, the highest among segments. Talabat’s Instashop integration funnels 15-minute grocery into an app already ubiquitous for restaurant delivery, driving cross-sell synergies. Carrefour UAE and Lulu Webstore provide same-day delivery on 25 000 SKUs, normalizing weekly online grocery routines. Pull-forward of pantry staples into e-channels pivots average order frequency upward and stabilizes recurring revenue.
Consumer electronics enjoy high average order values and low return rates, but bulky furniture wrestles with assembly and reverse-logistics frictions. Beauty and personal care leverages social-commerce tutorials, pulling SKU discovery onto TikTok streams. Toys, DIY, and media trail overall UAE e-commerce market growth, partially offset by niche communities. The quick-commerce footprint, dark stores within 3 km of 80% of Dubai’s population, fortifies food and beverages, making perishables a defensible moat against cross-border entrants. With Instashop’s 2024 GMV at USD 631 million, doubling by 2028 appears feasible as micro-fulfillment densifies.
Geography Analysis
Dubai claimed roughly 60% of the United Arab Emirates e-commerce market in 2025, buoyed by 90% internet penetration across 3.6 million residents and more than 100 fulfillment centers spanning Dubai CommerCity to Al Quoz. The emirate’s free-zone incentives, 100% foreign ownership, zero corporate tax for 50 years, and rapid customs clearance, attract global names such as Shein and AliExpress, even as counterfeit seizures erode cross-border trust. Per-order delivery costs of AED 15-25 empower platforms to waive shipping above modest thresholds, an advantage remote emirates cannot replicate. E-commerce contributed 12% of Dubai’s non-oil GDP in 2024, reinforcing its central role in diversification.
Abu Dhabi, home to 1.5 million people and a GDP per-capita topping USD 70 000, is closing the gap through mandatory UAE Pass integration across public services by 2026. Luxury sites such as Ounass report average order values of USD 550 and 89-minute delivery windows inside the capital, demonstrating consumer appetite for premium speed. Government grants to logistics startups and land concessions in Khalifa Industrial Zone lure fulfillment investment that radiates outward to Al Ain and the Western Region.
Sharjah leverages adjacency to Dubai logistics yet contends with lower disposable income and a sizable blue-collar base. Industrial clusters along Emirates Road now host cost-efficient warehouses, enabling operators to serve northern emirates within two hours. Fujairah, Ras Al Khaimah, Ajman, and Umm Al Quwain together generate under 15% of UAE e-commerce volume, restrained by AED 35-50 delivery fees and two-day lead times. The Federal Transport Authority’s shared locker initiative could compress cost curves post-2027, but until then, profitability hinges on batching and dynamic routing. Budget housing expansion in Ajman is attracting micro-fulfillment hubs serving Dubai and Sharjah, an employment boon that does little to spike local demand but trims intra-emirate transfer times.
Competitive Landscape
The United Arab Emirates e-commerce market is moderately concentrated, with Amazon.ae, Noon, and Carrefour UAE jointly controlling 45-50% of GMV. Amazon Web Services’ USD 5 billion cloud investment aims to halve latency for AI recommender engines by 2026, tightening its flywheel. Noon crossed 40 million registered users, operates more than 100 regional fulfillment centers, and embeds AR try-ons that lower fashion return rates. Carrefour UAE’s automated micro-fulfillment cuts pick time 60%, giving Majid Al Futtaim leverage to scale same-day grocery.
Talabat’s USD 32 million Instashop deal consolidates quick-commerce under Delivery Hero, prompting Noon Minutes and Careem Now to match 15-minute promises at mounting subsidy costs. Tradeling’s USD 100 million raise validates B2B white-space, though global players such as Amazon Business and Alibaba.com have yet to localize Arabic interfaces or adaptive payment terms. Social-commerce, with 96% of consumers expecting in-app checkout, is the next battleground; local apps integrate shoppable video to stem user migration to TikTok Shop and Instagram Checkout.
Regulatory compliance introduces a scale moat. The 2022 Personal Data Protection Law imposes AED 10 million fines and 72-hour breach notifications. Mid-tier operators spend AED 500 000-2 million annually on data localization and audits, costs easier to absorb at Amazon scale than for niche sellers. Counterfeit seizures worth AED 1.2 billion in 2024 dent Shein and AliExpress credibility, with 65% of shoppers now preferring local sites for authenticity. As competitive levers shift from assortment breadth to speed, trust, and compliance readiness, the UAE e-commerce market rewards platforms that can align all three.
United Arab Emirates E-Commerce Industry Leaders
Noon AD Holdings Ltd
Sharaf DG LLC.
LetsTango.Com
Amazon Inc. (Amazon.ae)
Namshi General Trading LLC
- *Disclaimer: Major Players sorted in no particular order

Need More Details on Market Players and Competitors?
Download PDF
Recent Industry Developments
- January 2026: Noon activated 20 additional dark stores across Dubai and Abu Dhabi, raising real-time inventory coverage to 85% of urban households and shrinking average delivery windows to 12 minutes.
- December 2025: Amazon.ae began same-day export shipping to Riyadh and Manama via Dubai South hub, slicing cross-border lead times by 60% and opening GCC-wide fulfillment from a single UAE base.
- March 2025: Talabat, a Delivery Hero unit, acquired Instashop for USD 32 million, integrating Instashop’s quick-commerce infrastructure into Talabat Mart.
- March 2025: Tabby integrated with Checkout.com, enabling 15 000 additional UAE merchants to offer BNPL at checkout.
Research Methodology Framework and Report Scope
Market Definitions and Key Coverage
Our study defines the United Arab Emirates e-commerce market as the total value of goods and services ordered via internet-enabled channels (web or app) by individual consumers and businesses, covering B2C, B2B, and C2C transactions across categories such as fashion, consumer electronics, grocery, beauty, furniture, and niche hobby goods. Revenues are booked at checkout in United States dollars before delivery fees and taxes, matching UAE on-the-ground settlement practices.
Scope exclusion: purely digital content subscriptions, online travel bookings, ride-hailing fares, and business process outsourcing services sit outside this estimate.
Segmentation Overview
- By Business Model
- B2C
- B2B
- By Device Type
- Smartphone / Mobile
- Desktop and Laptop
- Other Device Types
- By Payment Method
- Credit / Debit Cards
- Digital Wallets
- BNPL
- Other Payment Methods
- By B2C Product Category
- Beauty and Personal Care
- Consumer Electronics
- Fashion and Apparel
- Food and Beverages
- Furniture and Home
- Toys, DIY and Media
- Other Product Categories
- By Emirate
- Dubai
- Abu Dhabi
- Sharjah
- Rest of Emirates
Detailed Research Methodology and Data Validation
Primary Research
Mordor analysts completed structured interviews and short surveys with online retailers, 3PL executives, digital-payment firms, and regulators across Dubai, Abu Dhabi, and Sharjah. These discussions clarified take-rates, cross-border share, and emergent payment habits, allowing us to validate secondary signals and adjust assumptions on shopper cohorts and average basket sizes.
Desk Research
We gathered foundational signals from tier-1 public sources such as the International Trade Administration, Dubai Chamber of Digital Economy, UAE Central Bank payment bulletins, Telecommunications and Digital Government Authority statistics, and trade association datasets that track courier volumes and card usage. Supplementary insight flowed from corporate filings, investor presentations, and reputable local press, which we stream into Dow Jones Factiva and D&B Hoovers for rapid screening. To gauge category-level momentum, customs shipment records and Questel patent counts around last-mile tech were also reviewed. This list is illustrative; many additional references informed our evidence bank.
Market-Sizing & Forecasting
A top-down demand pool model starts with UAE retail sales and household expenditure, isolates the online penetration of each product class, and is then cross-checked through sampled merchant gross merchandise value and selected logistics roll-ups. Key variables include internet user base, percentage of mobile checkouts, average order value, card-to-wallet split, delivery success rates, and VAT-adjusted pricing trends, all of which are trended back five years to ensure continuity. Multivariate regression captures how shifts in disposable income, smartphone penetration, and digital-wallet adoption interact to influence online conversion, while scenario analysis buffers for policy or infrastructure shocks. Gaps in bottom-up data are bridged with conservative interpolation using verified ratios from peer segments.
Data Validation & Update Cycle
Outputs face anomaly checks versus payment switch totals, customs records, and listed e-tailer disclosures. Senior analysts review every variance before sign-off. We refresh the model annually and trigger interim updates when material events, regulatory, macroeconomic, or technological, move the market; a final sense-check is run just before publication.
Why Mordor's UAE E-Commerce Baseline Stands Up to Scrutiny
Published figures often diverge because each firm selects different scopes, applies unique inflation or currency treatments, and refreshes at varied cadences.
Key gap drivers here include whether business-only procurement is folded in, how cross-border GMV is allocated, and the rigor of primary validations around basket value and returns.
Benchmark comparison
| Market Size | Anonymized source | Primary gap driver |
|---|---|---|
| USD 11.05 B (2025) | Mordor Intelligence | - |
| USD 79.94 B (2024) | Regional Consultancy A | Bundles wholesale B2B trade and overseas GMV, limited UAE-specific verification |
| USD 125.0 B (2024) | Industry Analysis Firm B | Applies gross MENA total then attributes full value to UAE, with no merchant-level cross-check |
The comparison shows that when scope creep or untested allocations slip in, estimates balloon. By anchoring estimates to clearly defined variables and double-confirming them with field insight, Mordor Intelligence delivers a balanced, transparent baseline decision-makers can rely on.
Need A Different Region or Segment?
Customize Now
Key Questions Answered in the Report
How big is the UAE e-commerce market in 2026 and what growth is expected by 2031?
The market reached USD 12.30 billion in 2026 and is forecast to hit USD 21.01 billion by 2031, reflecting an 11.29% CAGR.
Which device type generates the most online sales in the Emirates?
Smartphones led with 78.67% of 2025 transaction volume and are projected to grow at a 16.24% CAGR through 2031, far ahead of desktop.
Why is BNPL growing faster than cards and wallets in the Emirates?
Tabby and Tamara expanded acceptance to tens of thousands of merchants, raised large funding rounds, and offer installment flexibility, driving a 13.27% CAGR forecast to 2031.
What challenges limit e-commerce reach beyond Dubai and Abu Dhabi?
High last-mile costs of AED 35-50 per parcel and two-day delivery windows in northern emirates dampen margins and consumer adoption.
Which product category is likely to grow the fastest by 2031?
Food and beverages are projected to expand at a 13.16% CAGR as quick-commerce networks scale 15-minute grocery fulfillment across major cities.
How is the UAE government influencing online retail growth?
Policies such as mandatory UAE Pass identity, foreign-ownership reforms, and instant-payment rails lower entry barriers, speed checkout, and attract foreign investment.


