
Unified Threat Management Market Size and Share
Market Overview
| Study Period | 2020 - 2031 |
|---|---|
| Market Size (2026) | USD 10.56 Billion |
| Market Size (2031) | USD 19.75 Billion |
| Growth Rate (2026 - 2031) | 13.34% CAGR |
| Fastest Growing Market | Asia-Pacific |
| Largest Market | North America |
| Market Concentration | Medium |
Major Players *Disclaimer: Major Players sorted in no particular order Image © Mordor Intelligence. Reuse requires attribution under CC BY 4.0. | |
Unified Threat Management Market Analysis by Mordor Intelligence
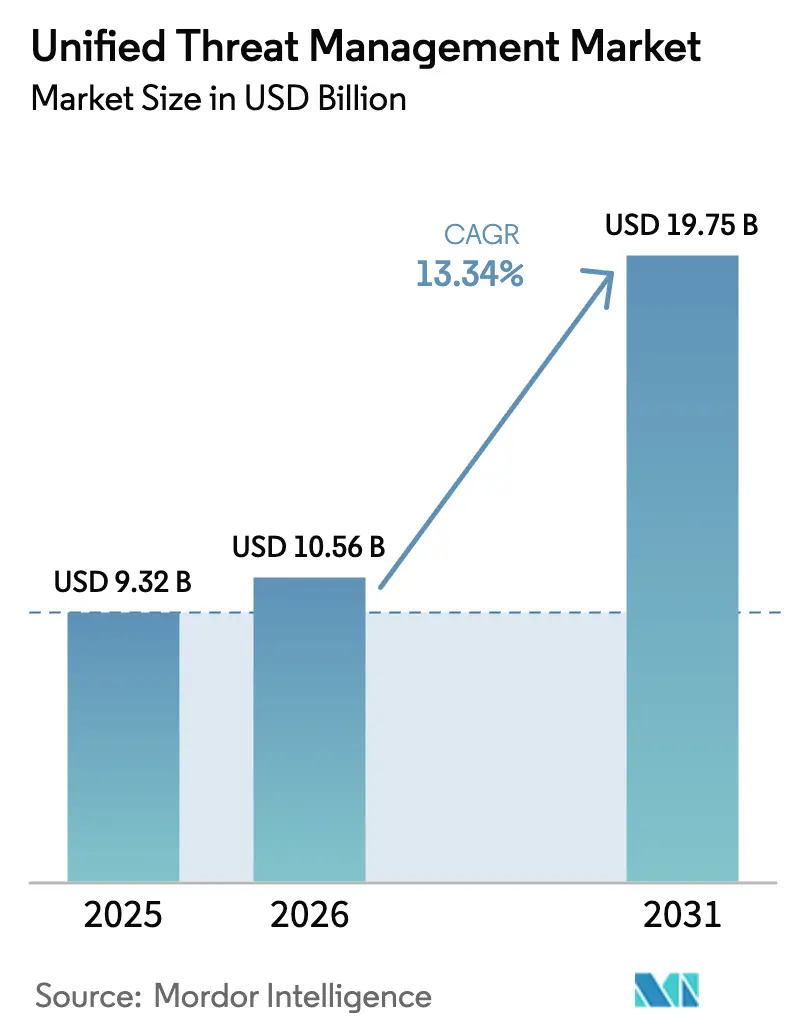
The Unified Threat Management market size was valued at USD 9.32 billion in 2025 and estimated to grow from USD 10.56 billion in 2026 to reach USD 19.75 billion by 2031, at a CAGR of 13.34% during the forecast period (2026-2031). This expansion reflects how enterprises are retiring siloed appliances in favor of cloud-delivered and software-defined protection that adapts to remote work and edge computing. Software components lead adoption because updates arrive instantly without hardware swaps, while cloud deployments remove the throughput constraints that once hampered fully enabled appliances. Large enterprises sustain spending power, yet the accelerating demand from small and medium businesses signals wider democratization of advanced security. Geographically, North America supplies the core revenue base, but Asia-Pacific is moving faster on the back of data-sovereignty laws, manufacturing digitalization, and new maritime cybersecurity rules.
Key Report Takeaways
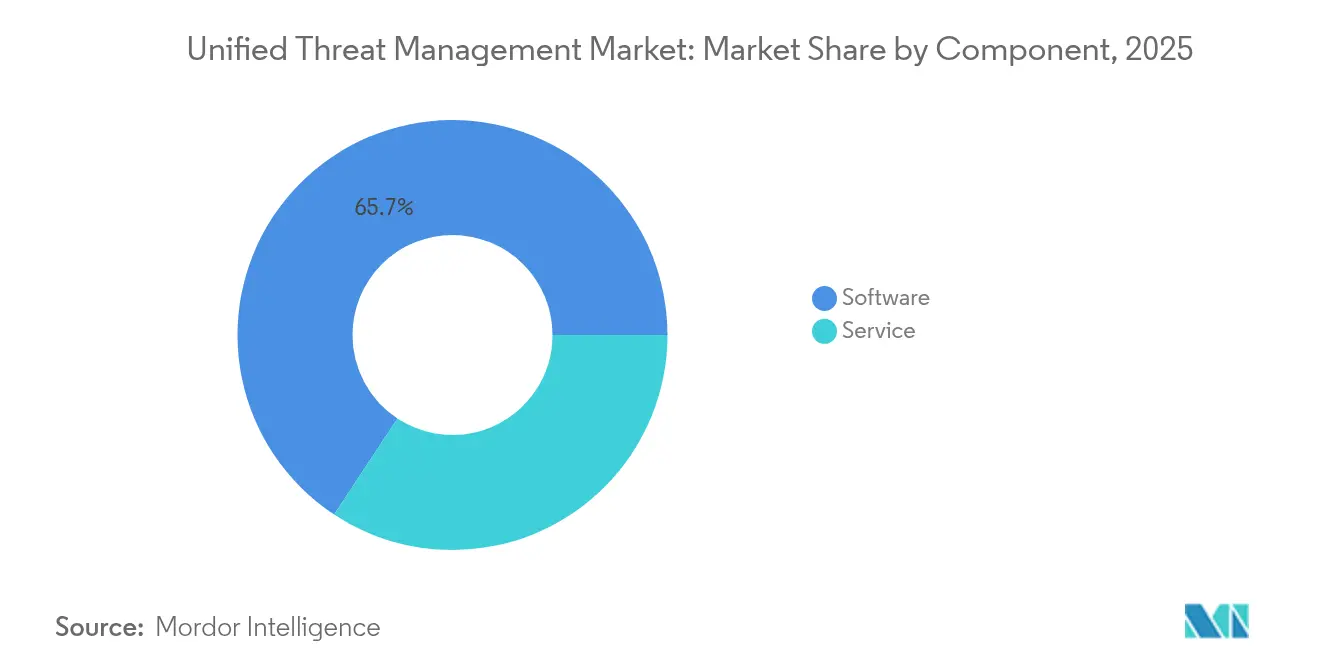
- By component, software captured 65.72% of Unified Threat Management market share in 2025.
- By deployment model, cloud held 57.65% of the Unified Threat Management market size in 2025 and is set to expand at a 13.92% CAGR to 2031.
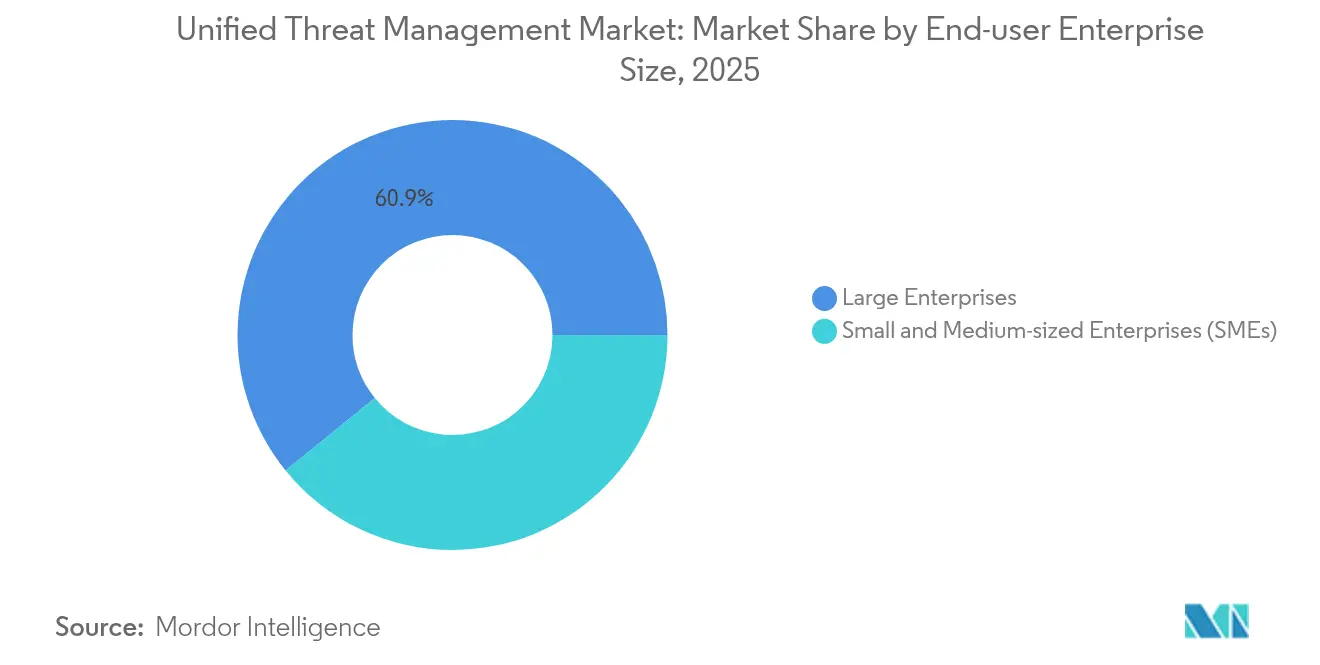
- By organization size, small and medium enterprises are advancing at a 14.48% CAGR through 2031, while large enterprises retained 60.85% revenue share in 2025.
- By end-user industry, financial services led with 24.21% revenue share in 2025; IT and telecommunications is projected to grow at a 14.55% CAGR to 2031.
- By geography, North America accounted for 36.62% of revenue in 2025, whereas Asia-Pacific is forecast to grow at an 18.14% CAGR to 2031.
Note: Market size and forecast figures in this report are generated using Mordor Intelligence’s proprietary estimation framework, updated with the latest available data and insights as of 2026.
Global Unified Threat Management Market Trends and Insights
Drivers Impact Analysis*
| Driver | (~) % Impact on CAGR Forecast | Geographic Relevance | Impact Timeline |
|---|---|---|---|
| Rapid SMB adoption of cost-effective integrated security appliances | +2.1% | Global with concentration in North America and Asia-Pacific | Short term (≤ 2 years) |
| Convergence with SD-WAN / SASE architectures | +2.8% | North America and EU leading, Asia-Pacific following | Medium term (2-4 years) |
| Surge in AI-driven polymorphic malware and need for unified analytics | +2.4% | Global | Short term (≤ 2 years) |
| Regulatory push for consolidated audit trails | +1.9% | EU and Asia-Pacific core with spill-over to Americas | Medium term (2-4 years) |
| Edge-cloud proliferation in Industry 4.0 networks | +1.7% | Asia-Pacific core, North America and EU manufacturing hubs | Long term (≥ 4 years) |
| Maritime and fleet-secure mandates creating niche UTM demand | +0.8% | Global maritime routes concentrated in Singapore, Rotterdam, Long Beach | Medium term (2-4 years) |
| Source: Mordor Intelligence | |||
Rapid SMB adoption of cost-effective integrated security appliances
Small and medium businesses increasingly pivot toward UTM boxes because separate firewalls, intrusion prevention, and content filters strain limited budgets and staff. Forty-three percent of SMBs faced attacks in 2024, yet many run with lean IT teams. An all-in-one unit trims capital outlay and day-to-day management while still meeting regulatory basics. Managed service providers now bundle UTM devices into fixed-price packages, doubling recurring revenue in some cases. Vendors that package enterprise-grade controls in simplified appliances are capturing loyalty in a price-sensitive segment.[1]American Bureau of Shipping, “Cybersecurity Requirements for Machinery and Control Systems,” eagle.org
Convergence with SD-WAN / SASE architectures
Networking and security teams want a single control pane that steers traffic and inspects it at once. Cisco has blended Catalyst SD-WAN with Microsoft Security Service Edge so users gain policy-based routing plus threat prevention on the same cloud edge.[2]Cisco Systems, “Catalyst SD-WAN and Microsoft SSE Integration,” cisco.com Seventy-nine percent of enterprises surveyed intend to fold web, cloud service, and private-app access under converged SASE by 2025, forcing legacy UTM suppliers to extend beyond appliance footprints. Fortinet’s Unified SASE annual recurring revenue rose 25.7% to USD 1.15 billion in 2025, underscoring momentum toward integrated cloud delivery Fortinet.[3]Fortinet, “2025 Investor Presentation,” fortinet.com
Surge in AI-driven polymorphic malware and need for unified analytics
Threat actors now automate code mutation to sidestep signature detection. Unified platforms that ingest firewall logs, intrusion alerts, and user behavior in one stream can apply machine-learning models for faster correlation. Palo Alto Networks added real-time controls for generative AI app usage inside its Prisma stack in 2025.[4]Palo Alto Networks, “Prisma SASE Enhancements,” paloaltonetworks.com Check Point shipped six AI-powered functions within Infinity to counter evasive threats. Organizations conclude that piecemeal tools cannot pivot quickly enough, increasing enterprise adoption of adaptive security alongside unified threat management platforms.
Regulatory push for consolidated audit trails
NIS2 in the EU, Singapore’s strengthened Cybersecurity Act, and incoming US Coast Guard rules all raise the bar for log retention and incident reporting. UTM platforms automate collection from multiple engines and generate standardized reports, cutting compliance labor. Ship operators moving cargo through European and US ports must store cybersecurity event logs beginning July 2025, steering vessel owners toward purpose-built maritime UTM appliances. Vendors able to certify out-of-the-box audit functions gain an edge with regulated sectors.
Restraints Impact Analysis*
| Restraint | (~) % Impact on CAGR Forecast | Geographic Relevance | Impact Timeline |
|---|---|---|---|
| Performance bottlenecks when all services enabled | -2.3% | Global, especially high-bandwidth sites | Short term (≤ 2 years) |
| Migration to cloud-native SSE reducing on-prem UTM refresh cycles | -1.8% | North America and EU leading, Asia-Pacific following | Medium term (2-4 years) |
| Channel conflict between direct vendors and VAR ecosystems | -1.2% | Global | Short term (≤ 2 years) |
| Skills shortage to fine-tune multi-function policies | -0.9% | Global, acute in North America and EU | Long term (≥ 4 years) |
| Source: Mordor Intelligence | |||
Performance bottlenecks when all services enabled
Hardware UTM boxes often throttle throughput once intrusion prevention, SSL inspection, and sandboxing are switched on. Lab tests show some devices losing 20-30% of rated speed when every feature is active. For example, an 850 Mbps gateway can dip to 600 Mbps after deep-packet inspection is engaged. High-bandwidth enterprises then weigh speed against full protection and sometimes offload inspection tasks to cloud proxies, curbing appliance upgrades.
Migration to cloud-native SSE reducing on-prem UTM refresh cycles
Security Service Edge platforms deliver firewall-as-a-service, secure web gateway, and zero trust access from distributed cloud points. Enterprises that adopt SSE no longer replace rack-mounted UTMs every five years; they renew software subscriptions instead. Deakin University reports faster response times since moving inspection to the cloud, illustrating how hardware sales shrink for traditional vendors while recurring revenue models expand
*Our forecasts treat driver/restraint impacts as directional, not additive. The impact forecasts reflect baseline growth, mix effects, and variable interactions.
Segment Analysis
By Component: Software Dominance Accelerates Platform Shift
Software captured 65.72% of 2025 revenue, and this slice is climbing at 14.93% CAGR. The Unified Threat Management market size for software reached USD 6.13 billion in 2025 and is forecast to double by 2031. Organizations prefer downloadable images or virtual appliances that spin up in minutes across data centers and edge nodes. Continuous patching guards against zero-day exploits without a truck-roll. Services remain the minority today, yet managed detection and response revenues are outpacing product sales as skills shortages worsen, increasing demand for threat intelligence security services. Vendors bundle onboarding, policy optimization, and 24 × 7 monitoring to lock in sticky, subscription-based income. Professional services teams also guide compliance mapping, especially for NIS2 and maritime mandates. The Unified Threat Management market continues to reward suppliers that anchor innovations in software while layering optional service wrap-arounds, assuring buyers of both agility and expertise.
A second wave of innovation is pushing software-defined engines into container form factors that auto-scale with application demand. Check Point’s Infinity architecture now spans on-premise, cloud, and branch edges through a single code base, lowering total cost of ownership because IT staff manage one console. The approach aligns with broader enterprise preference for platform unification rather than separate point products. In effect, the software surge redefines the benchmark for integrated security, setting expectations for one-click deployment, frictionless upgrades, and synchronized analytics. Such dynamics keep the Unified Threat Management market vibrant as subscription economics supplant box resell margins.


By Deployment Mode: Cloud Adoption Reshapes Security Architecture
Cloud models accounted for 57.65% of 2025 shipments on revenue terms and are tracking a 13.92% CAGR through 2031. Enterprises cite lower latency to SaaS destinations, infinite scalability, and simplified global policy enforcement as key motivations. The Unified Threat Management market share for on-premise appliances is slipping where bandwidth demands exceed embedded CPU limits. Still, air-gapped utilities and defense sites continue to favor local inspection. Hybrid designs therefore proliferate. Policies reside in the cloud, yet enforcement points can be virtual or physical, depending on compliance needs.
Cloud adoption also mitigates the earlier restraint of performance degradation. Inspection takes place in massive data centers engineered for multi-core processing. Organizations such as Marine Credit Union report smoother user experiences after migrating to secure web gateways that sit closer to productivity workloads. Vendors that originated in hardware now offer identical rule sets in cloud nodes to preserve policy continuity. Over time, billing flips from capital expenditure to operational expenditure, reinforcing predictable revenue streams for suppliers and lowering entry thresholds for buyers. These factors feed the forward momentum of the Unified Threat Management market.
By Organization Size: SME Growth Drives Market Expansion
Large enterprises held 60.85% of 2025 turnover, yet the small and medium enterprise segment is increasing at 14.48% CAGR, more than a full percentage point above the overall Unified Threat Management market. Cybercriminals view SMEs as soft targets, prompting boards to approve security upgrades despite tight cash flow. A single console that governs firewall, intrusion prevention, and web filtering minimizes staffing headaches. Channel partners capitalize by selling UTM-as-a-service bundles with flat monthly fees.
Managed service providers leverage repeatable UTM deployments to scale profitably without adding headcount. WatchGuard exemplifies the playbook, arming partners with centralized dashboards that handle thousands of tenant instances. As SMBs modernize networks for hybrid work, they often skip legacy point solutions and adopt unified platforms from day one. This greenfield demand boosts license volumes and encourages vendors to build tiered offerings that balance price and feature depth. The Unified Threat Management market thus benefits from dual-engine growth: entrenched renewal cycles in large accounts and first-time adoption in smaller firms.
By End-User Industry: Financial Services Lead, Technology Accelerates
Financial institutions commanded 24.21% revenue share in 2025 because regulators scrutinize transaction integrity and audit capabilities. Integrated logging streamlines proofs of compliance across firewalls, IPS, and antivirus, making UTM the default perimeter for branches and data centers. Insurers and asset managers likewise centralize controls to lower mean time to detect attacks.
Information technology and telecommunications providers show the quickest uptake, advancing at a 14.55% CAGR. Cloud hosting firms embed virtual UTM instances within multi-tenant overlays to shield customer workloads, while telecom carriers fold UTM engines into managed SD-WAN packages. Healthcare also intensifies spending after ransomware incidents locked access to records for 14 million patients in 2024. Manufacturers invoke unified inspection to safeguard industrial control systems, especially as Industry 4.0 links factory sensors to corporate networks. Across sectors, the market is buoyed by common requirements for simplified oversight, demonstrable compliance, and cost control.
Geography Analysis
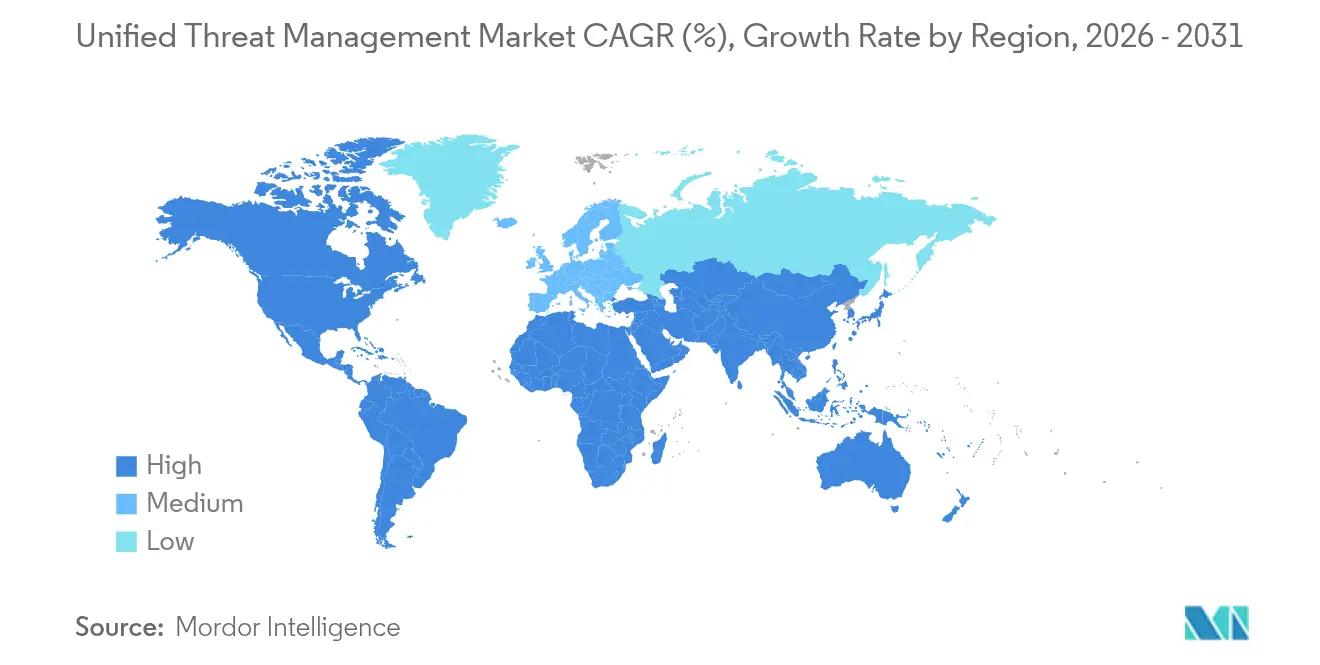
North America generated 36.62% of 2025 revenue, driven by mature cyber insurance mandates and early adoption of integrated platforms. Federal rules compel shipping companies to install documented controls by July 2025, keeping demand steady for maritime-ready appliances. Canada’s critical infrastructure guidelines similarly favor centralized log management. Stable budgets and dense partner networks continue to underpin upgrades and subscription renewals.
Asia-Pacific is the growth engine, posting an 18.14% CAGR through 2031. Singapore extends the Cybersecurity Act to overseas systems, pushing multinational headquarters to adopt unified logging before fines begin. India’s Digital Personal Data Protection Act requires breach alerts within strict timelines, encouraging businesses to pick turnkey UTM bundles that handle incident reporting automatically. Japanese and South Korean manufacturers deploy UTM to watch industrial robots as they push for smart-factory productivity. The cumulative effect propels the Unified Threat Management market across the region.
Europe records steady expansion as NIS2 broadens incident-reporting duties for energy, transport, and digital-services operators. Ports in Rotterdam and Hamburg now require vessels to certify UTM deployment that aligns with IACS UR E26/E27 standards from July 2024. Organizations subject to DORA in financial services invest in unified controls that feed real-time dashboards to supervisors. Although the continent favors privacy and open standards, the complexity of overlapping regulations reinforces the appeal of single-pane solutions.

Regulatory Landscape
Unified threat management (UTM) buying criteria are increasingly shaped by cybersecurity control frameworks and government assurance programs that emphasize auditability, cryptographic validation, and supply chain risk management. In the United States, CISA maintains the Trusted Internet Connections (TIC) 3.0 program documentation, including a Security Capabilities Catalog and reference architecture updated in July 2025, which federal stakeholders use to map boundary-security capabilities to solution architectures. Federal direction on secure technology procurement and assurance also incorporates NIST guidance such as SP 800-161r1 (supply chain risk management), alongside agency-aligned procedural control baselines.
Certification and validation requirements influence product roadmaps for UTM/NGFW platforms sold into regulated and government-adjacent environments. FIPS 140-3 validations under NISTs Cryptographic Module Validation Program (CMVP) remain a recurring requirement for cryptographic components in security platforms, and major vendors such as Cisco (Secure Firewall Threat Defense) and Palo Alto Networks (PAN-OS) maintain validated modules. Common Criteria evaluations (as published on the Common Criteria Portal) also serve as a procurement anchor for certain deployments, increasing the importance of documented security targets, evaluated configurations, and repeatable assurance evidence across hardware appliances and virtual editions.
Value Chain Analysis
The UTM value chain starts with core platform R&D (policy engine, IPS/IDS, malware filtering, SSL/TLS inspection, and centralized logging) and extends through packaging into software images, virtual appliances, and integrated hardware appliances. For appliance-led offers, OEMs and ODMs supply compute platforms and network interface components, while vendors integrate hardened operating systems, acceleration features, and signature/ML update pipelines. Distribution and monetization flow primarily through channel partners (VARs/MSPs) and increasingly through cloud marketplaces and direct subscriptions as UTM converges with SSE/SASE delivery models.
Assurance and compliance artifacts have become a distinct value-chain layer for many enterprise and public-sector opportunities, adding test labs and validation bodies to the ecosystem. Programs such as NIST CMVP for FIPS 140-3 cryptographic validation and Common Criteria evaluations influence release planning and supported configurations, while supply chain due diligence is formalized through NIST supply chain guidance (for example, SP 1326 quick-start material and SP 800-161r1) that emphasizes provenance and risk controls across suppliers. Post-sale, managed services and lifecycle operations (policy tuning, incident response workflows, and compliance reporting) are a major value capture point, aligning with skills constraints among SMEs and the need for consolidated audit trails across security functions.
Competitive Landscape
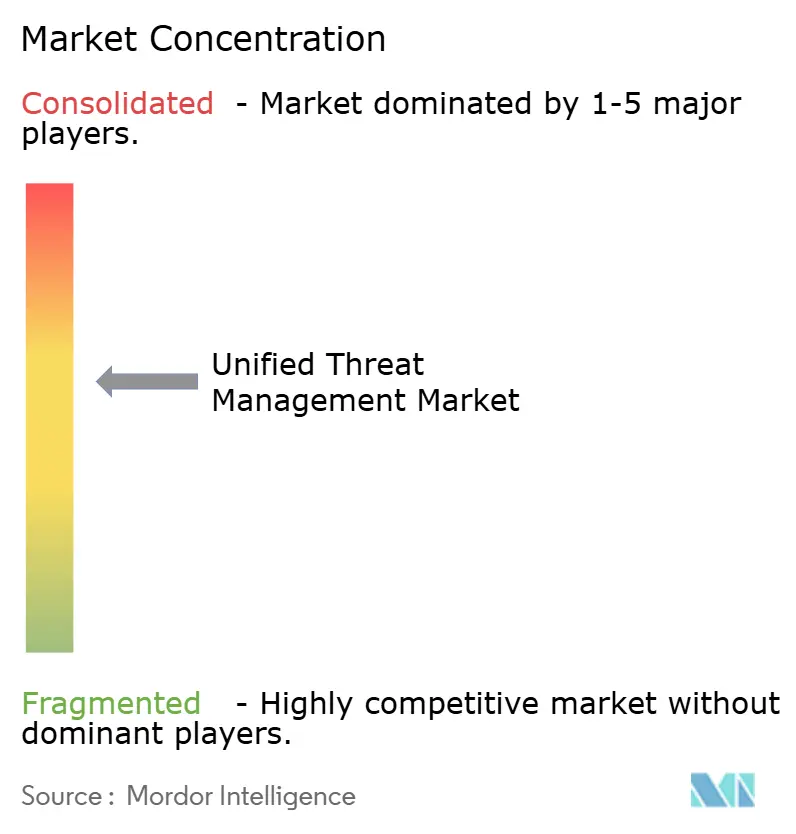
Vendor presence is moderately fragmented, yet platform players wield clear scale advantages. Cisco and Broadcom together hold more than 70% revenue, leveraging entrenched switching and routing portfolios to embed security licenses during refresh cycles. SonicWall, Check Point, and Fortinet compete aggressively on feature breadth and AI-assisted analytics. Each rolled out cloud-native inspection nodes to combat the appliance-only stigma. SonicWall’s 2024 acquisitions of Solutions Granted and Banyan Security expanded managed services and zero-trust capabilities. Check Point’s January 2025 injection of AI functions boosted detection accuracy across its Infinity stack.
Broadcom bundles Symantec engines with its semiconductor footprint to cross-sell endpoint and network protection. Cisco stitched UTM firewalls into Meraki edge devices, creating an intuitive cloud dashboard attractive to branch offices. At the specialist end, providers chase maritime and operational-technology niches where compliance and ruggedization are critical. The field is primed for more mergers as vendors race to add SASE and AI threat-hunting features. Buyers favor suppliers that guarantee performance consistency when every inspection module is turned on.
Channel strategies also matter. More than 90% of sales in North America flow through resellers that package UTM subscriptions with SD-WAN circuits. Disintermediation risks emerge when vendors court direct cloud subscriptions, occasionally clashing with value-added resellers. Those that preserve partner margins and offer multi-tenant consoles retain loyalty. The competitive storyline therefore mixes scale, innovation cadence, and channel diplomacy as determinants of long-term share.
Unified Threat Management Industry Leaders
Cisco Systems, Inc
Fortified Networks
Sophos
Palo Alto Networks
Check Point Software
- *Disclaimer: Major Players sorted in no particular order

Market Opportunities and Future Outlook
White-space growth remains centered on converged, cloud-managed security stacks that reduce operational overhead while improving audit readiness. CISA TIC 3.0 program materials (including the July 2025 Security Capabilities Catalog and reference architecture) provide a practical control-to-capability mapping for organizations modernizing boundary security, creating room for UTM vendors and MSPs that can show clear alignment between integrated firewall, web security, and logging functions and TIC-style capability outcomes. In parallel, NIST Cybersecurity Framework 2.0 provides a widely used organizing structure for governance and risk management, reinforcing demand for unified consoles that translate multi-function telemetry into consistent control evidence.
Supply chain and technology assurance requirements create opportunities for vendors that can productize due diligence and cryptographic assurance in ways that are easy to procure and continuously maintain. In January 2026, OMB Memorandum M-26-05 shifted federal direction toward a risk-based approach to software and hardware security, which elevates the importance of vendor-provided assurance evidence, transparent update practices, and fit-for-purpose controls rather than checklist-only compliance. NISTs publication of the Cybersecurity Supply Chain Management due diligence assessment quick-start guide (SP 1326) on July 8, 2026 further standardizes how organizations question suppliers on provenance, foreign ownership/control/influence, and resilience, increasing demand for UTM platform vendors and managed-service partners that can supply attestations, validated cryptography, and repeatable documentation alongside integrated protection.
Recent Industry Developments
- July 2026: CASwell Inc. released the CAR-6060 network appliance, a 2U rackmount platform utilizing Intel Xeon 6 processors designed for AI-assisted security workloads, including UTM, NGFW, and SASE applications. The release strengthens CASwell's position in enterprise security hardware with integrated UTM and SASE capabilities.
- June 2026: Cisco Systems, Inc. unveiled Cisco Cloud Control, a platform for managing and defending critical IT infrastructure, alongside the Live Protect digital immune system available for N9000 series switches. The cloud managed security control plane expands Cisco's cloud-native management and defense capabilities for higher-end N9000 and Nexus deployments.
- April 2026: Cambium Networks introduced the Network Service Edge 4000, a security platform integrating next generation firewall, unified threat management, SD-WAN, and local network services, managed via the cnMaestro cloud platform. The solution adds a cloud managed, multi function edge security capability aligned with UTM market expansion.


Research Methodology Framework and Report Scope
Market Definition and Coverage
This market covers revenue generated from unified threat management solutions that combine multiple network security functions into one integrated platform, delivered as software, virtualized appliances, or cloud-based deployments, and supported through related services sold for implementation and ongoing use.
Scope exclusions: We exclude pure point products sold outside an integrated UTM bundle (for example, standalone endpoint tools, SIEM-only tools, or email security purchased separately) unless they are packaged and priced as part of UTM.
Segmentation Overview
- By Component
- Software
- Service
- Professional Services
- Managed Services
- By Deployment Mode
- On-premise
- Cloud
- By End-user Enterprise Size
- Small and Medium-sized Enterprises (SMEs)
- Large Enterprises
- By End-User Industry
- BFSI
- IT and Telecom
- Healthcare
- Retail and e-Commerce
- Manufacturing
- Utilities and Energy
- Transport and Logistics
- Government and Public Sector
- Others
- By Geography
- North America
- United States
- Canada
- Mexico
- South America
- Brazil
- Argentina
- Rest of South America
- Europe
- Germany
- United Kingdom
- France
- Italy
- Russia
- Spain
- Switzerland
- Rest of Europe
- Asia-Pacific
- China
- India
- Japan
- South Korea
- Malaysia
- Singapore
- Vietnam
- Indonesia
- Rest of Asia-Pacific
- Middle East and Africa
- Middle East
- Saudi Arabia
- United Arab Emirates
- Turkey
- Rest of Middle East
- Africa
- Nigeria
- South Africa
- Rest of Africa
- Middle East
- North America
Data Sources, Market Sizing, and Validation
Desk Research
Desk research starts by grounding the market in observable security demand signals and IT spending direction, then mapping UTM adoption to enterprise network and cloud changes. We review public sources such as NIST publications, CISA alerts, FCC communications trends, and ITU cybersecurity indicators to understand threat patterns and policy pressure that can influence refresh cycles.
To tie the narrative to measurable spend, we also use company filings, investor presentations, earnings call transcripts, and reputable press to identify product positioning, typical contract structures, and pricing movements for bundled security platforms. Patent databases are checked to see which functions are being integrated more tightly (for example, secure web gateway and intrusion prevention capabilities within a single stack). In some cases, paid subscriptions for company financials and news are used to standardize segment reporting and avoid mismatching fiscal calendars. These desk sources are illustrative and not exhaustive, since many other publications and public datasets were also consulted for validation and clarification.
Primary Interviews and Surveys
Primary work is used to pressure-test what UTM buyers actually purchase together, how they budget for software versus services, and how fast workloads are moving to cloud-managed gateways. We speak with a mix of solution providers, channel partners, and enterprise security and network teams so assumptions on attach rates, renewal behavior, and deployment mix can be checked across regions and company sizes.
Distribution of primary research fieldwork respondents
| Company type | Respondent position | Region |
|---|---|---|
| Top tier: 28% | CXOs: 22% | APAC: 50% |
| Mid tier: 50% | Functional/Unit leaders: 18% | EMEA: 32% |
| Smaller Players: 22% | Managers: 60% | Americas: 18% |
Market-Sizing & Forecasting
For sizing, we use a top-down approach where enterprise security spending pools are reconstructed by geography and then narrowed to integrated UTM spend using adoption and deployment mix indicators. Once that first cut is built, the totals are corroborated through selective bottom-up checks like sampled ASP ranges for UTM subscriptions, typical service attach rates for implementation, and channel feedback on mid-market deal volumes, which are then used to adjust any over or under-shoot.
Key model inputs include the shift in deployment mode toward cloud-managed UTM, refresh cycles for branch security appliances, the proportion of enterprises consolidating security tools, typical contract duration and renewal rates, and the software versus services revenue split seen in real buyer journeys. When primary inputs differ by vertical (for example, BFSI having higher compliance-driven service needs), separate weighting is applied before rolling results up. For forecasting, scenario analysis is used around cloud migration pace, regulatory pressure, and macro IT budget tightness, and then a central path is selected based on the most consistent expert consensus. Where bottom-up inputs are missing for smaller countries or niche verticals, we use proxy ratios from similar markets and then re-check the output against regional respondent feedback.
Data Validation & Update Cycle
Validation is done through multiple checks so the final numbers stay tied to real demand behavior and plausible pricing. We triangulate the model with independent signals such as security platform mix trends, stated customer migration to cloud-managed gateways, and changes in average contract size mentioned in public disclosures. If the implied per-customer spend or growth rate looks unusual for a given region, the assumption set is revisited, followed by a second analyst review before sign-off.
The report is refreshed annually, and interim updates are made when material events change spend patterns, such as major regulatory actions or a sudden shift in deployment preference. Before delivery, we run a final data pass so clients receive the latest updated view based on newly available public information and follow-up expert feedback.
Mordor Intelligence's Unified Threat Management Market Size Versus Other Published Estimates
Published UTM market values often differ because authors do not always count the same product bundle, and some mix adjacent markets into the same total. Differences also come from how cloud subscriptions are annualized, how services are treated, and whether exchange rates and base years are aligned to the same time window.
Some external estimates widen the pool by blending next-generation firewall, secure web gateway, and other network security products even when they are sold as separate tools. In Mordor Intelligence, revenue is counted only when multiple security functions are packaged and priced together under a UTM offering, and professional and managed services are included only when they are directly tied to that deployment.
Benchmark comparison
| Source | Market Size | Gaps in Research Methodology |
|---|---|---|
| Mordor Intelligence | USD 9.32 B (2025) | |
| Industry Journal A | USD 7.35 B (2024) | Uses an older refresh cycle and applies generalized discounting assumptions for bundled security platforms without consistent checks on renewal pricing and cloud subscription annualization. |
| Regional Consultancy B | USD 9.60 B (2024) | Back-solves UTM share from a broad security appliance total, which can pull in standalone firewall and gateway revenue that is not sold as an integrated UTM bundle. |
The spread mainly comes from how tightly the definition is tied to a true bundled UTM purchase, and from the timing of price and currency assumptions used for the base year. By keeping the model linked to deployment mix, renewal behavior, and realistic ASP ranges confirmed by interviews, we keep the estimate traceable to repeatable inputs and easy-to-audit steps.


Key Questions Answered in the Report
What is the current size of the unified threat management market and how fast is it growing?
The market stands at USD 10.56 billion in 2026 and is projected to reach USD 19.75 billion by 2031, reflecting a 13.34% CAGR.
Which component contributes the largest share to the unified threat management market?
Software components lead with 65.72% revenue share in 2025, owing to their flexible deployment and rapid update capabilities.
Which deployment model is expanding the fastest?
Cloud-based deployments hold 57.65% of 2025 revenue and are advancing at a 13.92% CAGR through 2031 as enterprises shift away from hardware-bound appliances.
Which geographic region is expected to record the highest growth rate?
Asia-Pacific is forecast to expand at an 18.14% CAGR to 2031, driven by stricter regulations and rapid digitalization across manufacturing and services.
What years does this Unified Threat Management Market cover?
The report covers the Unified Threat Management Market historical market size for years: 2019, 2020, 2021, 2022, 2023 and 2024. The report also forecasts the Unified Threat Management Market size for years: 2025, 2026, 2027, 2028, 2029 and 2030.
Page last updated on:






