
Ultrasound Transducer Market Size and Share
Market Overview
| Study Period | 2020 - 2031 |
|---|---|
| Market Size (2026) | USD 4.24 Billion |
| Market Size (2031) | USD 5.06 Billion |
| Growth Rate (2026 - 2031) | 3.59 % |
| Fastest Growing Market | Asia-Pacific |
| Largest Market | Asia Pacific |
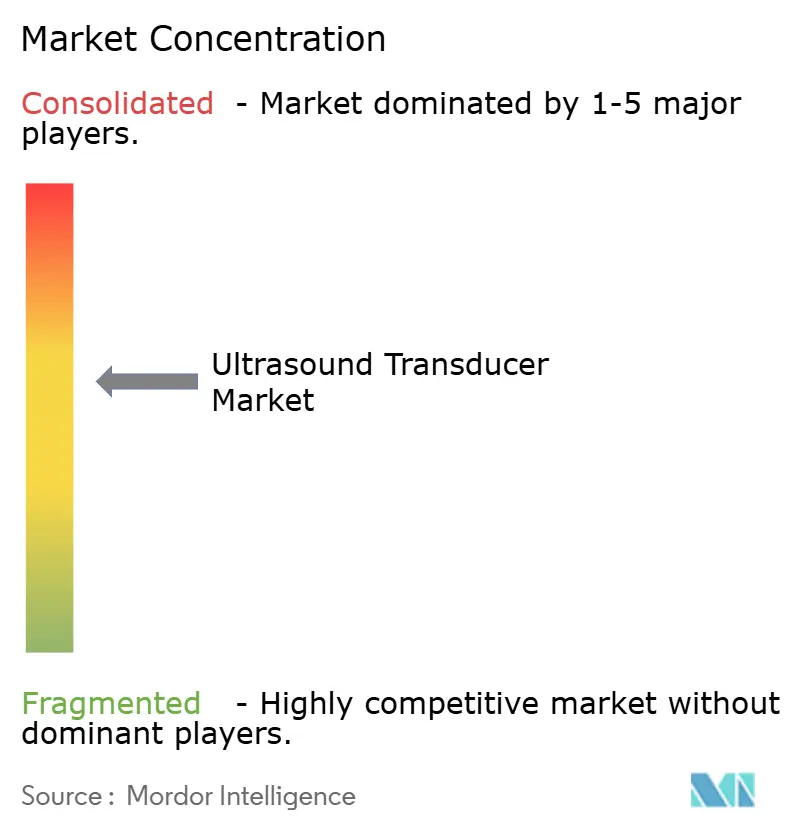
| Market Concentration | Medium |
Major Players *Disclaimer: Major Players sorted in no particular order Image © Mordor Intelligence. Reuse requires attribution under CC BY 4.0. | |
Ultrasound Transducer Market Analysis by Mordor Intelligence
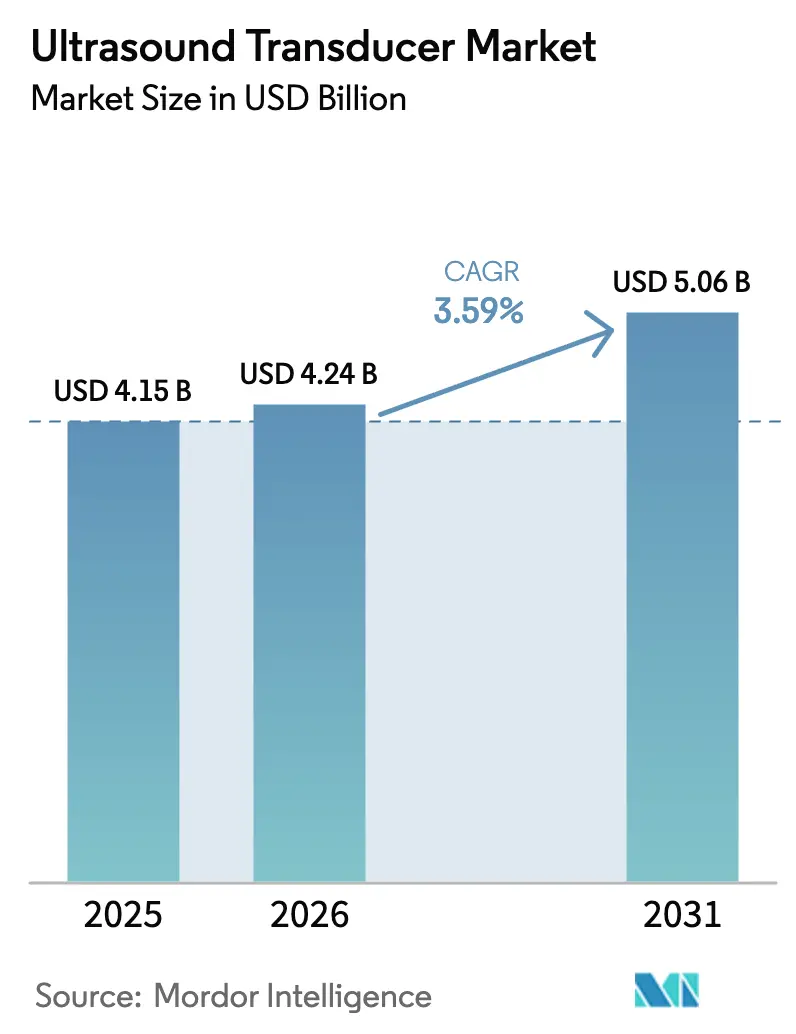
The Ultrasound Transducer Market size is expected to increase from USD 4.15 billion in 2025 to USD 4.24 billion in 2026 and reach USD 5.06 billion by 2031, growing at a CAGR of 3.59% over 2026-2031.
The market's steady expansion conceals a structural shift from piezoelectric hospital consoles toward silicon-based arrays that power handheld, AI-enabled devices for bedside and home imaging. Demand is migrating from bulky, console-based platforms toward silicon-etched arrays that power pocket-sized, AI-enabled scanners. Semiconductor scale is lowering costs and enabling lead-free designs, while regulatory shifts such as the EU’s RoHS directive and China’s 2024 device-registration overhaul are accelerating adoption of next-generation architectures. Providers in emergency and critical-care settings are embedding handheld ultrasound into triage, and cloud-connected ecosystems now link home-health agencies with supervising clinicians. National manufacturing incentives in India, China, and Germany are localizing supply chains for piezoelectric wafers and CMUT chips, easing bottlenecks exposed during the semiconductor crunch.
Key Report Takeaways
- By product category, linear probes led with 33.62% revenue share in 2025; 3D/4D matrix-array probes are on track to register a 7.25% CAGR through 2031.
- By technology, piezoelectric crystal designs captured 62.73% of the ultrasound transducer market share in 2025, whereas CMUT architectures are forecast to expand at a 6.14% CAGR to 2031.
- By application, cardiovascular imaging held 29.32% of the ultrasound transducer market size in 2025 and point-of-care use cases are growing at a 6.25% CAGR during the outlook period.
- By end user, hospitals commanded 54.73% of 2025 revenue; home-healthcare settings represent the fastest trajectory with a 7.84% CAGR through 2031.
- By geography, Asia-Pacific generated 32.68% of 2025 revenue and is expected to post a 6.74% CAGR, the highest among regions.
Note: Market size and forecast figures in this report are generated using Mordor Intelligence’s proprietary estimation framework, updated with the latest available data and insights as of January 2026.
Market Trends and Insights
Drivers Impact Analysis of Ultrasound Transducer Market*
| Driver | (~) % Impact on CAGR Forecast | Geographic Relevance | Impact Timeline |
|---|---|---|---|
| Rapid migration toward minimally invasive & image-guided interventions | 0.8% | Global, with concentration in North America & EU advanced surgical centers | Medium term (2-4 years) |
| Growing prevalence of cardiovascular & abdominal disorders | 0.7% | Global, highest burden in Asia-Pacific and Middle East & Africa | Long term (≥ 4 years) |
| Expanding obstetric screening in emerging economies | 0.5% | Asia-Pacific core (India, Southeast Asia), spill-over to Sub-Saharan Africa | Medium term (2-4 years) |
| Increasing average maternal age in developed regions | 0.4% | North America, Europe, Japan, South Korea | Long term (≥ 4 years) |
| Surge in AI-assisted point-of-care (POC) ultrasound adoption | 0.9% | North America & EU early adopters, rapid diffusion to Asia-Pacific urban centers | Short term (≤ 2 years) |
| Supply-chain localization for piezoelectric crystals amid trade tensions | 0.3% | National initiatives in Germany, India, China; spillover to allied manufacturing hubs | Medium term (2-4 years) |
| Source: Mordor Intelligence | |||
Rapid Migration Toward Minimally Invasive & Image-Guided Interventions
Interventional teams are dropping fluoroscopy in favor of real-time ultrasound for biopsies, ablations, and catheter navigation, reducing radiation exposure and shortening case times. Olympus obtained FDA clearance for the EU-ME3 ultrasound endoscope in 2025, enabling simultaneous imaging and tissue sampling of pancreatic lesions without external probes.[1] Robotic platforms have begun integrating small-footprint transducers on articulating arms, letting surgeons delineate tumor margins during partial nephrectomies. These workflows push demand for high-frequency (≥20 MHz), sterilizable, or single-use probes that withstand autoclave cycles. Adoption is most pronounced in North America and Western Europe, where ambulatory centers compete on throughput and radiation-free protocols.
Growing Prevalence of Cardiovascular & Abdominal Disorders
Ischemic heart disease caused 9 million deaths in 2021, while 193 million disability-adjusted life years were lost to cardiovascular ailments worldwide. Echocardiography remains the first-line modality, sustaining demand for phased-array and CW Doppler probes. Ultromics secured FDA clearance for its EchoGo Heart Failure algorithm, which autonomously measures ejection fraction and detects HFpEF from routine views, widening access to cardiac diagnostics. Emerging economies face the greatest disease burden, spurring government tenders for portable echo systems.
Expanding Obstetric Screening in Emerging Economies
WHO’s 2024 antenatal guidelines recommend at least two ultrasound scans per pregnancy, prompting mobile programs across India, Indonesia, and Nigeria. Mindray’s Nuewa R9 Platinum, registered in the Philippines in 2025, links village health workers to remote radiologists via the MiCo+ cloud, raising probe volumes where durability and low cost trump advanced features.
Increasing Average Maternal Age in Developed Regions
In 2024, first-time mothers at Allegheny Health Network's (AHN) labor and delivery units in the U.S. averaged 31.1 years, surpassing the national average by over three years, as reported by the 14-hospital system.[2] Another national report highlighted that in 2023, the average age for first-time mothers nationwide in the United States was 27.5 years, with large metropolitan counties seeing an average of 28.5 years.[3] Advanced maternal age drives additional ultrasounds for anomaly, Doppler, and nuchal translucency exams. Japan and South Korea report even higher averages, sustaining demand for high-frequency linear and 3D/4D matrix-array probes capable of resolving 2-millimeter fetal structures. Philips and GE bundle automated biometry and AI anomaly detection to convert demographic trends into recurring software revenue.
Restraints Impact Analysis of Ultrasound Transducer Market*
| Restraint | (~) % Impact on CAGR Forecast | Geographic Relevance | Impact Timeline |
|---|---|---|---|
| High upfront cost of premium ultrasound platforms | -0.6% | Global, most acute in price-sensitive Asia-Pacific and Sub-Saharan Africa markets | Short term (≤ 2 years) |
| Reimbursement gaps for outpatient ultrasound procedures | -0.5% | North America, with spillover to private-payer markets in Latin America and Middle East | Medium term (2-4 years) |
| Shortage of trained sonographers, especially in rural settings | -0.4% | Global, highest impact in rural North America, Sub-Saharan Africa, and South Asia | Long term (≥ 4 years) |
| Limited global capacity for single-crystal piezoelectric materials | -0.3% | Global supply-chain constraint affecting premium transducer production | Medium term (2-4 years) |
| Source: Mordor Intelligence | |||
High Upfront Cost of Premium Ultrasound Platforms
Budgets at community hospitals remain tight, discouraging replacement of legacy consoles that have reached end-of-service life. Premium systems with matrix-array probes, elastography, and AI can top USD 200,000. Butterfly’s iQ3, introduced in 2024 at under USD 2,500, shows how CMUT designs can collapse costs, but handheld units sacrifice penetration depth for obese patients. Lease and pay-per-scan models ease barriers in high-income regions but lag in markets where credit is scarce.
Reimbursement Gaps for Outpatient Ultrasound Procedures
CMS cut the Medicare conversion factor by 2.8% in 2025 and applied a 2.5% efficiency adjustment to work RVUs in the 2026 final rule, crimping margins for office-based echocardiography and vascular studies. Private payers in Latin America and the Gulf typically follow CMS changes with a delay, signaling sustained pressure through 2028. Providers are shifting to higher-acuity procedures that pay better, concentrating demand on specialized probes and leaving general imaging exposed to volume declines.
*Our forecasts treat driver/restraint impacts as directional, not additive. The impact forecasts reflect baseline growth, mix effects, and variable interactions.
Ultrasound Transducer Market Segment Analysis
By Product:
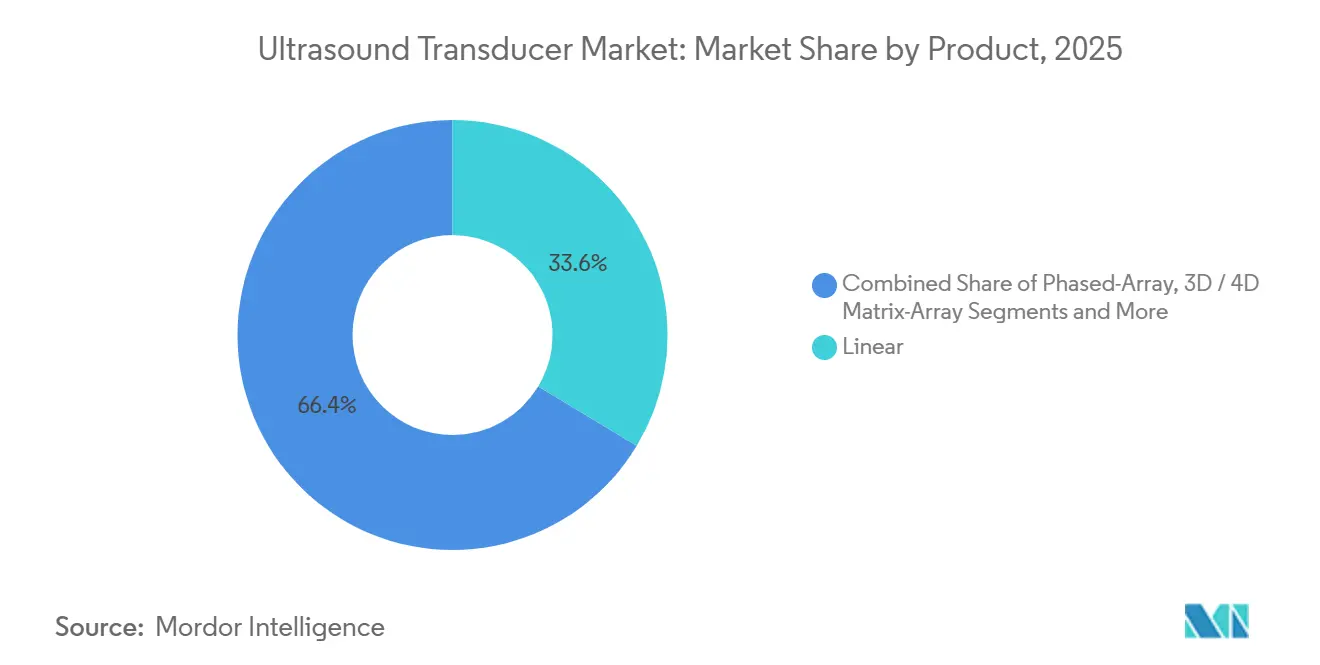
Matrix Arrays Drive Volumetric Imaging3D/4D matrix-array probes are growing at 7.25%, the fastest across product categories, as obstetricians demand volumetric fetal screening and cardiologists quantify real-time valve regurgitation. Linear probes maintained a 33.62% share in 2025, favored for musculoskeletal and vascular imaging. Convex arrays dominate abdominal and obstetric work, while phased-array probes underpin cardiac imaging. Intracardiac and intravascular catheters command premium prices above USD 1,000 per case, critical to electrophysiology and coronary interventions. CMUT-based handhelds, powered by Infineon’s one-chip solution, streamline manufacturing and meet RoHS lead-free mandates. Veterinary and HIFU applications extend product diversity, and disposable probes gain traction where reprocessing costs approach USD 40 per cycle.

By Technology:
CMUT Challenges Piezoelectric DominancePiezoelectric crystal designs still account for 62.73% of 2025 revenue, yet CMUT architectures are rising 6.14% yearly by leveraging semiconductor lithography and eliminating toxic lead. Butterfly’s Ultrasound-on-Chip exemplifies monolithic integration and RoHS compliance. PMUT designs blend thin-film piezo layers with silicon substrates for dermatology and ophthalmology applications demanding sub-50-micron resolution. Disposable and MRI-compatible probes carve out infection-control and interventional niches, broadening the technology palette.
By Application:
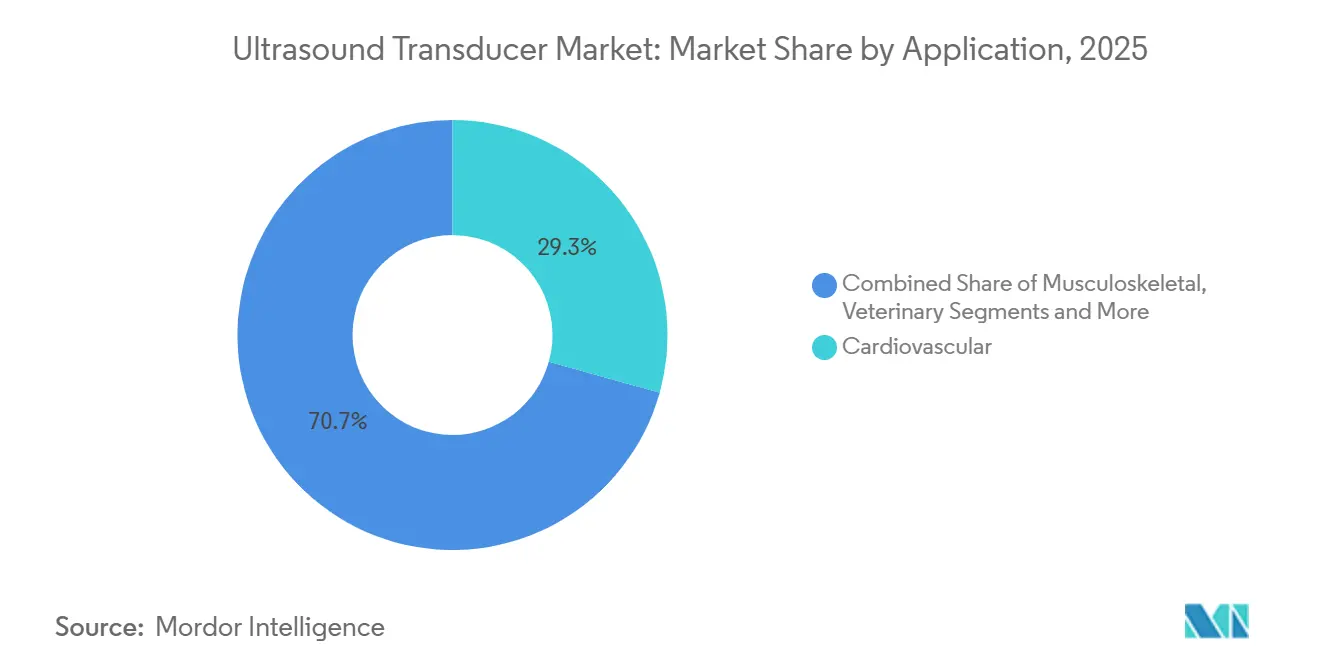
Point-of-Care Outpaces Traditional RadiologyPoint-of-care workflows grow at 6.25%, fueled by handheld devices and FDA-cleared AI aids. Cardiovascular work still leads with a 29.32% revenue share. Musculoskeletal imaging penetrates sports medicine and pain clinics with high-frequency probes, while WHO antenatal guidelines lock in baseline obstetric demand. Urology benefits from AI-guided transrectal biopsies, and oncology expands through HIFU guidance. Veterinary usage widens the application scope, especially in large-animal reproduction.
By End User:
Home Healthcare Disrupts Hospital HegemonyHospitals commanded 54.73% of 2025 revenue, but home-healthcare programs are advancing at 7.84% as remote monitoring pairs handheld ultrasound with cloud analytics. Diagnostics centers and ambulatory surgical centers capture share with shorter wait times. Philips Lumify and Exo Iris empower caregivers to capture diagnostic-grade images in patient homes, a model further enabled by CMS’ virtual direct supervision policy.
Geography Analysis
APAC Ultrasound Transducer Market
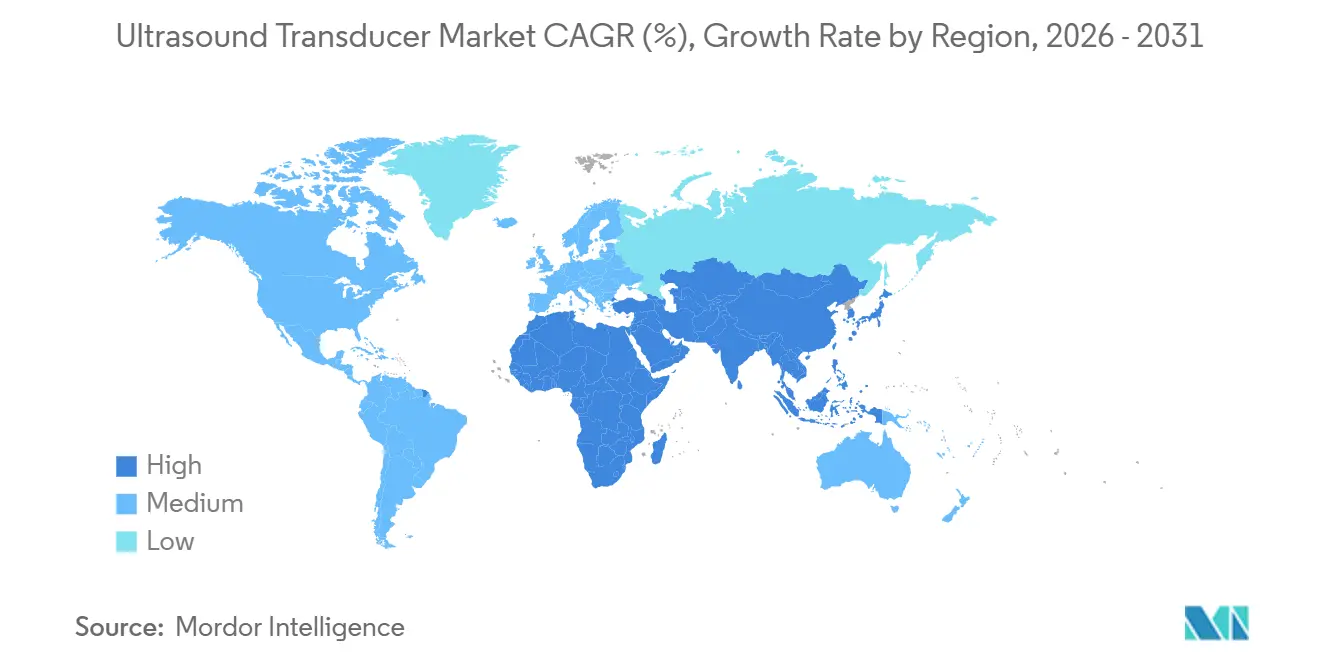
Asia-Pacific generated 32.68% of 2025 revenue and is poised for a 6.74% CAGR through 2031. India’s Production-Linked Incentive program triggered 19 greenfield projects, including Siemens Healthineers’ INR 91.9 crore (USD 11 million) ultrasound plant announced in May 2025, while Medtronic earmarked USD 350 million to enlarge its Hyderabad campus in March 2024, reinforcing confidence in local supply chains. China’s 2024 device-regulation revision accelerated Fujifilm’s USD 120 million Suzhou expansion and cleared Olympus to register an advanced gastroscope with an integrated transducer in August 2025. Samsung Medison unveiled the R20 premium scanner at RSNA 2025, highlighting Seoul’s push for AI-centric imaging exports. Japan’s AMED continues to fund elastography and photoacoustic prototypes, ensuring a pipeline of high-frequency transducer innovations. Australia’s Therapeutic Goods Administration aligns with EU MDR pathways, preserving streamlined entry for systems already cleared in Europe. Collectively, the region blends domestic manufacturing incentives, regulatory reform, and chronic-disease demand to sustain above-average growth.
North America and Europe Ultrasound Transducer Market
North America and Europe remain major revenue pools but advance at below-trend rates as reimbursement pressure curbs capital budgets. CMS cut the Medicare conversion factor by 2.8% in 2025 and applied a 2.5% efficiency adjustment in the 2026 fee schedule, dampening outpatient upgrade cycles. Philips partnered with Mass General Brigham in February 2025 to harvest de-identified echo and vascular data for AI training, illustrating how software ecosystems offset hardware margin compression. Germany’s EUR 700 million microelectronics plan, announced in October 2025, seeks local piezoelectric wafer capacity and less reliance on Asian suppliers.
MEA and South America Ultrasound Transducer Market
Middle East & Africa and South America post the sharpest epidemiologic shifts yet wrestle with funding gaps and regulatory complexity. Gulf Cooperation Council hospitals are importing premium consoles under broader diversification agendas, while refurbished units dominate procurement in Sub-Saharan clinics. Brazil’s ANVISA shortened approval timelines to nine months, encouraging distributors to stock newer probes that meet ISO 13485 requirements. Argentina’s currency volatility steers buyers toward extended service contracts, and South Africa’s SAHPRA alignment with WHO prequalification facilitates faster entry for FDA-cleared handhelds, positioning distributed imaging as a solution for rural access constraints.
Regulatory Landscape
Ultrasound transducers are regulated as medical devices and typically follow premarket clearance pathways that hinge on safety, acoustic output, and performance testing. In the United States, the FDA marketing-clearance framework for diagnostic ultrasound systems and transducers (510(k)) remains the central pathway used by OEMs when introducing new probes or making design changes, supported by device-specific guidance on when modifications may not require a new submission.
Biocompatibility and materials compliance are tightening as manufacturers move into handheld, single-use, and home-use formats, where skin-contact duration and cleaning chemistries can differ. ISO 10993-1:2025 (published November 2025) updates the biological evaluation approach with a more explicit risk-based, chemical-characterization-led process, and the FDA partially recognized ISO 10993-1:2025 as of May 25, 2026 (Recognition No. 2-313), while allowing declarations of conformity to ISO 10993-1:2018 for FDA submissions until July 1, 2029. This sets a transition window for probe portfolios, while increasing documentation rigor for new materials, coatings, and disposable designs.
Value Chain Analysis
The value chain starts with specialized materials and subcomponents, including piezoelectric ceramics and single-crystal materials, polymers for backing and matching layers, acoustic lenses, cables and connectors, and electronics for beamforming in high-channel-count probes. Core fabrication steps include element dicing, grinding to frequency tolerances, electrode patterning (including photolithography in silicon-based architectures), assembly and encapsulation, acoustic characterization, and sterilization or reprocessing validation for probes used in interventional settings. Single-crystal piezoelectric capacity and high-purity inputs continue to constrain premium probes, including matrix arrays, ICE/IVUS, and high-frequency linear designs.
Downstream, OEMs and specialist probe manufacturers supply transducers bundled with ultrasound systems or as replacement and upgrade probes through direct sales, distributors, and service organizations that manage maintenance, refurbishment, and compatibility across installed bases. Tariffs and geopolitics have increased the focus on manufacturing localization and dual sourcing, with reported 10% to 20% duties in 2025 on certain imported piezoelectric ceramics in the United States influencing cost structures. Capacity and localization moves by large OEMs and suppliers, such as Philips investment to expand US manufacturing and R&D (including a transducer-producing site in Reedsville, Pennsylvania) and Siemens Healthineers ultrasound manufacturing expansion under Indias PLI program, point to more regionalized production and tighter control over critical probe know-how.
Competitive Landscape
The ultrasound transducer market shows moderate fragmentation. Philips forged interoperability deals with ventilator and anesthesia vendors in July 2025, embedding ultrasound data into broader care ecosystems. GE Healthcare’s Venue R6, launched in September 2025, ships with Verisound AI, tapping its 500,000-unit installed base for recurring software income. Mindray pushes into premium tiers via the Nuewa R9 Platinum cloud-connected system. New entrants leverage chip economics and AI: Infineon’s one-chip CMUT shrinks bill-of-materials by 30%, and Exo pairs SweepAI with Samsung Medison manufacturing scale. Veterinary and HIFU segments remain open for niche innovators.
Ultrasound Transducer Industry Leaders
-
Koninklijke Philips N.V
-
Siemens Healthineers
-
Canon Medical Systems
-
GE Healthcare
-
Fujifilm Holdings
- *Disclaimer: Major Players sorted in no particular order
Ultrasound Transducer Market Companies Covered in this Report
- Alpinion Medical Systems
- BK Medical
- Broadsound Corporation
- Butterfly Network
- Canon
- Clarius Mobile Health
- ESAOTE S.p.A.
- FUJIFILM
- GE Healthcare
- Hitachi Healthcare
- Hologic
- Imotek
- Konica Minolta Ultrasound
- Koninklijke Philips
- Samsung Group
- Mindray
- Siemens Healthineers
- SonoScape Medical
- Telemed Ultrasound Medical System
- Terason
Market Opportunities and Future Outlook
One clear whitespace is scaling transducer supply for handheld and point-of-care ultrasound without sacrificing clinical performance in challenging patients, where penetration depth, thermal limits, and ruggedization can narrow adoption. Manufacturing capacity additions and portfolio broadening support active investment in this direction, including Sonostar Groups January 2026 opening of a manufacturing complex with a dedicated wireless probe assembly and quality-control floor (company-stated capacity of 100,000 units per year) and Vermon Groups July 2026 inauguration of a 30,000-square-foot TransducerWorks facility in Pennsylvania with ISO 7 and ISO 8 cleanrooms to expand industrial production capacity.
Opportunities also extend into specialized, higher-value probe categories tied to new procedures and higher frequency requirements, including intravascular imaging, interventional ultrasound, and emerging therapeutic applications that depend on precise acoustic delivery. Regulatory clearances for new ultrasound platforms in 2026, including FDA 510(k) clearances for GE HealthCare (LOGIQ Vita series) and Wuhan United Imaging Healthcare (uSONIQUE series), expand the addressable installed base that can draw in probe demand across routine and premium exam types. At the same time, continued R&D into MEMS-based CMUT/PMUT arrays, flexible form factors, and very high channel-count 3D probes supports opportunities for OEMs and component suppliers to integrate transducer, front-end electronics, and software into upgradeable ecosystems, rather than selling probes as standalone hardware.
Recent Industry Developments in Ultrasound Transducer Market
- July 2026: Royal Philips introduced the Alturion ultrasound system with AI-powered workflows designed for high-volume clinical environments. By emphasizing transducer interoperability with existing platforms such as EPIQ Elite and Affiniti, the launch supports fleet standardization and recurring probe pull-through across installed bases.
- March 2026: steute Technologies acquired Oldelft Ultrasound, adding miniaturized ultrasound-transducer capabilities used in cardiology applications. The deal strengthens vertical control over specialized transducer IP and can speed integration of compact probes into broader device portfolios.
- May 2025: Siemens Healthineers announced an INR 91.9 crore (USD 11 million) ultrasound manufacturing plant project in India supported by the Production-Linked Incentive (PLI) program. The investment underscores ongoing supply-chain localization for ultrasound hardware and creates additional regional capacity for probe and system manufacturing.
Ultrasound Transducer Market Report Scope and Research Methodology
Market Definition and Coverage
For this methodology, the market covers ultrasound transducers sold for medical imaging and clinical procedures, counted as revenues generated from probe shipments and replacements across end users globally.
Scope exclusions: We exclude ultrasound systems, general accessories, service contracts, and software-only upgrades that do not include a transducer.
Segments Covered in This Report
- By Product
- Convex (Curvilinear)
- Linear
- Endocavitary (Transvaginal & Transrectal)
- Phased-Array
- Continuous-Wave (CW) Doppler
- High-Frequency Linear (≥20 MHz)
- 3D / 4D Matrix-Array
- Intracardiac & Intravascular (ICE/IVUS)
- Capacitive Micromachined Ultrasonic Transducers (CMUT)
- Others
- By Technology
- Piezoelectric Crystal
- CMUT
- PMUT
- Single-Use / Disposable
- MRI-Compatible
- By Application
- Cardiovascular
- Musculoskeletal
- OB/GYN & Prenatal
- General Imaging
- Point-of-Care & Emergency Medicine
- Urology & Prostate
- Oncology
- Veterinary
- Others
- By End User
- Hospitals
- Diagnostic Imaging Centers
- Ambulatory Surgical Centers
- Home Healthcare Settings
- Veterinary Clinics
- Others
- By Geography
- North America
- United States
- Canada
- Mexico
- Europe
- Germany
- France
- United Kingdom
- Italy
- Spain
- Rest of Europe
- Asia-Pacific
- China
- Japan
- India
- South Korea
- Australia
- Rest of Asia-Pacific
- Middle East & Africa
- GCC
- South Africa
- Rest of Middle East & Africa
- South America
- Brazil
- Argentina
- Rest of South America
- North America
Data Sources, Market Sizing, and Validation
Desk Research
Desk research started with mapping the clinical demand pool and the device footprint that drives probe usage. We reviewed public healthcare utilization and imaging indicators, then connected them to procurement patterns for probes and replacements.
Common public inputs included sources such as the World Health Organization for health system context, OECD health statistics for imaging and spending indicators, the US FDA device databases for product and clearance signals, and US Census trade data for directional import-export trends. We also used sources such as peer-reviewed journals for procedure mix and adoption patterns, plus company annual reports, investor presentations, and reputable press releases to understand product positioning and regional exposure. In a few cases, paid subscriptions for company financial intelligence and patent databases helped confirm revenue splits and innovation activity. The desk research sources listed here are illustrative, and additional public and paid references were used for data collection, validation, and clarification.
Primary Interviews and Surveys
Primary work was used to pressure-test assumptions that are hard to read from public sources, especially replacement cycles, pricing movement, and mix shifts between high volume and specialty probes. We spoke with transducer suppliers, distributors, hospital imaging teams, and service and procurement contacts across APAC, EMEA, and the Americas so gaps from desk research could be closed and the final totals could be reconciled.
Distribution of primary research fieldwork respondents
| Company type | Respondent position | Region |
|---|---|---|
| Top tier: 32% | CXOs: 14% | APAC: 43% |
| Mid tier: 46% | Functional/Unit leaders: 27% | EMEA: 37% |
| Smaller Players: 22% | Managers: 59% | Americas: 20% |
Market-Sizing & Forecasting
Sizing began with a top-down build where installed base and procedure intensity were used to reconstruct the replacement and new purchase demand for probes by major care settings. That demand pool was then translated into value using average selling prices that were adjusted for product mix (for example, higher priced specialty probes versus standard probes) and for regional pricing differences.
To keep totals realistic, we corroborated the outputs with selective bottom-up checks, such as supplier revenue splits by probe category, channel feedback on shipment run rates, and sampled volume times ASP for a few high-visibility end uses. Key inputs used in the model included ultrasound procedure volume trends, imaging utilization by specialty, hospital and diagnostic center capacity additions, replacement cycle ranges, and observed ASP movement tied to technology mix. Forecasting leaned on scenario analysis supported by expert consensus on utilization growth and procurement cycles, and then results were smoothed to avoid step changes unless a clear trigger was confirmed. Where bottom-up details were incomplete, gaps were handled by using conservative mix assumptions and then reconciling back to the top-down demand pool.
Data Validation & Update Cycle
Outputs were cross-checked against independent signals, including trade flow direction, device installation momentum, and supplier commentary on probe demand, which helped flag mismatches early. When a region or application showed a sharp jump, the driver was re-tested through follow-up calls and by rechecking the linked assumptions, before the numbers were allowed to remain in the model.
A multi-step review is followed so arithmetic, units, and conversion logic are verified, and then the story line is checked against the numbers. Reports are refreshed annually, and interim updates are made when material events change pricing, supply, or demand expectations. Before delivery, a fresh pass is completed so clients receive the latest updated view.
Mordor Intelligence's Ultrasound Transducer Market Size Versus Other Published Estimates
Published market sizes for ultrasound transducers can vary even when the topic sounds identical, because boundaries are drawn differently and pricing logic is not always consistent. Differences usually come from what is counted as a transducer sale, how replacements are treated, and how currency timing and inflation are handled.
By tracking replacement cycle assumptions and refreshing ASP benchmarks by probe type and region, Mordor Intelligence keeps the value estimate tied to transducer-only revenue and avoids mixing in ultrasound systems and service revenue. Some estimates broaden scope to include the full ultrasound equipment bundle, while others apply aggressive unit growth without validating procedure and installed-base signals across regions.
Benchmark comparison
| Source | Market Size | Gaps in Research Methodology |
|---|---|---|
| Mordor Intelligence | USD 4.15 B (2025) | |
| Trade Journal A | USD 3.80 B (2024) | Often reflects a shorter forecast window and may lean on a single base-year value with limited visibility into replacement rates and probe mix, which can understate specialty transducer revenue. |
| Industry Report B | USD 3.72 B (2024) | May apply conservative growth and broader averaging of prices across regions, and it can blur transducer-only sales with adjacent ultrasound equipment lines depending on how categories are grouped. |
Overall, the spread is mainly explained by scope boundaries, how replacement demand is quantified, and how ASPs are updated by mix and geography. The approach here stays traceable to practical inputs like procedure intensity, installed base signals, and validated replacement behavior, which makes the total easier to reproduce and adjust when conditions change.
Key Questions Answered in the Report
How large is the ultrasound transducer market in 2026?
The ultrasound transducer market size reached USD 4.24 billion in 2026 and is projected to rise to USD 5.06 billion by 2031.
Which product type leads revenue?
Linear probes led with 33.62% of 2025 revenue, but 3D/4D matrix-array probes are the fastest growing.
What region is expanding the fastest?
Asia-Pacific is forecast to grow at a 6.74% CAGR through 2031, buoyed by local manufacturing incentives.
Who are the major players?
GE Healthcare, Philips, Siemens Healthineers, Canon Medical Systems, and Mindray together hold about 45% of revenue.
How is AI influencing adoption?
More than 30 FDA-cleared AI algorithms now automate image interpretation, lowering skill barriers and accelerating point-of-care use.
What hampers wider uptake?
High upfront costs, reimbursement cuts, a sonographer shortage, and limited supply of single-crystal piezo materials restrain growth.