
Ultrasonic Sensors Market Size and Share
Market Overview
| Study Period | 2020 - 2031 |
|---|---|
| Market Size (2026) | USD 7.75 Billion |
| Market Size (2031) | USD 11.79 Billion |
| Growth Rate (2026 - 2031) | 8.72% CAGR |
| Fastest Growing Market | South America |
| Largest Market | Asia Pacific |
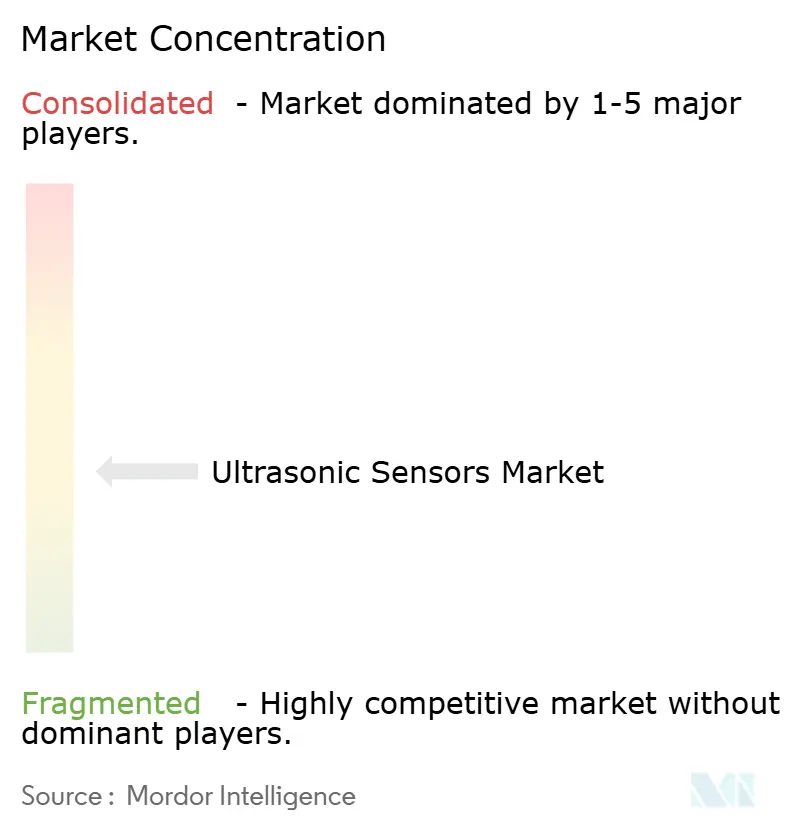
| Market Concentration | Medium |
Major Players *Disclaimer: Major Players sorted in no particular order Image © Mordor Intelligence. Reuse requires attribution under CC BY 4.0. | |
Ultrasonic Sensors Market Analysis by Mordor Intelligence
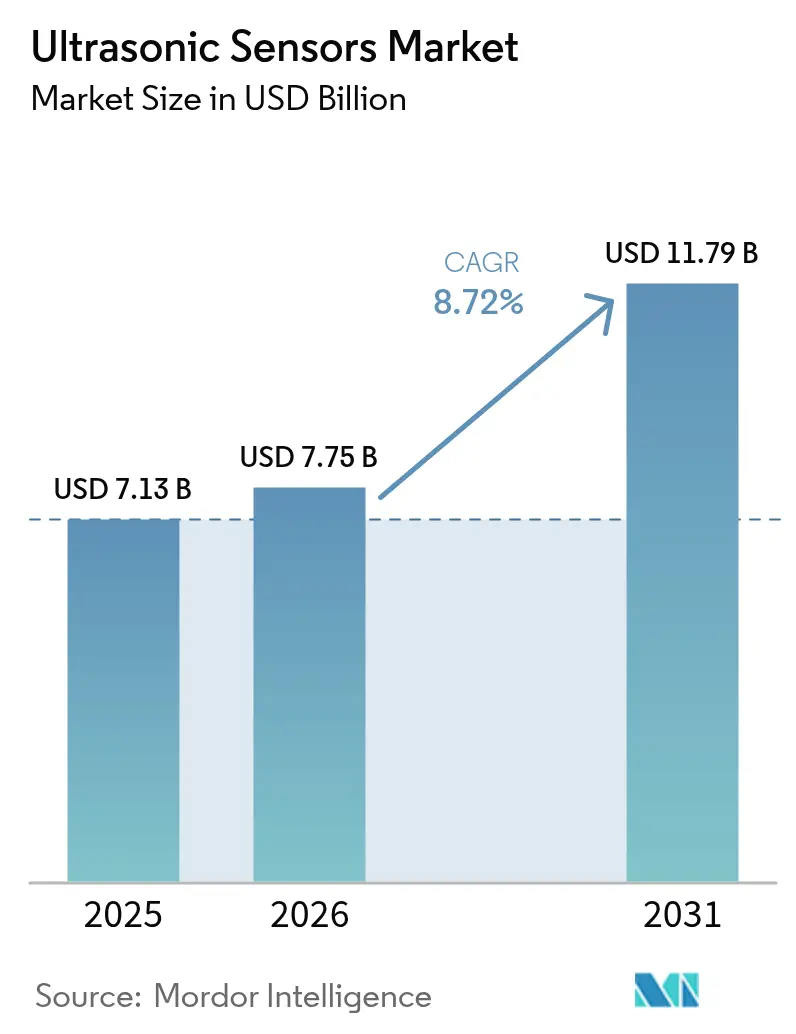
The ultrasonic sensors market size was valued at USD 7.13 billion in 2025 and estimated to grow from USD 7.75 billion in 2026 to reach USD 11.79 billion by 2031, at a CAGR of 8.72% during the forecast period (2026-2031). Rising investments in Industry 4.0 automation, mandatory automotive safety mandates, and growing acceptance of non-contact measurement technologies continue to pull demand upward. Precision sensing now underpins predictive maintenance initiatives that cut downtime and stabilize production yields. Automotive manufacturers integrate multi-sensor arrays to satisfy UNECE R159 and EU GSR2 rules, while water utilities deploy ultrasonic level probes to optimize treatment plant performance. High-frequency micromachined ultrasound transducers (MUTs) widen use cases in portable medical imaging and wearable devices, and regional diversification toward South American mining and infrastructure projects broadens the revenue base. Competitive intensity rises as suppliers embed artificial intelligence in signal-processing firmware to counter cross-talk and strengthen object classification accuracy.
Key Report Takeaways
- By technology, bulk piezoelectric transducers led with 64.30% of the ultrasonic sensors market share in 2025; micromachined ultrasound transducers are poised to expand at a 12.64% CAGR through 2031.
- By product type, proximity and distance sensors accounted for 39.40% of the ultrasonic sensors market's revenue in 2025, while level and depth sensors are projected to post a 11.58% CAGR through 2031.
- By range, short-range units held 54.30% of the ultrasonic sensor market size in 2025; the long-range sub-segment is projected to grow at a 10.63% CAGR to 2031.
- By mounting, in-line and threaded formats captured 69.10% share of the ultrasonic sensors market in 2025, whereas block sensors are advancing at a 10.02% CAGR.
- By operating frequency, low-frequency models represented 57.40% share of the ultrasonic sensors market, while high-frequency devices are rising at 12.12% CAGR.
- By end-user, industrial manufacturing accounted for a 27.60% share of the ultrasonic sensors market in 2025, and the automotive sector is projected to grow at a 11.08% CAGR to 2031.
- By geography, the Asia Pacific commanded a 37.60% share of the ultrasonic sensors market in 2025; South America is projected to track a 9.76% CAGR between 2026 and 2031.
Note: Market size and forecast figures in this report are generated using Mordor Intelligence’s proprietary estimation framework, updated with the latest available data and insights as of 2026.
Global Ultrasonic Sensors Market Trends and Insights
Drivers Impact Analysis*
| Driver | (~) % Impact on CAGR Forecast | Geographic Relevance | Impact Timeline |
|---|---|---|---|
| Rising installation of high-precision ultrasonic sensors in Industry 4.0 production cells | + 2.1% | Germany, Japan, South Korea, expanding globally | Medium term (2-4 years) |
| Mandatory front-rear obstacle-detection mandates in Chinese and EU passenger-car safety regulations | + 1.8% | China, European Union, spill-over to ASEAN | Short term (≤ 2 years) |
| Rapid adoption of non-contact level monitoring in smart water and wastewater utilities across GCC countries | + 1.3% | GCC, wider MENA | Medium term (2-4 years) |
| Use of high-frequency (> 200 kHz) MUT arrays in medical point-of-care imaging devices | + 1.6% | North America, Europe, emerging Asia-Pacific | Long term (≥ 4 years) |
| Deployment of corrosion-resistant PVDF probes in offshore wind O&M robots | + 0.9% | North Sea, Baltic Sea, US East Coast, Asian offshore | Long term (≥ 4 years) |
| AI-driven sensor-fusion algorithms that cut false positives in industrial and mobile robotics | + 1.0% | United States, Germany, Japan | Medium term (2-4 years) |
| Source: Mordor Intelligence | |||
Rising Installation of High-Precision Ultrasonic Sensors in Industry 4.0 Production Cells
Industry 4.0 cells now demand sub-millimeter accuracy, pushing suppliers to adopt capacitive MUTs that achieve > 400 kHz and 40% broader bandwidth than legacy ceramics. IO-Link enabled devices feed machine-learning models that cut unplanned downtime by 30% through condition-based alerts. Global manufacturers localize capacity, exemplified by Omron’s USD 9.2 million expansion in South Carolina, to shorten lead times for customized probes
Mandatory Front-Rear Obstacle-Detection Mandates in Chinese and EU Passenger-Car Safety Regulations
EU GSR2 and synchronized Chinese rules compel every new light vehicle to incorporate autonomous emergency braking and lane-keeping functions that rely on close-range ultrasonic sensing. Shipments leapt from 3 million units in 2009 to 200 million in 2023. Bosch couples ultrasonic, radar, and camera signals with AI fusion algorithms that distinguish pedestrians from static objects, meeting vulnerable road user requirements
Rapid Adoption of Non-Contact Level Monitoring in Smart Water and Wastewater Utilities Across GCC Countries
GCC utilities leverage ultrasonic level probes to mitigate water scarcity and cut maintenance. World Bank research highlights the water-energy nexus, urging desalination efficiency gains that ultrasonic devices deliver through non-intrusive, corrosion-resistant measurement documents1. Pepperl+Fuchs’ LoRaWAN-enabled WILSEN.sonic modules extend coverage across vast plants, allowing real-time overflow alerts. [2]Pepperl+Fuchs, “Wireless Ultrasonic Sensors,” pepperl-fuchs.com
Deployment of Corrosion-Resistant PVDF Probes in Offshore Wind O&M Robots
Offshore wind operators adopt polyvinylidene fluoride (PVDF) ultrasonic heads inside maintenance robots to detect blade erosion and sub-sea weld defects in saline environments. Early trials in the North Sea confirm lifetime extension of sensors despite constant spray exposure, supporting long-term O&M savings for European installations.
Restraints Impact Analysis*
| Restraint | (~) % Impact on CAGR Forecast | Geographic Relevance | Impact Timeline |
|---|---|---|---|
| Signal attenuation in multi-sensor ADAS clusters beyond 10 m ranges | –1.4% | Global premium vehicle programs | Short term (≤ 2 years) |
| Performance drift of piezoelectric stacks under −40°C Nordic operating conditions | –0.8% | Nordic countries, Northern Canada, Siberia | Medium term (2-4 years) |
| High fabrication cost of high-frequency MUT wafers for medical imaging | –0.7% | United States, Europe, Japan | Long term (≥ 4 years) |
| Supply-chain constraints for specialty piezoelectric materials (e.g., bismuth titanate and KNN) | –0.6% | Global, with acute exposure in Europe | Medium term (2-4 years) |
| Source: Mordor Intelligence | |||
Signal Attenuation in Multi-Sensor ADAS Clusters Beyond 10 m Ranges
High vehicle sensor density breeds ultrasonic cross-talk that lowers detection accuracy past 11 meters. Automotive designs now integrate 12-16 devices per car, widening interference risks. Research confirms that atmospheric variations magnify these effects, making radar or LiDAR pairing essential Sonair’s acoustic ranging and detection platform reduces sensor count by widening field-of-view to 180
Performance Drift of Piezoelectric Stacks Under −40°C Nordic Operating Conditions
Temperature swings alter dielectric constants and piezoelectric coefficients, degrading readings below −20°C. Nordic field tests call for heated housing or alternative materials. Bismuth titanate ceramics withstand high temperatures but raise cost, limiting use beyond specialty fleets.[3] MDPI, “Bismuth Titanate as an Ultrasonic Transducer for High Temperatures,” mdpi.com
*Our forecasts treat driver/restraint impacts as directional, not additive. The impact forecasts reflect baseline growth, mix effects, and variable interactions.
Segment Analysis
By Technology: MUT Arrays Drive Premium Applications
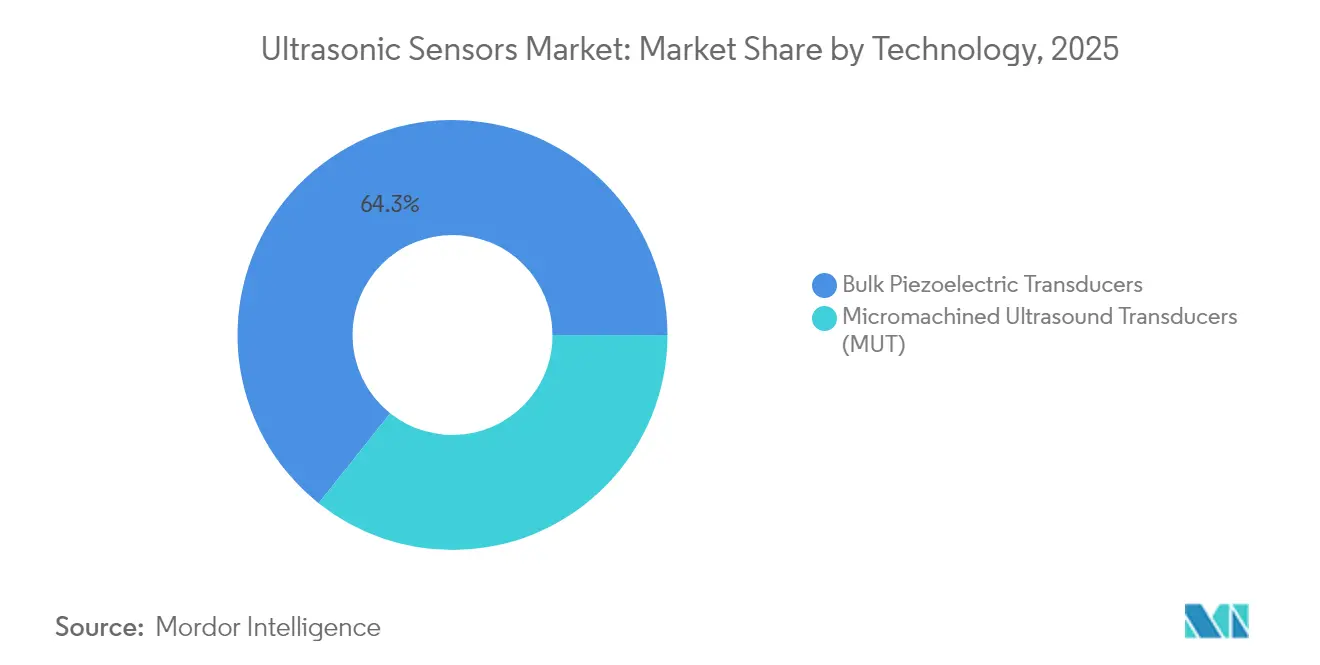
Bulk piezoelectric transducers retained a 64.30% ultrasonic sensors market share in 2025, anchored by economical mass production for automotive parking systems. The segment’s scale advantage keeps unit costs low. In contrast, MUT arrays are growing at 12.64% CAGR as medical imaging and precision robotics demand miniaturized high-frequency performance. The ultrasonic sensors market size tied to MUT technology is expected to swell sharply as PMUTs excel in air-coupled detection while CMUTs dominate liquid-coupled imaging.
The technology transition reflects physical limits in ceramic plates when shrinking form factors. Potassium sodium niobate PMUTs recorded 105.5 dB/V at 10 cm, outclassing aluminum nitride competitors . Integration with CMOS electronics simplifies on-chip beamforming that lowers total bill of materials for smart devices.


By Product Type: Level Sensors Gain Industrial Traction
Proximity and distance models captured 39.40% of 2025 revenue, favored for automotive bumpers and robot safety curtains. Level and depth sensors, however, are registering a 11.58% CAGR thanks to smart infrastructure projects. Continuous fluid-level insight curbs maintenance in water, chemical, and food facilities.
Wireless telemetry extends coverage to remote tanks, enabling predictive scheduling that trims service truck rolls. Transparent-liquid detection and through-wall sensing give ultrasonic probes an advantage over optical or float approaches, cementing market leadership across harsh industrial settings
By Range: Long-Range Applications Accelerate Growth
Short-range units (< 2 m) held 54.30% of ultrasonic sensors market size in 2025, serving core ADAS and factory safety fences. Long-range devices (> 10 m) are advancing at 10.63% CAGR as infrastructure managers seek wide-area monitoring. Microwave-inspired coding schemes now filter echoes so outdoor probes distinguish valid targets despite rain or mist.
TDK’s ICU-30201 achieves reliable 9.5 m reach at millimeter precision, making it attractive for warehouse automation and smart building occupancy analytics. Advanced field-programmable gate arrays further enhance gain control, expanding deployment in agriculture and traffic management.
By Mounting Type: Block Sensors Enable Flexible Installation
Traditional in-line and threaded formats held 69.10% share given their direct compatibility with pipes and machine housings. Retrofit-friendly block sensors are rising 10.02% annually as brownfield plants avoid disruptive pipe cutting. Clamp-on flow meters now underpin mature oilfield surveillance, providing real-time output without process interruption.
Wireless blocks mount externally on tanks, leveraging lithium batteries and mesh radios to support temporary field trials that validate process improvements before full capital commitment.
By Operating Frequency: High-Frequency Applications Drive Innovation
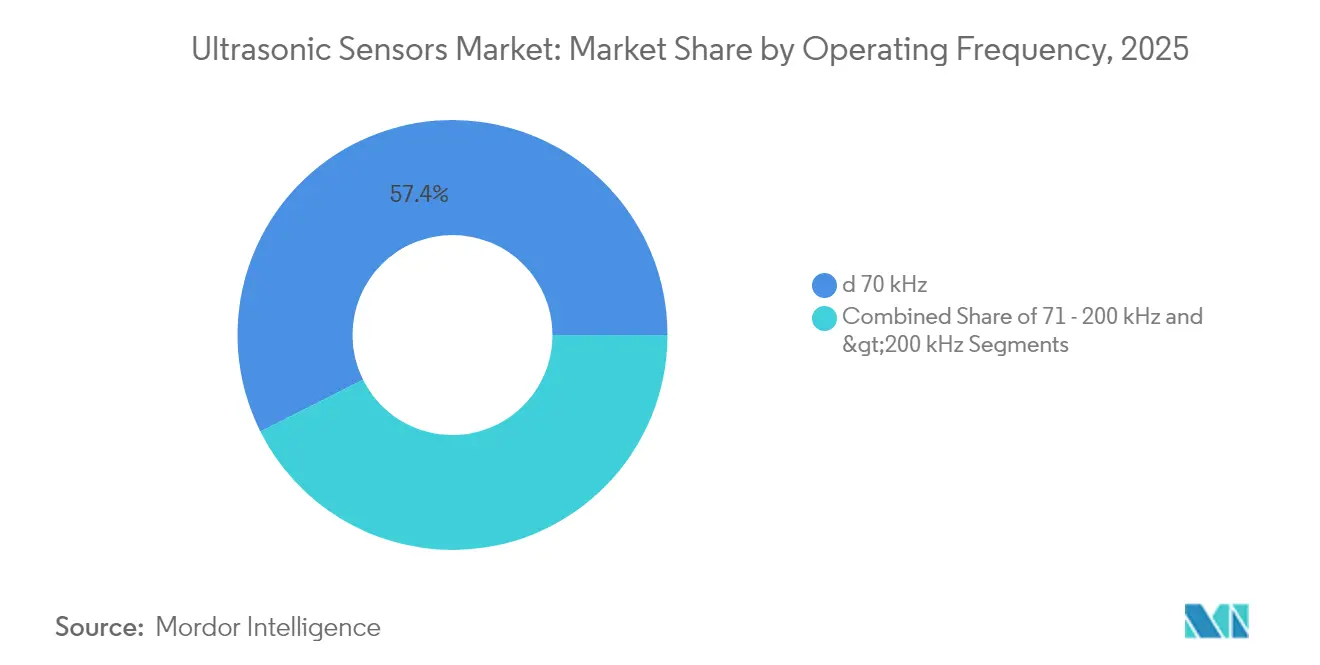
Low-frequency units (≤ 70 kHz) retained 57.40% share for applications requiring deep penetration or dusty-air tolerance. High-frequency devices (> 200 kHz) show a 12.12% CAGR supported by medical imaging demand. Frequency agility allows probes to sweep bands, combining near-field and far-field coverage in one package.
Portable scanners use > 5 MHz internally reflected waves for soft tissue diagnostics while industrial wafers deploy 300 kHz bursts for sub-millimeter inspection of semiconductor wafers.
By End-User Vertical: Automotive Mobility Accelerates Adoption
Industrial manufacturing led with 27.60% share in 2025, grounded in decades of automation spend. Automotive is growing 11.08% annually via mandatory safety features and autonomous capability roadmaps. Consumer electronics taps ultrasonic time-of-flight for gesture control, while agriculture leverages sensors for grain fill monitoring and livestock presence.
Medical adoption climbs as point-of-care devices shrink cost and power requirements, enhancing chronic disease management and remote examinations.
Geography Analysis
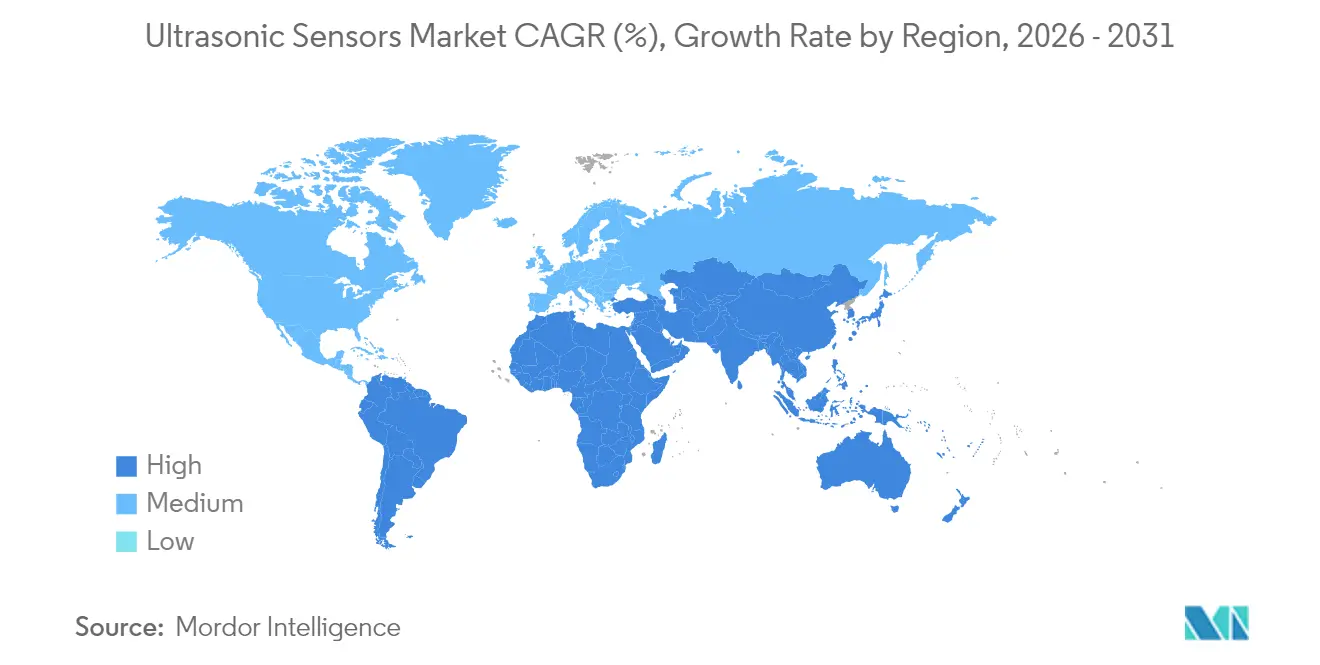
Asia secured 37.60% of 2025 revenue on the back of China’s vehicle electronics boom and Japan’s precision manufacturing heritage. Government mandates make ultrasonic proximity detection standard in new passenger cars, while semiconductor clusters enable native MUT fabrication. South Korea supplies sensor ASICs, and India’s affordable vehicle market increases penetration of cost-optimized designs. Policy-driven smart-city spending further embeds the ultrasonic sensors market in regional infrastructure rollouts.
North America concentrates on premium niches. The United States advances high-frequency probes for ambulatory diagnostics, while the aerospace sector exploits ruggedized units for structural health monitoring. Canada’s winter environment shapes demand for temperature-compensated stacks. FDA guidance streamlines approvals, bringing new platforms to bedside and home settings faster than in earlier regulatory cycles.
Europe blends regulatory leadership and industrial prowess. EU GSR2 triggers synchronized automotive demand, and Germany’s robotics clusters pioneer IO-Link enabled probes for real-time process feedback. Nordic utilities request heated sensor packages that withstand −40 °C, spurring material engineering breakthroughs. Meanwhile, South America posts the fastest 9.76% CAGR as mining firms automate remote sites and governments modernize water networks, enhancing need for resilient non-contact measurement.

Regulatory Landscape
Ultrasonic sensor compliance is application-led, with automotive and medical end uses subject to tighter safety and performance expectations than general industrial automation. In automotive, OEM sensor integration is shaped by mandates such as UNECE R159 and EU GSR2 for obstacle detection and driver-assistance functions, which increase validation requirements in multi-sensor environments and accelerate demand for sensor-fusion-ready architectures.
Standards activity is also tightening expectations around interoperability and verification. For medical diagnostic ultrasound equipment, IEC 60601-2-37:2024 (adopted as EN IEC 60601-2-37:2025) sets basic safety and essential performance requirements, while probe and inspection standards such as EN ISO 18563-2:2024 (phased array probe characterization) and EN ISO 16823:2025 (through-transmission testing methods) influence qualification and acceptance testing for industrial and NDT-related deployments. In hazardous industrial settings, regional approvals such as ATEX (EU), IECEx (international), and ANZEx (Australia/New Zealand) continue to act as gatekeepers for sensors used in mining, oil and gas, and process plants.
Value Chain Analysis
The ultrasonic sensors value chain begins with upstream materials and component suppliers, including piezoceramics and specialty polymers (for example, PVDF heads for harsh environments), alongside ASIC and firmware elements for signal processing, and packaging engineered for temperature, ingress, and chemical resistance. These inputs move to sensor OEMs and module makers that assemble bulk piezoelectric units and increasingly MUT-based devices, then validate performance through calibration and characterization tools aligned to standards (for example, IEC 62127-3 for hydrophone characteristics in ultrasonic fields, updated as IEC 62127-3:2022+AMD1:2026). Standardization forums and professional bodies also influence design targets and test practices, including work on phased-array methods and the transition toward lead-free piezoceramics as RoHS-related requirements evolve.
Downstream, suppliers sell through direct relationships with automotive, industrial automation, water utilities, and medical OEMs, as well as through indirect channels via authorized distributors and system integrators that bundle sensors into robotics, AGV safety, tank gauging, and IIoT solutions. Differentiation increasingly centers on connectivity (for example, IO-Link devices feeding factory analytics and LoRaWAN-enabled level sensing for distributed assets), while supply continuity can be affected by the availability of specialty piezoelectric materials and the lead times tied to precision manufacturing and application-specific customization.
Competitive Landscape
The ultrasonic sensors market shows moderate fragmentation as no single player dominates every niche. Keyence, Pepperl+Fuchs, and Sick AG leverage proven reliability and broad distribution, enabling rapid global delivery. Bosch, Denso, and Texas Instruments embed AI engines in sensor controllers, elevating object recognition and lowering false-positive rates. Start-ups such as Sonair introduce 3D acoustic ranging that trims sensor counts and system costs.
Strategic moves spotlight software differentiation. Bosch is investing EUR 2.5 billion in AI through 2027, positioning edge-processed data as a service for OEMs.[1] Robert Bosch GmbH, “AI that gets things moving,” bosch-presse.de BinMaster’s buyout of Senix broadens industrial level sensing lines, while Omron’s US plant targets rapid customization for North American clients. White-space opportunities remain in harsh offshore and Arctic domains, where PVDF heads and thermal compensation claim premium pricing.
Ultrasonic Sensors Industry Leaders
Keyence Corporation
Pepperl+Fuchs AG
Honeywell International Inc.
Baumer Ltd
Rockwell Automation Inc.
- *Disclaimer: Major Players sorted in no particular order

Market Opportunities and Future Outlook
Robotics and industrial automation create whitespace in safety-grade, 3D-aware ultrasonic perception that can reduce sensor count and simplify integration versus multi-modal stacks. Sonair’s ADAR One 3D ultrasonic sensor entering the North American market at MODEX 2026, followed by its announcement of industrial safety certification in July 2026, supports wider deployment in human-robot collaboration where functional safety alignment (including IEC 61508 and ISO 26262 practices) shapes purchasing decisions. This, in turn, creates room for suppliers that can deliver certified sensing, robust cross-talk mitigation, and software-defined beam shaping for crowded warehouses and mobile robotics fleets.
Beyond external proximity and level sensing, embedded ultrasound is beginning to open opportunity layers in tactile sensing and smart interfaces tied to Physical AI. UltraSense Systems launched an ultrasound-based tactile platform in April 2026, with evaluation kits scheduled from June 1, 2026, reflecting demand for integrated sensing within materials stacks and devices. On the supply side, capacity and capability expansion linked to specialized acoustics supports broader sensor availability: Sensor Technology Ltd. announced a new 73,000 sq ft manufacturing facility in Collingwood, Ontario (planned to support piezoelectric ceramics and underwater acoustic systems), while OKI disclosed a 3 billion yen plant expansion in Numazu to increase underwater acoustic sensor output, reinforcing investment momentum in higher-specification ultrasonic domains that overlap with industrial and infrastructure sensing needs.
Recent Industry Developments
- February 2026: Pepperl+Fuchs released the UB*-F42 series ultrasonic sensors with IO-Link connectivity for industrial IIoT use cases such as object detection, material consumption monitoring, and fill-level measurement. The launch supports the move toward networked ultrasonic sensing that enables remote parameterization and easier integration into Industry 4.0 production cells.
- May 2025: Sonair secured funding to develop a 3D ultrasonic sensor for autonomous mobile robots, positioned as a cost-reduction alternative to conventional LiDAR-based approaches. The financing backs continued productization of wide-field ultrasonic perception for robotics safety and navigation, where system cost and sensor count are key adoption barriers.
- October 2024: BinMaster acquired Senix Corporation to enhance its ToughSonic ultrasonic level measurement portfolio. The deal broadened product coverage in industrial level sensing and consolidated expertise in rugged ultrasonic designs used in tanks, silos, and harsh process environments.


Research Methodology Framework and Report Scope
Market Definition and Coverage
For this study, the ultrasonic sensors market is defined as revenue from sensors that use ultrasonic waves to detect distance, presence, or level, plus the related electronics sold as part of the sensing unit, across end-use industries.
Scope exclusions: The sizing excludes non-ultrasonic sensing technologies (for example, infrared or inductive sensors) even when they are used for similar distance or proximity use cases.
Segmentation Overview
- By Technology
- Bulk Piezoelectric Transducers
- Micromachined Ultrasound Transducers (MUT)
- PMUT (Piezo-MUT)
- CMUT (Capacitive-MUT)
- By Product Type
- Proximity and Distance Sensors
- Level/Depth Measurement Sensors
- Flow-measurement Sensors
- Ultrasonic Imaging Modules
- By Range
- Short-range ( < 2 m)
- Medium-range (2 - 10 m)
- Long-range ( > 10 m)
- By Mounting Type
- In-line / Threaded
- Block / Side-Looking
- Splice / Clamp-on
- By Operating Frequency
- <70 kHz
- 71 - 200 kHz
- > 200 kHz
- By End-user Vertical
- Industrial Manufacturing
- Automotive and Mobility
- Consumer Electronics and Appliances
- Medical and Healthcare
- Agriculture and Smart Farming
- Others (Oil and Gas, Marine, etc.)
- By Geography
- North America
- United States
- Canada
- Mexico
- South America
- Brazil
- Argentina
- Rest of South America
- Europe
- United Kingdom
- Germany
- France
- Italy
- Spain
- Nordics
- Rest of Europe
- Asia Pacific
- China
- Japan
- India
- South Korea
- Rest of Asia Pacific
- Middle East
- Saudi Arabia
- United Arab Emirates
- Turkey
- Rest of Middle East
- Africa
- South Africa
- Egypt
- Rest of Africa
- North America
Data Sources, Market Sizing, and Validation
Desk Research
Desk research was used to build the base structure of the model and to set realistic demand ranges by end-use. We relied on public sources such as industrial production and manufacturing output series from the World Bank and national statistics offices, along with trade and tariff databases that publish customs totals. For terminology and operating norms, we referenced standards bodies such as IEC and ISO.
We also reviewed company annual reports, investor presentations, product catalogs, and reputable engineering press coverage to understand typical pricing ladders, product refresh patterns, and adoption direction in automation and vehicles. In a few cases, paid subscriptions for company financials and news intelligence, patent databases, and shipment-level trade data were used to fill gaps where public disclosures were thin. These sources are not exhaustive, and we consulted additional public and paid references for cross-checking and clarification throughout the research process.
Primary Interviews and Surveys
Primary interviews and surveys were conducted with a mix of sensor suppliers, component ecosystem participants, channel partners, and end users that deploy these devices in factory automation, automotive, and process industries. Inputs from these conversations helped confirm what is counted as a sellable sensor unit versus an integrated module, how average selling prices move by range and frequency, and which applications are scaling faster by region.
We also used follow-up calls when desk research signals conflicted, so assumptions on volumes, replacement cycles, and adoption rates were not left as desk-based estimates.
Distribution of primary research fieldwork respondents
| Company type | Respondent position | Region |
|---|---|---|
| Top tier: 30% | CXOs: 17% | APAC: 51% |
| Mid tier: 48% | Functional/Unit leaders: 39% | EMEA: 30% |
| Smaller Players: 22% | Managers: 44% | Americas: 19% |
Market-Sizing & Forecasting
Sizing is anchored in a top-down reconstruction that starts from end-use activity pools where ultrasonic sensing is widely applied, then converts those pools into addressable demand using penetration and replacement logic. For example, production and installed-base indicators in automotive and industrial automation are translated into unit needs, mapped to typical sensor counts per system, and adjusted for retrofit and maintenance cycles.
To keep the numbers realistic, totals are checked using selective bottom-up approximations, such as sampling average selling prices by range and mounting type and applying them to derived shipment volumes, followed by channel checks on mix shifts. Key inputs used in the model include automation investment and factory output trends, vehicle production and parking-assist feature fitment direction, typical sensing range categories used in products, operating frequency preferences by application, and observed price compression as volumes scale. Where supplier disclosures were incomplete, gaps were handled by using conservative mix assumptions and then validating them through interview feedback before finalizing the market total.
For forecasting, scenario analysis is used and is supported by expert views on adoption timing, pricing progression, and regional manufacturing cycles. A base case is built first, then upside and downside paths are applied for variables such as feature penetration in vehicles and the pace of automation projects, so the final forecast remains explainable and repeatable.
Data Validation & Update Cycle
Validation is performed through triangulation across three angles: demand signals from end-use activity, supply-side revenue signals, and price-to-volume logic. Outliers are flagged early, then the assumptions that drive them, such as penetration rates, replacement cycles, or currency conversion timing, are reviewed again before internal sign-off.
We follow a multi-step analyst review to avoid dependence on a single viewpoint. Reports are refreshed annually, and interim updates are made when material events occur, including major capacity expansions, regulation shifts tied to industrial safety, or sharp changes in the automotive production outlook. Before delivery, a final pass is completed so clients get the most current view available at that time.
Mordor Intelligence's Ultrasonic Sensors Market Size Compared Against Other Published Estimates
Published market sizes for ultrasonic sensors often do not match because the counted item set differs, and because base years and forecast windows vary across publishers. Differences also come from how one estimate weights supplier narratives versus end-use demand signals like production and installed base.
Integrated sensing modules sold inside larger automation assemblies are not included in Mordor Intelligence's scope here, which can cause the 2025 value to look higher or lower compared with figures that blend module revenue with discrete sensor shipments. Gaps also come from how average selling prices are treated over time, how quickly automotive feature penetration is assumed to rise, and whether currency conversions are fixed to a single base year or updated during the forecast.
Benchmark comparison
| Source | Market Size | Gaps in Research Methodology |
|---|---|---|
| Mordor Intelligence | USD 7.13 B (2025) | |
| Global Consultancy A | USD 6.40 B (2025) | Uses a different base period and faster growth curve assumptions, and the scope description suggests some module-level revenue may be blended, which can shift the starting value and CAGR. |
| Trade Journal B | USD 4.87 B (2024) | Uses 2024 as the base year and a 2025-2030 window, and the size level appears more conservative due to tighter application coverage and different price-to-volume assumptions across regions. |
The table indicates that a one-year base shift, along with what gets counted as a sellable sensor versus a broader module, can move the headline number by billions. By anchoring the model to observable end-use activity and pressure-testing pricing and mix through interviews, the estimate stays traceable to explicit inputs and can be updated in a repeatable way when market conditions change.


Key Questions Answered in the Report
What is the current size of the ultrasonic sensors market?
The ultrasonic sensors market stands at USD 7.75 billion in 2026 and is projected to reach USD 11.79 billion by 2031.
Which technology segment is growing fastest?
Micromachined ultrasound transducers are expanding at a 12.64% CAGR through 2031, driven by medical imaging and precision industrial uses.
How do automotive regulations influence demand?
EU GSR2 and parallel Chinese mandates require obstacle-detection systems, boosting vehicle sensor shipments and accelerating integration of ultrasonic arrays.
Which region offers the highest growth outlook?
South America exhibits the fastest regional CAGR at 9.76% between 2026 and 2031, thanks to infrastructure and mining automation investments.
Page last updated on:






