
Market Overview
| Study Period | 2021 - 2031 |
|---|---|
| Forecast Data Period | 2026 - 2031 |
| Base Year Market Size (2025) | USD 1.69 Billion |
| Market Size (2026) | USD 1.78 Billion |
| Market Size (2031) | USD 2.33 Billion |
| Growth Rate (2026 - 2031) | 5.54 % |
| Market Concentration | Medium |
Major Players *Disclaimer: Major Players sorted in no particular order Image © Mordor Intelligence. Reuse requires attribution under CC BY 4.0. | |
United Kingdom Food Sweetener Market Analysis by Mordor Intelligence
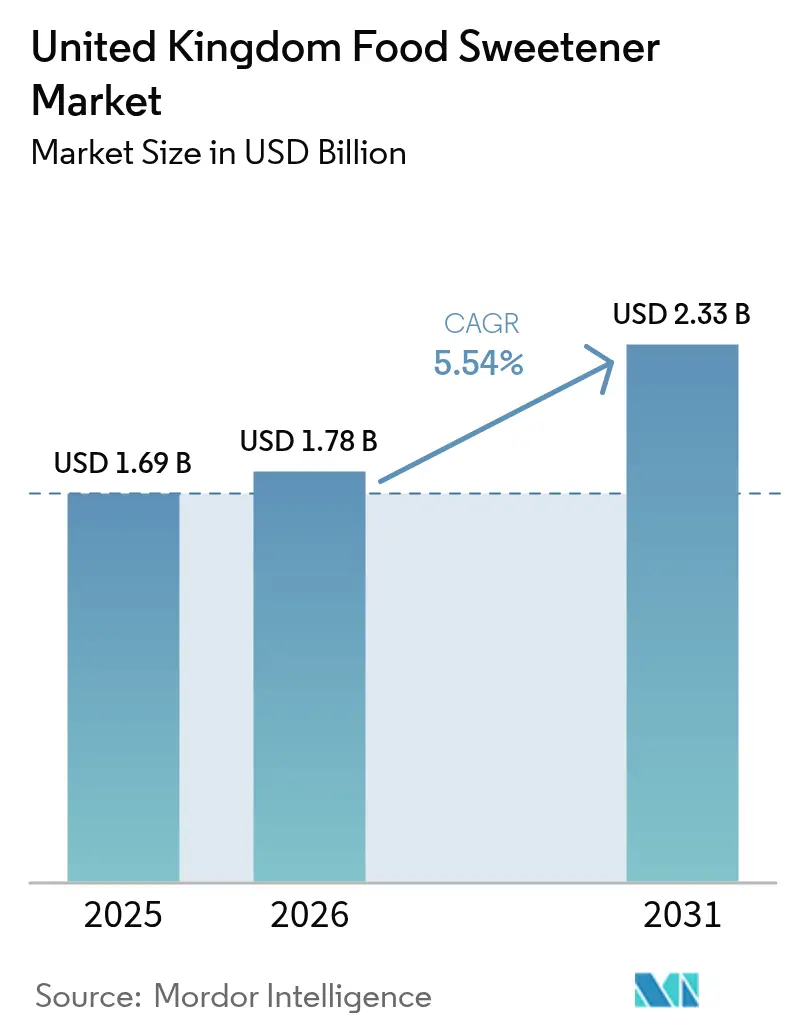
The United Kingdom food sweetener market size was valued at USD 1.69 billion in 2025 and estimated to grow from USD 1.78 billion in 2026 to reach USD 2.33 billion by 2031, at a CAGR of 5.54% during the forecast period (2026-2031). The market growth is driven by England's dominant position in the sweeteners industry, extensive research and development activities conducted by multinational suppliers, and significant retailer support for sugar-reduced private-label products. Natural high-intensity sweeteners, such as stevia and monk fruit, are gaining substantial market share following the Food Standards Agency's relaxation of novel-food regulations. Liquid sweetener formats enhance production efficiency and streamline manufacturing processes in soft-drink concentrates and sauce applications. Technological improvements in taste-modulation technologies, bio-conversion processes, and sweet proteins effectively address aftertaste challenges, enabling food and beverage brands to meet 2025 levy requirements while preserving the desired product taste profile [1].
Key Report Takeaways
- By product type, sucrose led with 47.62% of the United Kingdom food sweetener market share in 2025, whereas high-intensity sweeteners are forecast to grow at a 6.97% CAGR through 2031 across all regions.
- By application, bakery and confectionery accounted for 28.66% share of the United Kingdom food sweetener market in 2025, while beverages are projected to expand at a 6.62% CAGR to 2031.
- By form, powders dominated with a 43.78% share in 2025; liquid formats will rise at a 7.16% CAGR on the back of industrial processing advantages in England’s beverage hubs.
- By category, conventional variants commanded 93.12% share in 2025, yet organic sweeteners are poised for an 8.04% CAGR as premium clean-label demand widens.
- By region, England held an 80.12% share of the United Kingdom food sweetener market in 2025 and is set to maintain a 6.02% CAGR through 2031.
Note: Market size and forecast figures in this report are generated using Mordor Intelligence’s proprietary estimation framework, updated with the latest available data and insights as of 2026.
United Kingdom Food Sweetener Market Trends and Insights
Drivers Impact Analysis*
| Driver | (~) % Impact on CAGR Forecast | Geographic Relevance | Impact Timeline |
|---|---|---|---|
| Rising prevalence of obesity and diabetes | +1.2% | England-focused, spillover to Scotland and Wales | Medium term (2-4 years) |
| Sugar-tax driven shift to low-calorie alternatives | +1.8% | United Kingdom wide, strongest in England | Short term (≤ 2 years) |
| Clean-label demand driving plant-based sweetener adoption | +0.9% | England and Scotland primarily | Long term (≥ 4 years) |
| Rapid innovation in reduced-sugar food and beverage products | +0.7% | United Kingdom wide manufacturing hubs | Medium term (2-4 years) |
| Expanding functional foods and low-calorie beverage categories | +0.6% | England retail channels, urban centers | Medium term (2-4 years) |
| Government and regulatory support for sugar reduction initiatives | +0.9% | United Kingdom-wide policy implementation | Long term (≥ 4 years) |
| Source: Mordor Intelligence | |||
Rising Prevalence of Obesity and Diabetes
The high prevalence of overweight and obese adults in the United Kingdom generates substantial socio-economic costs annually. Government health policies encourage food manufacturers to reformulate products by limiting free-sugar content in daily energy consumption. This has increased sweetener usage in baked goods, cereals, and beverages. Manufacturers targeting price-sensitive consumer segments implement high-intensity sweetening systems to maintain affordable pricing while addressing public health requirements. The growing National Health Service (NHS) expenditure on diabetes management reinforces preventive nutrition programs, driving demand for sweeteners that preserve familiar taste profiles. [2].
Sugar-Tax Driven Shift to Low-Calorie Alternatives
The Soft Drinks Industry Levy has fundamentally transformed beverage formulations, achieving a 46% reduction in sugar content across affected products since implementation. Current regulatory proposals seek to strengthen the framework by lowering the taxable threshold to 4g per 100ml and eliminating existing milk-based exemptions [3]. More than 50% of beverage manufacturers have strategically reformulated their product portfolios to avoid financial penalties, demonstrating the levy's substantial influence in redirecting consumption patterns toward sweetener alternatives. Policymakers are actively considering extending the taxation framework to include biscuits and chocolate products, which would unlock significant new market opportunities in the sweetener industry. The consistent allocation of levy revenue to school sports programs continues to maintain strong cross-party political support, indicating a potential systematic expansion of the levy that may accelerate sweetener adoption across mainstream consumer brands and product categories.
Clean-Label Demand Driving Plant-Based Sweetener Adoption
Consumer preference for plant-derived ingredients continues to grow due to their perceived health benefits. This shift is particularly evident in developed markets, where health-conscious consumers actively seek natural alternatives to artificial sweeteners. The Food Standards Agency's 2024 reclassification of monk fruit extracts as non-novel ingredients removed regulatory barriers, enabling manufacturers to introduce premium natural sweetener combinations more efficiently into the market. This regulatory change has sparked innovation in product development, with companies launching new formulations that combine monk fruit with other natural sweeteners to achieve optimal taste profiles and functionality. [4]. Tate & Lyle's strategic collaboration with BioHarvest to enhance botanical production capabilities reinforces the industry-wide shift toward plant-based ingredients. Environmental impact studies demonstrate that stevia's carbon footprint is 90% lower than conventional sugar production, making it particularly attractive to environmentally conscious millennial consumers who prioritize sustainable food choices.
Rapid Innovation in Reduced-Sugar Food and Beverage Products
Technological developments in sweetener formulation are transforming product innovation across the food and beverage industry. Tate & Lyle introduced its advanced formulation tool 'Tate & Lyle Sensation, to help manufacturers optimize mouthfeel characteristics, maintain profit margins, and develop cleaner label products. Avansya, a strategic joint venture between DSM-Firmenich and Cargill, obtained regulatory approval for its fermentation-derived stevia sweeteners, expanding the portfolio of sugar reduction solutions in processed foods. In the confectionery segment, market research indicates that while 62% of consumers acknowledge healthier alternatives, only 10% regularly purchase them, revealing substantial growth potential for reformulated products. The FDA approval of innovative functional ingredients, particularly the sweet protein brazzein, provides manufacturers with enhanced capabilities to reduce sugar content while maintaining the indulgent taste profiles consumers expect.
Restraints Impact Analysis*
| Restraint | (~) % Impact on CAGR Forecast | Geographic Relevance | Impact Timeline |
|---|---|---|---|
| Consumer skepticism towards artificial sweeteners | -0.8% | United Kingdom-wide, stronger in rural areas | Medium term (2-4 years) |
| Taste profile and aftertaste issues | -0.6% | United Kingdom-wide consumer markets | Short term (≤ 2 years) |
| Price volatility in raw materials for natural sweeteners | -0.4% | Global supply chains affecting United Kingdom | Medium term (2-4 years) |
| Formulation complexity and product stability issues | -0.3% | United Kingdom manufacturing centers | Long term (≥ 4 years) |
| Source: Mordor Intelligence | |||
Consumer Skepticism Towards Artificial Sweeteners
The World Health Organization's 2024 advisory on non-sugar sweeteners' effectiveness in weight management heightened public scrutiny of aspartame and saccharin. While regulatory bodies consistently affirm these sweeteners' safety through scientific evidence, widespread media coverage has intensified consumer hesitation, particularly among parents concerned about long-term health effects. Natural sweetener manufacturers capitalize on this sentiment but command significant price premiums, creating a distinct two-tier market structure. Companies have responded by implementing comprehensive labeling practices and launching targeted consumer education initiatives. However, persistent concerns continue to impact sales of traditional artificial sweeteners, especially in rural areas where deep-rooted consumer trust issues and limited product awareness remain significant barriers to adoption.
Taste Profile and Aftertaste Issues
Rebaudioside A, the dominant commercial stevia compound, exhibits a persistent herbal aftertaste that impacts product formulation. This characteristic has prompted manufacturers to explore glycoside blends and advanced taste-masking solutions. Encapsulation technologies, such as CO² Sustain's TasteMod², effectively enhance sweetness distribution and temporal profiles in carbonated beverages. However, these solutions introduce additional production costs and formulation complexities. Small-scale bakeries, particularly those with limited technical resources, struggle to implement sophisticated multi-component sweetening systems, resulting in slower market adoption in artisanal segments. The industry continues to invest in research and development of alternatives, including fermentation-derived rebaudioside M and novel sweet protein solutions, though these innovations remain in early development and scaling phases.
*Our forecasts treat driver/restraint impacts as directional, not additive. The impact forecasts reflect baseline growth, mix effects, and variable interactions.
Segment Analysis
By Product Type: High-Intensity Sweeteners Challenge Sucrose Dominance
Sucrose maintains a 47.62% share of the United Kingdom food sweetener market in 2025, supported by established recipes and cost advantages. High-intensity sweeteners, including stevia, sucralose, and acesulfame-K, are growing at a 6.97% CAGR through 2031, driven by manufacturers' efforts to comply with sugar levies and reduce calorie content. The United Kingdom market for high-intensity sweeteners is expected to expand by approximately one-third, supported by Avansya's fermented reb-M products that combine natural ingredients with sugar-like taste characteristics. Starch hydrolysates and polyols provide medium-calorie alternatives, while xylitol and sorbitol maintain consistent demand in dental hygiene products like gums and mints. Allulose and tagatose await novel food approval, which could expand product options in the market.
Consumer demand for natural ingredients is prompting manufacturers to incorporate natural sweetener extracts. Monk fruit usage is expanding after receiving regulatory approvals, while the October 2024 collaboration between Tate & Lyle and Manus Bio aims to increase stevia Reb M production capacity. Although natural sweeteners have not reached price equivalence with bulk sugar, the fluctuating sugar prices are narrowing this cost gap. While World Health Organization discussions may affect aspartame usage, sucralose retains its market position in industrial baking applications, particularly in cake mix formulations, due to its heat stability properties.


By Form: Liquid Formats Gain Industrial Processing Advantages
Powder sweeteners dominated the market with a 43.78% share in 2025, driven by their convenience in dry mix applications. However, liquid sweeteners are growing at a 7.16% CAGR, as beverage manufacturers prefer their pump-metering precision and faster dissolution rates in high-volume production lines. The UK liquid sweeteners segment share continues to expand as concentrated syrups reduce storage costs. While crystal-coated particles enable controlled release in confectionery applications, they face manufacturing scale-up difficulties. New hybrid encapsulated formats combine the easy dispersion of liquids with the storage stability of powders.
Manufacturing facilities in the Midlands are transitioning to tanker deliveries of sucrose syrups and stevia solutions to minimize production interruptions. Powder formats maintain their importance in foodservice sachets and retail pouches where precise dosage and moisture resistance are essential. Increased regulatory requirements for microbiological safety in liquid sweeteners drive new investments in aseptic processing equipment.
By Category: Organic Sweeteners Command Premium Growth
The organic sweeteners segment in the United Kingdom is growing at 8.04% CAGR through 2031, driven by consumers willing to pay premium prices for natural and sustainable alternatives. Conventional sweeteners maintain market dominance with a 93.12% share in 2025. The clean-label trend is increasing organic sweetener adoption in premium food and beverage segments, as manufacturers market these products as healthier alternatives. In the UK, consumers are shifting toward healthier food choices as inflation moderates, particularly among younger consumers who prefer natural ingredients.
Organic certification requirements increase supply chain complexity and costs, limiting market penetration of organic sweeteners. However, growing consumer awareness of agricultural practices and environmental impacts drives demand for organic alternatives. Stevia and monk fruit remain the main organic sweetener options, as they are naturally sourced and require minimal processing. Conventional sweeteners maintain their cost advantages and broad applications, especially in price-sensitive segments and industrial uses where organic certification provides limited value.
By Application: Beverages Accelerate Past Traditional Bakery Leadership
Bakery and confectionery products maintain a 28.66% market share in 2025, supported by traditional formulations. The beverage segment experiences the highest sugar tax exposure, driving a 6.62% CAGR. Beverage manufacturers reformulate carbonated drinks, flavored waters, and hard seltzers using stevia, erythritol, and soluble fiber combinations to achieve sugar-like texture while avoiding tax implications. Companies like Britvic, now under Carlsberg ownership, implement dual-sweetener systems to optimize taste and costs in the on-trade segment.
The dairy and dessert categories increasingly use bulk polyols as sugar substitutes to maintain textural properties. In savory products, including soups, sauces, and dressings, manufacturers combine sucralose with flavor modulators to achieve balanced taste profiles while reducing sodium content. The functional foods and supplements segment incorporates sweet proteins and isomaltooligosacch

Geography Analysis
England holds an 80.12% market share in 2025 and is expected to grow at a 6.02% CAGR through 2031, supported by its large consumer population and significant beverage bottling operations in London, the Southeast, and the Midlands. The Soft Drinks Industry Levy has substantial influence as multinational companies operate major filling facilities, driving high adoption rates and increasing regional volumes. Urban health initiatives increase demand for zero-sugar colas and flavored waters in supermarkets, while coffee chains incorporate natural sweetener syrups.
The concentration of industry facilities improves supply chain efficiency, supporting timely tanker deliveries of liquid blends to manufacturers across Yorkshire and Lancashire. Scotland, Wales, and Northern Ireland represent 19.88% of market demand, each displaying unique development trends. Scotland's whisky and craft-soda industries utilize monk-fruit and erythritol to meet export sugar-reduction requirements, while functional snack manufacturers use polyols to achieve lower glycemic indices for outdoor-sports products.
Welsh dairy processors develop lactose-free, reduced-sugar yogurt products using stevia-allulose formulations. Northern Ireland benefits from the Windsor Framework, which simplifies sweetener imports from Great Britain while maintaining EU novel-food compliance, enabling cross-border trade opportunities. Rural areas demonstrate lower adoption of artificial sweeteners, but natural sweetener blends perform well in farm-shop products. Regional policies generally align with England's approach due to integrated retail networks, though local initiatives, such as Scottish government health grants, accelerate implementation in community food services.
Regulatory Landscape
Food sweeteners in Great Britain are regulated primarily through the Food Standards Agency (FSA) framework (England, Wales, and Northern Ireland) and Food Standards Scotland (FSS) for Scotland, with ministerial decisions finalizing authorisations following risk assessment. Assimilated Regulation (EC) No. 1333/2008 underpins permitted additive lists and conditions of use, while businesses are directed to use the FSA electronic register of authorised products and the approved additives and E-numbers guidance to verify permissions and specifications.
Recent changes and pathways are shaping sweetener choice and compliance. The June 2024 Food Additives and Novel Foods (Authorisations and Miscellaneous Amendments) and Food Flavourings (Removal of Authorisations) (England) Regulations updated elements of the authorisation framework. The FSA also published December 2024 risk management recommendations covering regulated products to support the GB authorisation process. In February 2026, Ministers approved authorisation of E 960b(ii) (steviol glycosides from fermentation) and restated conditions of use and specifications for E 960a, E 960b, and E 960c, which provides a clearer route for fermentation-derived stevia ingredients. Northern Ireland can differ for certain authorisations under the Windsor Framework, requiring suppliers serving both GB and NI to manage dual compliance for specific sweetener variants.
Competitive Landscape
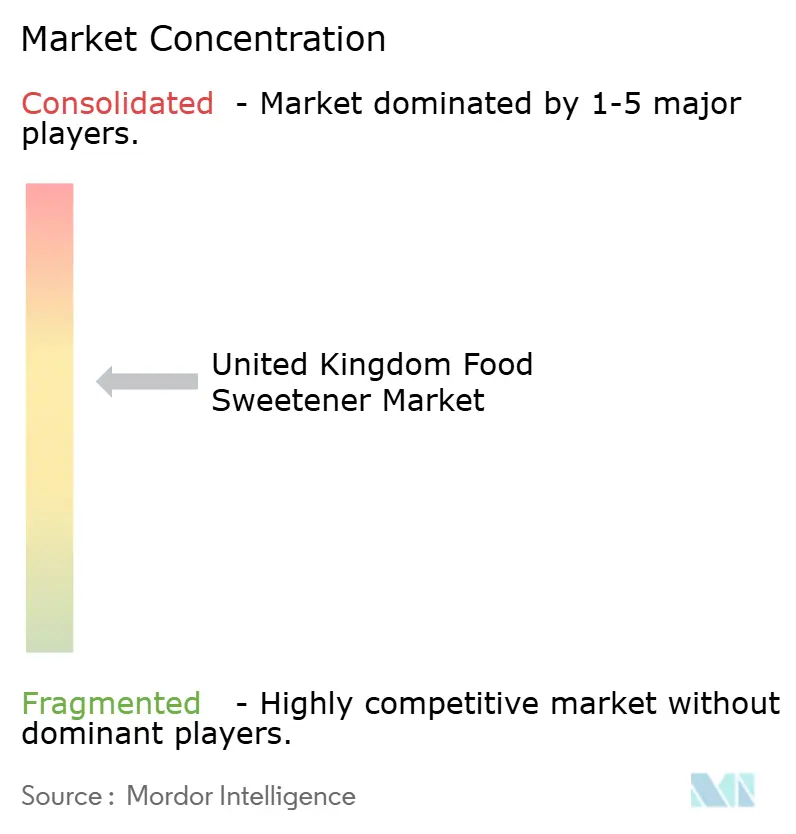
The United Kingdom food sweetener market maintains moderate concentration, with multinational companies holding extensive portfolios while accommodating specialized natural sweetener producers. The Natural Sweetener Alliance between manufacturers secures stevia supply across the Americas, reducing dependence on Asian crops and strengthening sustainability practices. In January 2024, Cargill and DSM-Firmenich's joint venture, Avansya, began producing high-purity reb-M through fermentation, delivering improved taste profiles.
Ingredion and ADM strengthen their distribution networks through co-processing agreements with bakery premix manufacturers, combining functional fibers with sweetener systems to comply with fiber-enrichment labeling requirements. PureCircle maintains its advantage through integrated stevia leaf farming operations, while Evolva develops nootkatone and vanillin biotechnology processes that complement sweet-protein sweeteners. The technology competition increases as start-ups develop sweet-protein brazzein synthesis methods, and encapsulation companies patent micro-layering techniques to reduce reb-A bitterness. Retail-driven reformulation schedules require suppliers to provide complete solution packages, including taste modulators, bulk replacers, and clean-label stabilizers, to accelerate private-label product development.
While raw-material price fluctuations and public health communications present competitive challenges, companies with diverse sweetener portfolios, comprehensive regulatory documentation, and local technical support teams maintain competitive advantages over specialized firms. The UK sweeteners market attracts mergers and acquisitions as companies aim to achieve economies of scale, expand their natural product portfolios, and enhance their application expertise.
United Kingdom Food Sweetener Industry Leaders
-
Tate & Lyle PLC
-
Cargill Inc.
-
ADM
-
Ingredion Inc.
-
Tereos S.A.
- *Disclaimer: Major Players sorted in no particular order
Market Opportunities and Future Outlook
Sugar reduction policy and levy mechanics remain a direct commercial lever for reformulation programs, particularly in beverages where the Soft Drinks Industry Levy (SDIL) under the Finance Act 2017 applies to soft drinks with 5g of sugar or more per 100ml. This sustains demand for high-intensity systems and blend strategies that meet taste and mouthfeel targets while lowering free sugars, with England benefiting from concentrated beverage production hubs and retailer-led reformulation schedules. The February 2026 authorisation of fermentation-derived steviol glycosides (E 960b(ii)) in Great Britain also expands the compliant toolkit available for stevia-based solutions with improved sensory performance.
The opportunity set is shifting from simple sugar replacement toward sweetness strategies that brands can substantiate with data. SACN issued a 2025 statement recommending that intake of non-sugar sweeteners be minimized, which elevates the value of solutions that reduce overall sweetness intensity while supporting front-of-pack and ingredient-list objectives. Monitoring of non-sugar sweetener intake remains limited, including child-intake survey data dating back to 2003 and a National Diet and Nutrition Survey not designed to quantify NSS consumption. This creates room for ingredient suppliers and brand owners to support measurement, disclosure, and reformulation documentation. On the supply side, initiatives such as Tate & Lyle launching Yume M under The Sweetener Alliance with Manus (February 2026) and expanding work with BioHarvest (May 2026) point to continued investment in next-generation plant-based molecules that can be positioned for cleaner-label demand while meeting additive authorisation conditions across GB and NI.
Recent Industry Developments
- May 2026: Tate & Lyle expanded its collaboration with BioHarvest Sciences to work across multiple plant-based sweetener molecules, extending beyond a single ingredient focus. The move deepens the companys pipeline for next-generation sweeteners and supports broader formulation options for UK customers seeking sugar reduction with improved taste performance.
- May 2025: Avansya (the Cargill and dsm-firmenich joint venture) announced that its EverSweet stevia sweetener received formal approval for use in the UK and EU. This approval expands commercial availability of fermentation-derived stevia solutions for UK food and beverage reformulation programs that prioritize sugar-like taste profiles.
- July 2024: Tate & Lyle introduced OPTIMIZER STEVIA 8.10, positioned as a stevia composition designed for sugar replacement. The launch strengthens its stevia portfolio for manufacturers balancing levy-driven sugar reduction with taste and cost considerations across beverages and other high-volume applications.
Research Methodology Framework and Report Scope
Market Definition and Coverage
For this study, the UK food sweetener market is defined as the value of sweetening ingredients sold for use in food and beverage formulations across the United Kingdom, covering both caloric sugars and sugar substitutes in common commercial forms.
Scope exclusions: We exclude non-food uses (such as pharma-grade excipients, tabletop packs sold purely for home consumption, and industrial uses outside food and drinks) where they are not part of the food ingredient demand pool.
Segmentation Overview
- By Product Type
- Sucrose
- Starch Sweeteners and Sugar Alcohols
- Dextrose
- High Fructose Corn Syrup (HFCS)
- Maltodextrin
- Sorbitol
- Xylitol
- Other Starch Sweeteners and Sugar Alcohols
- High-Intensity Sweeteners
- Artificial High-Intensity Sweeteners
- Sucralose
- Aspartame
- Saccharin
- Neotame
- Cyclamate
- Acesulfame Potassium (Ace-K)
- Other Artificial HIS
- Natural High-Intensity Sweeteners
- Stevia Extract
- Monk Fruit Extract
- Other Natural HIS
- Artificial High-Intensity Sweeteners
- Other Sweeteners
- By Application
- Bakery and Confectionery
- Dairy and Desserts
- Beverages
- Soups, Sauces, and Dressings
- Other Applications
- By Form
- Powder
- Liquid
- Crystal
- By Category
- Conventional
- Organic
- By Region
- England
- Scotland
- Wales
- Northern Ireland
Data Sources, Market Sizing, and Validation
Desk Research
Desk work starts with building a clean fact base on the UK sweetener landscape, and then mapping it to demand signals in packaged foods and beverages. We reviewed public sources such as the UK Office for National Statistics, HM Revenue and Customs trade statistics, Food Standards Agency publications, and peer reviewed articles that track sweetener functionality, reformulation, and labeling outcomes.
To anchor the model in real market behavior, we also relied on manufacturer and importer websites, investor presentations, annual reports, and reputable press coverage on sugar reduction programs and product launches. In parallel, paid database subscriptions were used selectively for company financials, patent screening, and shipment-level import and export checks to sanity-test volumes and price direction. The desk sources described here are illustrative rather than exhaustive, and additional public references were also used to collect data, validate assumptions, and clarify open questions.
Primary Interviews and Surveys
Primary work focused on validating how sweeteners are actually purchased and priced in the UK food chain, and how mix shifts are happening across sucrose, starch sweeteners, sugar alcohols, and high intensity sweeteners. We spoke with a spread of ingredient suppliers, distributors, and food and beverage formulators, and we also tested assumptions with industry experts who track regulations, reformulation targets, and procurement cycles.
Coverage was built across the UK nations so that consumption patterns in England are not automatically applied to Scotland, Wales, and Northern Ireland without checks, and any unclear desk inputs were revisited until the model assumptions lined up with market reality.
Distribution of primary research fieldwork respondents
| Company type | Respondent position |
|---|---|
| Top tier: 27% | CXOs: 12% |
| Mid tier: 51% | Functional/Unit leaders: 28% |
| Smaller Players: 22% | Managers: 60% |
Market-Sizing & Forecasting
Sizing is built with a top-down and bottom-up model, where UK food and beverage output and trade indicators are used to reconstruct the addressable sweetener demand pool, followed by application-level splits that reflect where sweeteners are used most consistently. Only after this structure is stable do we corroborate it with selective bottom-up checks, such as supplier revenue direction, sampled price per kilogram by type and form, and channel discussions that confirm typical buying units.
Key inputs used in the model include food and beverage production trends, import and export movement for major sweetener categories, reformulation activity linked to sugar reduction, the mix shift between caloric sugars and high intensity options, and price movements by form (powder, liquid, crystal) that can change realized value even when volumes are stable. Where primary inputs showed gaps, we applied conservative ranges and then narrowed them through follow-up calls so the final totals stay traceable.
For forecasting, scenario analysis was used, and each scenario was tied to practical drivers that respondents could validate, like expected reformulation pace, penetration of natural high intensity sweeteners, and pricing pass-through assumptions. The final forecast is then kept consistent with the observed direction of volumes, mix, and pricing rather than relying on a single growth curve.
Data Validation & Update Cycle
Validation is done in layers so that the market number is not accepted just because one source looks credible. We cross-check outputs against independent signals such as trade flows, category demand in major food applications, and price movement direction, and then any unusual jumps are reviewed again to see if they come from mix shifts, currency timing, or a modeling error.
Before sign-off, the work is reviewed by another analyst who challenges the main assumptions and asks for a clear audit trail back to the inputs. Reports are refreshed annually, and interim updates are made when material events affect pricing, regulations, or demand patterns. Right before delivery, a final pass is completed so clients receive the latest updated view.
Mordor Intelligence's UK Food Sweetener Market Market Sizing Compared With Other Published Estimates
Published market sizes for UK sweeteners can look far apart because the counted product basket is not always the same, and the same word is sometimes used for different ingredient groups. Differences also come from the base year selected, how price progression is carried into value, and whether application splits are tested with real procurement behavior.
Some external estimates seem to roll up a wider sweeteners universe that is not limited to food ingredient demand, and they may also include retail sweeteners in the same total. For Mordor Intelligence, the value is limited to sweeteners used as food and beverage ingredients in the UK, and the totals are checked against import and export movement and application-level consumption signals before they are finalized.
Benchmark comparison
| Source | Market Size | Gaps in Research Methodology |
|---|---|---|
| Mordor Intelligence | USD 1.69 B (2025) | |
| Global Publisher A | USD 4.58 B (2024) | Uses a broader sweeteners definition and appears to combine multiple end uses and product groups, which can inflate value versus a food ingredient-only view. The base year and pricing assumptions are also different, which shifts the starting point. |
| Industry Publisher B | USD 0.50 B (2025) | Looks closer to a narrower subset and may undercount conventional sugars and several bulk sweetener formats, leading to a smaller total. The approach also suggests limited validation on application demand and mix, which can compress the value estimate. |
The spread in the table is mainly explained by what gets counted as a sweetener market and how pricing and mix are carried into the stated year. By keeping inputs linked to observable demand and trade signals, and then re-checking outliers before sign-off, the final value stays repeatable and easier to reconcile when assumptions change.
Key Questions Answered in the Report
What is the current value of the UK food sweeteners market?
The UK food sweeteners market stands at USD 1.78 billion in 2026 and is forecast to hit USD 2.33 billion by 2031.
How will the soft drinks industry levy impact sweetener demand?
The levy’s lower sugar threshold and likely expansion to milk drinks force beverage makers to reformulate rapidly, boosting high-intensity sweetener uptake and stimulating a 6.62% CAGR in beverage applications to 2031.
Which sweetener segment is growing fastest?
High-intensity natural solutions such as advanced stevia extracts and monk-fruit blends are posting a 6.97% CAGR, outpacing all other product categories.
Which region dominates UK sweetener consumption?
England accounts for 80.12% of demand thanks to its dense population, beverage production hubs and retail headquarters, and is projected to sustain 6.02% CAGR through 2031.