UK EV Battery Pack Market Size and Share
Market Overview
| Study Period | 2017 - 2029 |
|---|---|
| Base Year For Estimation | 2024 |
| Forecast Data Period | 2025 - 2029 |
| Market Size (2025) | USD 1.25 Billion |
| Market Size (2029) | USD 1.15 Billion |
| Growth Rate (2025 - 2029) | -1.96% CAGR |
| Market Concentration | Low |
Major Players*Disclaimer: Major Players sorted in no particular order Image © Mordor Intelligence. Reuse requires attribution under CC BY 4.0. | |

UK EV Battery Pack Market Analysis by Mordor Intelligence
The UK EV Battery Pack Market size is estimated at 1.25 billion USD in 2025, and is expected to reach 1.15 billion USD by 2029, growing at a CAGR of -1.96% during the forecast period (2025-2029).
The United Kingdom's electric vehicle battery pack industry is undergoing a transformative phase driven by substantial governmental support and technological advancement. The government's commitment to phase out new petrol and diesel vehicle sales by 2030, followed by the requirement for all new vehicles to be zero-emission by 2035, has created a robust foundation for market growth. This transition is supported by comprehensive incentive programs, including the Plug-in Car Grant covering up to 35% of vehicle costs (maximum GBP 2,500) and the Electric Vehicle Homecharge Scheme funding up to 75% of charging point installation costs. These initiatives have created a favorable environment for both manufacturers and consumers, accelerating the adoption of electric vehicles and their associated electric vehicle battery technologies.
The domestic battery manufacturing landscape is experiencing significant evolution with the establishment of new production facilities and technological partnerships. A notable development is the construction of the country's first gigafactory by Britishvolt in Northumberland, marking a crucial step toward establishing a robust domestic electric vehicle battery supply chain. The industry has witnessed substantial improvements in battery technology, with average EV battery pack sizes increasing to over 60 kWh, enabling extended driving ranges and enhanced vehicle performance. This technological progression has been accompanied by optimization in manufacturing processes, contributing to improved efficiency and reduced production costs.
The market is characterized by increasing emphasis on sustainable and efficient battery solutions, with manufacturers focusing on developing advanced battery chemistries and innovative production methods. Battery costs currently constitute between 30-50% of an electric vehicle's total price, driving manufacturers to invest in research and development to optimize cost structures while maintaining performance standards. The industry is witnessing a shift toward more sophisticated battery management systems, enhanced thermal management solutions, and improved energy density capabilities, all contributing to the overall advancement of electric car battery technology.
The infrastructure development supporting the electric powertrain and battery ecosystem has become increasingly robust, with significant investments in charging networks and support facilities. The government's commitment to expanding the charging infrastructure has been matched by private sector initiatives, creating a comprehensive network to support the growing electric vehicle fleet. This infrastructure development has been complemented by advancements in battery charging technologies, including faster charging capabilities and improved battery longevity. The industry has also seen the emergence of innovative business models, including battery leasing and recycling programs, contributing to the overall sustainability and economic viability of electric vehicle adoption.
UK EV Battery Pack Market Trends and Insights
THE LEADING PLAYERS SHAPING THE ELECTRIC VEHICLE MARKET IN THE UNITED KINGDOM ARE TOYOTA GROUP, TESLA, KIA, HYUNDAI, AND BMW
- The electric vehicle battery pack market in the United Kingdom is competitive. In 2022, five companies dominated the market, holding over 45% of the market share. These front-runners are Toyota Group, Tesla, Kia, Hyundai, and BMW. The Toyota Group leads the pack, boasting about 16.86% market share, establishing itself as the top seller of electric vehicles. With its diverse product range, extensive service network, and robust brand reputation, Toyota continues to strengthen its market position.
- Tesla, capturing approximately 9.57% of the UK electric vehicle battery pack market, stands as the second-largest electric vehicle seller in the country. The company's innovative strategies and its broad range of solely electric cars solidify its stance. Following closely, Kia takes the third spot with about 7.53% of the market share in the UK electric vehicle battery pack market. With a varied product lineup catering to different customer segments, Kia benefits from a well-structured supply and distribution chain.
- In fourth place, Hyundai claims around 7.47% of the market share in the UK electric vehicle market. Its diverse offerings appeal to both mid-range and premium customers, resulting in a loyal customer base. BMW is in the fifth position, holding a market share of approximately 6.66%. Other notable players in the UK electric vehicle market include Volkswagen, Honda, MG, Renault, and Audi.

EV SALES IN THE UNITED KINGDOM ARE LED BY TESLA AND TOYOTA, WITH THE HIGHEST DEMAND FOR BATTERY PACKS
- The demand for electric vehicles in the UK electric vehicle battery pack market has surged in recent years, resulting in boosting the demand for batteries. Numerous brands and models populate the market in the United Kingdom. In 2022, the top five contenders in the UK electric vehicle battery pack market were the Tesla Model Y, the Toyota Vitz (Yaris), the Tesla Model 3, the Toyota Corolla, and the Toyota CH-R. Leading the chart, the Tesla Model Y sold 35,551 units, with its extended range, spacious seating, and generous cargo space making it a consumer favorite.
- Toyota's Vitz, better known as Yaris, was in the second spot in the UK electric vehicle battery pack market with 22,051 sales. Its hybrid powertrain and affordability cater to those seeking a compact electric option. Close behind, the Tesla Model 3 secured third place in the electric vehicle battery pack market in the country, logging 19,071 sales. Offered in both rear-wheel drive and performance trims, its robust performance captivates many customers.
- Fourth in line, the Toyota Corolla registered 18,594 sales in the United Kingdom. Its hybrid powertrain and competitive pricing continue to lure customers. In the fifth position, the Toyota CH-R marked 17,440 sales across the United Kingdom. Other significant players in the UK electric vehicle battery pack market include the Toyota Yaris Cross, Hyundai Tucson, Kia Niro, and Honda Fit.

OTHER KEY INDUSTRY TRENDS COVERED IN THE REPORT
- POLICIES AND INCENTIVES BY THE UK GOVERNMENT ARE DRIVING A SURGE IN ELECTRIC VEHICLE SALES
- DECLINING LITHIUM-ION BATTERY PRICES ARE PROPELLING ELECTRIC VEHICLE ADOPTION IN THE UNITED KINGDOM
- FROM 2017 THROUGH 2022, UK BATTERY PRICES FELL STEADILY DUE TO TECHNOLOGICAL ADVANCES, ECONOMIES OF SCALE, AND COMPETITION IN THE MARKET
- INTERNATIONAL COMPANIES ARE DRIVING ELECTRIFICATION IN THE UNITED KINGDOM WITH NEW EV MODELS, EXPANDING THE ELECTRIC VEHICLE MARKET
- THE UK ELECTRIC VEHICLE BATTERY PACK MARKET IS CHARACTERIZED BY THE DOMINANCE OF NMC BATTERIES AND GROWING DEMAND FOR NCA AND NCM CHEMISTRIES
- POTENTIAL BAN ON INTERNAL COMBUSTION ENGINES IN THE UNITED KINGDOM IS DRIVING ELECTRIC VEHICLE ADOPTION AND DEMAND FOR BATTERY MATERIALS
- IMPROVEMENTS IN BATTERY TECHNOLOGY ARE A DRIVING FORCE BEHIND THE INCREASING POPULARITY OF ELECTRIC VEHICLES IN THE UNITED KINGDOM
Segment Analysis: Body Type
Passenger Car Segment in UK EV Battery Pack Market
The passenger car segment dominates the UK EV battery pack market, commanding approximately 63% market share in 2024. This substantial market position is driven by increasing consumer adoption of electric vehicles, supported by government incentives and expanding charging infrastructure across the United Kingdom. The segment's growth is further bolstered by major automotive manufacturers expanding their electric vehicle portfolios, offering a wider range of models across different price points. The UK government's commitment to phase out new petrol and diesel car sales by 2030 has accelerated the transition to electric vehicles, particularly in the passenger car segment. Additionally, technological advancements in battery technology have led to improved range and performance, making electric passenger vehicles more attractive to consumers.
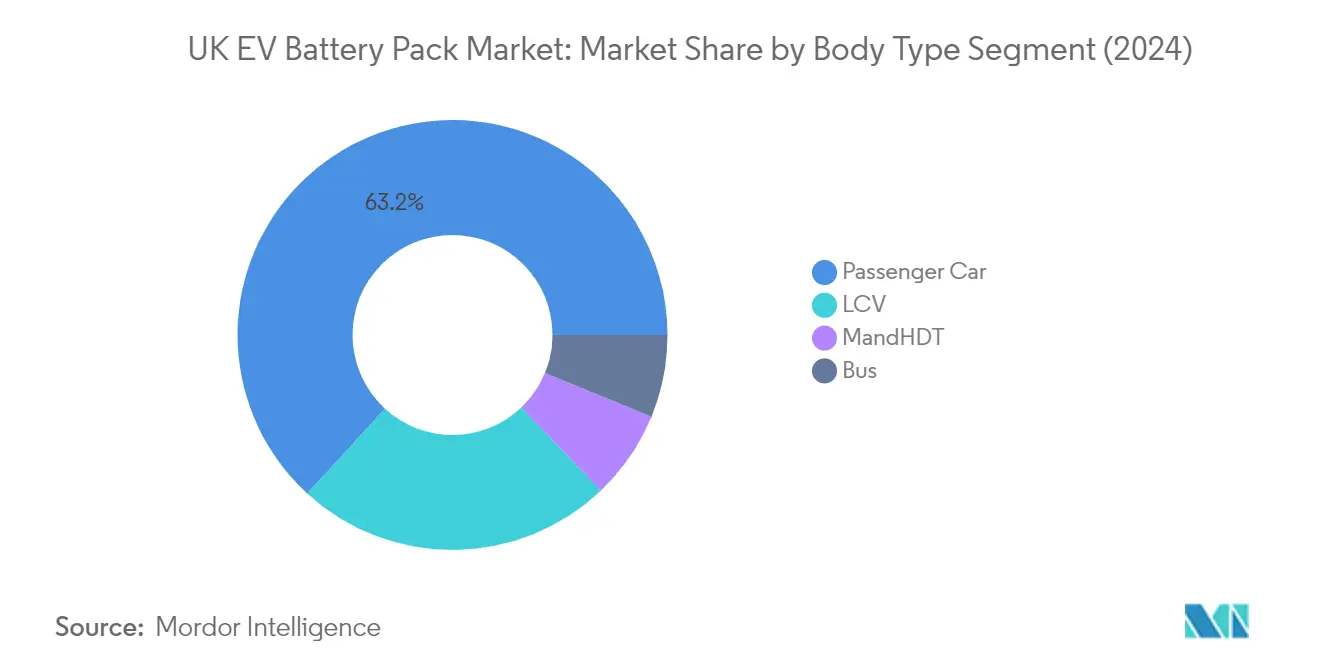
M&HDT Segment in UK EV Battery Pack Market
The Medium and Heavy-Duty Truck (M&HDT) segment is emerging as the fastest-growing segment in the UK EV battery pack market, with a projected growth rate of approximately 38% during 2024-2029. This remarkable growth is driven by increasing emphasis on sustainable logistics and transportation solutions across the United Kingdom. Fleet operators are increasingly transitioning to electric trucks to comply with stringent emission regulations and reduce operational costs. The segment's growth is supported by advancements in battery technology that enable longer range and higher payload capacity, making electric trucks more viable for commercial operations. Government initiatives promoting clean transportation and supporting infrastructure development for heavy-duty electric vehicles are further accelerating this segment's expansion.
Remaining Segments in Body Type
The Light Commercial Vehicle (LCV) and Bus segments play crucial roles in the UK EV battery pack market's diversification. The LCV segment is particularly significant in urban delivery and last-mile logistics, benefiting from the growing e-commerce sector and increasing demand for sustainable urban delivery solutions. The Bus segment, while smaller in market share, is instrumental in public transportation electrification initiatives across major UK cities. Both segments are witnessing increased adoption driven by municipal environmental policies, fleet electrification programs, and the overall push towards sustainable urban mobility solutions. These segments complement the market's broader transition to electric mobility, offering specialized solutions for different transportation needs.
Segment Analysis: Propulsion Type
BEV Segment in UK EV Battery Pack Market
Battery Electric Vehicles (BEVs) have established an overwhelming dominance in the UK EV battery pack market, commanding approximately 99% of the total market share in 2024. This commanding position can be attributed to several factors, including the superior performance characteristics of BEV battery packs, which typically offer ranges between 200-300 km on a single charge. The segment's growth is further bolstered by the UK government's ambitious commitment to phase out new petrol and diesel vehicle sales by 2030, coupled with substantial financial incentives and tax benefits for BEV adoption. Major automotive manufacturers are increasingly focusing their R&D efforts on BEV technology, with companies like Tesla, BMW, and Volkswagen leading the charge in battery innovation and efficiency improvements. The extensive development of charging infrastructure across the United Kingdom, marked by the government's pledge to install 300,000 public charging points by 2030, has also played a crucial role in boosting consumer confidence in BEV technology.
PHEV Segment in UK EV Battery Pack Market
The Plug-in Hybrid Electric Vehicle (PHEV) segment, while currently holding a smaller market share, is demonstrating remarkable growth potential in the UK EV battery pack market. The segment is projected to experience substantial expansion between 2024 and 2029, driven by technological advancements in battery efficiency and hybrid powertrain systems. PHEVs are increasingly being viewed as an effective transitional technology, offering consumers the flexibility of both electric and conventional driving modes while the charging infrastructure continues to expand. The segment's growth is supported by ongoing developments in battery technology, particularly in areas of energy density and charging efficiency. Major automotive manufacturers are investing in PHEV technology development, recognizing its role in meeting diverse consumer needs and regulatory requirements. The UK government's supportive policies, including grants and tax incentives for low-emission vehicles, continue to encourage PHEV adoption among consumers who seek a balance between environmental consciousness and practical driving range.
Segment Analysis: Battery Chemistry
NMC Segment in UK EV Battery Pack Market
Nickel Manganese Cobalt (NMC) batteries have established themselves as the dominant chemistry in the UK EV battery pack market, commanding approximately 63% of the market share in 2024. This substantial market position can be attributed to NMC batteries' superior energy density of around 250 Wh/kg, which enables extended driving ranges for electric vehicles. The chemistry's robust performance characteristics, including excellent cycle life exceeding 1,000 cycles, have made it the preferred choice for major OEMs including Nissan, BMW, and Volkswagen. Current research and development efforts in the NMC battery space are focused on enhancing charging speeds, reducing weight, and pushing the boundaries of energy density, aiming for even longer driving distances. These innovations, coupled with ongoing cost reduction initiatives, continue to strengthen NMC's market leadership position.
NCM Segment in UK EV Battery Pack Market
The Nickel Cobalt Manganese (NCM) chemistry segment is projected to experience the most rapid growth in the UK EV battery pack market from 2024 to 2029, with an expected growth rate of approximately 19%. This impressive growth trajectory is being driven by continuous technological advancements and increasing adoption by automotive manufacturers. The chemistry's appeal lies in its ability to deliver high power output while maintaining thermal stability, making it particularly suitable for high-performance electric vehicles. Major battery manufacturers are investing heavily in NCM technology development, focusing on improving energy density, reducing charging times, and enhancing overall battery efficiency. The segment's growth is further supported by expanding production capacities and strategic partnerships between battery manufacturers and automotive OEMs.
Remaining Segments in Battery Chemistry
The UK EV battery pack market features several other significant battery chemistries, including Lithium Iron Phosphate (LFP), Nickel Cobalt Aluminum (NCA), and emerging alternative chemistries. LFP batteries have gained traction due to their enhanced safety profile and cost-effectiveness, making them particularly attractive for commercial vehicle applications. NCA chemistry continues to maintain its position in the premium EV segment, offering high energy density and performance capabilities. Alternative chemistries are also being explored, with manufacturers investing in research and development to create more sustainable and efficient battery solutions. Each of these chemistries serves specific market needs, from cost-sensitive applications to high-performance requirements, contributing to the overall diversity and resilience of the UK EV battery ecosystem.
Segment Analysis: Battery Form
Prismatic Segment in UK EV Battery Pack Market
The prismatic battery segment has established itself as the dominant force in the UK EV battery pack market, commanding approximately 58% market share in 2024. This substantial market position can be attributed to prismatic batteries' superior adaptability across various vehicle types, including buses, lorries, and light commercial vehicles. Their rectangular shape and efficient space utilization make them particularly suitable for electric vehicle applications. The segment's growth is further bolstered by prismatic batteries' excellent thermal management capabilities, enhanced energy density, and optimized discharge rates. Major automotive manufacturers in the UK have shown a strong preference for prismatic batteries due to their proven track record in reliability and performance. The segment's leadership is also supported by continuous technological advancements in prismatic battery design, leading to improved safety features and longer lifecycle performance.
Pouch Segment in UK EV Battery Pack Market
The pouch battery segment is emerging as the fastest-growing segment in the UK EV battery pack market, with a projected growth rate of approximately 13% from 2024 to 2029. This remarkable growth trajectory is driven by several key advantages that pouch batteries offer, including their lightweight design, superior energy density, and exceptional flexibility in terms of form factor. The segment's expansion is further accelerated by increasing investments in pouch battery manufacturing capabilities across the UK. Automotive manufacturers are increasingly adopting pouch batteries for their next-generation electric vehicles due to their ability to maximize space utilization and optimize weight distribution. The segment's growth is also supported by technological innovations in pouch cell design, leading to enhanced safety features and improved thermal management systems. Additionally, the scalability of pouch battery production and their cost-effectiveness in high-volume manufacturing are contributing to their rapid market expansion.
Remaining Segments in Battery Form
The cylindrical battery segment continues to play a significant role in the UK EV battery pack market, offering unique advantages in specific applications. Cylindrical batteries are particularly valued for their robust construction and standardized manufacturing processes, making them a reliable choice for certain electric vehicle designs. These batteries benefit from well-established production methods and quality control procedures, contributing to their consistent performance and reliability. The segment maintains its relevance through continuous improvements in energy density and thermal management capabilities. Manufacturers appreciate cylindrical batteries for their proven track record in safety and their ability to maintain stable performance over extended periods. The standardized nature of cylindrical cells also facilitates easier integration into various battery pack designs, providing flexibility in terms of scaling and configuration options.
Segment Analysis: Method
Laser Segment in UK EV Battery Pack Market
The laser method has emerged as the dominant technology in the UK EV battery pack market, commanding approximately 63% of the total market share in 2024. This advanced technique, which utilizes laser beams for welding battery cells, has gained significant traction due to its superior precision and enhanced control during the welding process. The laser method's popularity can be attributed to its ability to create stronger and more reliable connections between battery cells, while simultaneously contributing to overall weight reduction in battery packs. Furthermore, this segment is experiencing remarkable growth, with a projected growth rate of around 27% from 2024 to 2029. This substantial growth is driven by the method's superior welding precision, improved energy efficiency, and enhanced overall performance in battery pack manufacturing. The increasing adoption of laser technology aligns perfectly with the evolving requirements of the electric vehicle industry, particularly as manufacturers focus on producing lighter and more efficient battery packs.
Wire Method in UK EV Battery Pack Market
The wire method represents a traditional approach in the UK EV battery pack market, offering distinct advantages in terms of cost-effectiveness and implementation simplicity. This method involves utilizing welding wires to establish connections between individual battery cells, providing manufacturers with a straightforward and well-established production process. The wire method's adaptability and simpler installation processes, combined with the capability to customize wire layouts to accommodate specific spatial requirements, continue to make it a viable option for certain manufacturers. The method enables efficient assembly processes and has proven particularly beneficial for manufacturers focusing on cost-optimization while maintaining acceptable performance standards. Despite facing competition from laser technology, the wire method maintains its relevance in specific applications where cost considerations outweigh the need for ultra-precise welding capabilities.
Segment Analysis: Component
Cathode Segment in UK EV Battery Pack Market
The cathode segment dominates the UK electric vehicle battery pack market, commanding approximately 69% of the total market value in 2024. This substantial market share can be attributed to cathode materials' crucial role in determining battery performance metrics and energy storage capabilities. The segment's prominence is further reinforced by continuous technological advancements in cathode chemistry, particularly in areas like NMC (Nickel Manganese Cobalt) and LFP (Lithium Iron Phosphate) materials. Major OEMs and battery manufacturers are investing significantly in research and development to enhance cathode material efficiency, focusing on improving energy density and reducing production costs. The segment's growth is also supported by increasing collaborations between cathode material suppliers and battery manufacturers, ensuring stable supply chains and consistent quality standards.
Separator Segment in UK EV Battery Pack Market
The separator segment is emerging as the fastest-growing component in the UK EV battery pack market, with a projected growth rate of approximately 13% from 2024 to 2029. This accelerated growth is driven by innovations in separator materials, including the integration of advanced ceramics and nano-materials that enhance battery safety and performance. The segment is witnessing significant technological breakthroughs in developing thinner yet more durable separators, which contribute to increased energy density and improved battery life. Manufacturers are focusing on developing separators with enhanced thermal stability and better mechanical strength, addressing key safety concerns in EV batteries. The growing emphasis on fast-charging capabilities and higher energy density batteries is further propelling investments in advanced separator technologies, making it a crucial component for next-generation EV batteries.
Remaining Segments in Component Segmentation
The anode and electrolyte segments also play vital roles in the UK EV battery pack market, each contributing uniquely to battery performance and functionality. The anode segment is experiencing significant developments in silicon-based materials and graphite alternatives, focusing on improving charging speeds and energy capacity. Manufacturers are exploring various anode materials to enhance battery performance while reducing costs. Meanwhile, the electrolyte segment is witnessing innovations in both liquid and solid-state technologies, with research focusing on developing more stable and efficient electrolyte solutions. These segments are crucial in determining overall battery performance, safety, and longevity, with ongoing research and development efforts aimed at optimizing their characteristics for next-generation electric vehicles.
Segment Analysis: Material Type
Natural Graphite Segment in UK EV Battery Pack Market
Natural graphite has emerged as a dominant force in the UK electric vehicle battery pack market, commanding approximately 34% market share in 2024. This material's prominence can be attributed to its superior electrical conductivity, cost efficiency, and environmentally friendly characteristics. Natural graphite utilized in battery packs typically contains about 99% carbon content with an average porosity of 20%, while maintaining a tap density of roughly 1.8 g/cm3 and an average particle size of around 17 1⁄4m. The material's particle size distribution in battery packs typically spans from 10 1⁄4m to 25 1⁄4m, with an intercalation capacity averaging around 350 mAh/g. UK-based OEMs are actively investing in research and development to enhance the efficacy of battery anodes derived from natural graphite, focusing on improving performance metrics and sustainability aspects.
Manganese Segment in UK EV Battery Pack Market
The manganese segment is projected to experience the fastest growth in the UK EV battery pack market, with an expected growth rate of approximately 15% during 2024-2029. This robust growth trajectory is driven by manganese's crucial role in enhancing battery performance and longevity, with typical content around 30% in battery compositions. The material's impressive energy density of about 180 Wh/kg and superior electrochemical efficiency make it increasingly attractive for EV battery manufacturers. The integration of manganese in battery packs has been further bolstered by its ability to improve cycling stability and thermal performance. Multiple OEMs across the nation are channeling significant resources into R&D, aiming to amplify the prowess and efficiency of manganese-centric battery solutions, particularly focusing on enhancing energy density and charge capabilities.
Remaining Segments in Material Type
The other significant materials in the UK EV battery pack market include cobalt, lithium, and various other materials, each playing vital roles in battery performance and efficiency. Cobalt is crucial for providing stability and enhancing the overall battery life, while lithium remains fundamental for its superior energy storage capabilities and lightweight properties. Other materials, including aluminum and copper, contribute to various aspects of battery functionality, from thermal management to electrical conductivity. These materials collectively form an integral part of the battery ecosystem, with manufacturers continuously exploring optimal combinations to enhance battery performance, reduce costs, and improve sustainability profiles. The ongoing research and development in these materials are focused on reducing dependency on rare earth elements while maintaining or improving battery performance metrics.
Competitive Landscape
Top Companies in UK EV Battery Pack Market
The UK EV battery pack market features prominent players like CATL, BYD Company, LG Energy Solution, Hyundai Mobis, and Deutsche ACCUmotive leading the competitive landscape. These companies demonstrate a strong commitment to innovation through continuous research and development in battery technology, focusing on improving energy density, charging speeds, and overall performance. Operational excellence is evident in their establishment of robust supply chains and manufacturing facilities across strategic locations in the United Kingdom and Europe. Companies are actively pursuing expansion through gigafactory developments, with several players announcing significant investments in UK-based manufacturing facilities. Strategic partnerships with automotive OEMs, technology providers, and research institutions have become increasingly common, enabling companies to strengthen their market position and accelerate technological advancement. The industry also witnesses a growing emphasis on sustainable manufacturing practices and circular economy initiatives, particularly in battery recycling and material recovery.
Market Dominated by Global Technology Leaders
The UK EV battery pack market exhibits a moderately consolidated structure, predominantly led by global technology conglomerates with an established presence in automotive and electric vehicle energy storage sectors. These major players leverage their extensive research capabilities, manufacturing expertise, and global supply chain networks to maintain competitive advantages. Asian manufacturers, particularly from South Korea, China, and Japan, hold significant market share due to their advanced battery technology capabilities and early market entry. European players are increasingly strengthening their position through strategic investments and government support, aiming to reduce dependency on Asian suppliers.
The market demonstrates active merger and acquisition activity, with larger companies acquiring specialized battery technology firms to enhance their technological capabilities and market reach. Joint ventures between automotive manufacturers and battery producers are becoming increasingly common, creating vertically integrated operations to secure battery supply chains. Local British companies are emerging in specialized segments, particularly in advanced battery materials and recycling technologies, though they currently hold smaller market shares compared to global leaders. The industry also witnesses collaboration between established players and startups, particularly in developing next-generation battery technologies and sustainable manufacturing processes.
Innovation and Sustainability Drive Future Success
Success in the UK EV battery pack market increasingly depends on companies' ability to balance technological innovation with cost-effective manufacturing processes. Market leaders are investing heavily in research and development to improve battery performance, focusing on energy density, charging speeds, and safety features. Establishing local manufacturing facilities and securing raw material supply chains has become crucial for maintaining competitive advantages. Companies are also emphasizing sustainability credentials, with a growing focus on renewable energy usage in manufacturing and the development of circular economy solutions for battery recycling.
For new entrants and smaller players, success lies in identifying and developing specialized niches within the battery value chain. This includes focusing on specific applications, developing innovative materials, or providing specialized services in areas like battery management systems or recycling. Building strategic partnerships with automotive manufacturers and participating in government-supported research initiatives provides opportunities for market entry and growth. The regulatory landscape, particularly regarding environmental standards and local content requirements, continues to shape competitive dynamics, with companies needing to demonstrate strong compliance capabilities and sustainable practices to maintain market position.
UK EV Battery Pack Industry Leaders
BYD Company Ltd.
Contemporary Amperex Technology Co. Ltd. (CATL)
Deutsche ACCUmotive GmbH & Co. KG
Hyundai Mobis Co. Ltd.
LG Energy Solution Ltd.
- *Disclaimer: Major Players sorted in no particular order

Recent Industry Developments
- June 2023: Hydrovolt, a 50:50 joint venture (JV) of Norsk Hydro ASA (Hydro) and Northvolt, received NOK 15.3 million in funding from Enova to develop a discharge and dismantling technology for batteries
- May 2023: CATL announced that CATL Geely (Sichuan) Power Battery Co., Ltd. (CATL Geely) obtained a carbon neutrality certificate from TÜV Rheinland, marking that the company realized carbon neutrality in 2022. CATL Geely is a wholly-owned subsidiary of CATL Geely Power Battery Co., Ltd., a joint venture between CATL and Zeekr.
- May 2023: Invest in Thuringia announced that Contemporary Amperex Technology Co. Ltd. (CATL) is building its first battery cell manufacturing facility outside of China in the industry park “Erfurter Kreuz” and officially launched its local production of lithium-ion cells at the end of January 2023.
UK EV Battery Pack Market Report Scope
Bus, LCV, M&HDT, Passenger Car are covered as segments by Body Type. BEV, PHEV are covered as segments by Propulsion Type. LFP, NCA, NCM, NMC, Others are covered as segments by Battery Chemistry. 15 kWh to 40 kWh, 40 kWh to 80 kWh, Above 80 kWh, Less than 15 kWh are covered as segments by Capacity. Cylindrical, Pouch, Prismatic are covered as segments by Battery Form. Laser, Wire are covered as segments by Method. Anode, Cathode, Electrolyte, Separator are covered as segments by Component. Cobalt, Lithium, Manganese, Natural Graphite, Nickel are covered as segments by Material Type.| Bus |
| LCV |
| M&HDT |
| Passenger Car |
| BEV |
| PHEV |
| LFP |
| NCA |
| NCM |
| NMC |
| Others |
| 15 kWh to 40 kWh |
| 40 kWh to 80 kWh |
| Above 80 kWh |
| Less than 15 kWh |
| Cylindrical |
| Pouch |
| Prismatic |
| Laser |
| Wire |
| Anode |
| Cathode |
| Electrolyte |
| Separator |
| Cobalt |
| Lithium |
| Manganese |
| Natural Graphite |
| Nickel |
| Other Materials |
| Body Type | Bus |
| LCV | |
| M&HDT | |
| Passenger Car | |
| Propulsion Type | BEV |
| PHEV | |
| Battery Chemistry | LFP |
| NCA | |
| NCM | |
| NMC | |
| Others | |
| Capacity | 15 kWh to 40 kWh |
| 40 kWh to 80 kWh | |
| Above 80 kWh | |
| Less than 15 kWh | |
| Battery Form | Cylindrical |
| Pouch | |
| Prismatic | |
| Method | Laser |
| Wire | |
| Component | Anode |
| Cathode | |
| Electrolyte | |
| Separator | |
| Material Type | Cobalt |
| Lithium | |
| Manganese | |
| Natural Graphite | |
| Nickel | |
| Other Materials |
Market Definition
- Battery Chemistry - Various types of battery chemistry considred under this segment include LFP, NCA, NCM, NMC, Others.
- Battery Form - The types of battery forms offered under this segment include Cylindrical, Pouch and Prismatic.
- Body Type - Body types considered under this segment include, passenger cars, LCV (light commercial vehicle), M&HDT (medium & heavy duty trucks)and buses.
- Capacity - Various types of battery capacities inldude under theis segment are 15 kWH to 40 kWH, 40 kWh to 80 kWh, Above 80 kWh and Less than 15 kWh.
- Component - Various components covered under this segment include anode, cathode, electrolyte, separator.
- Material Type - Various material covered under this segment include cobalt, lithium, manganese, natural graphite, nickel, other material.
- Method - The types of method covered under this segment include laser and wire.
- Propulsion Type - Propulsion types considered under this segment include BEV (Battery electric vehicles), PHEV (plug-in hybrid electric vehicle).
- ToC Type - ToC 1
- Vehicle Type - Vehicle type considered under this segment include passenger vehicles, and commercial vehicles with various EV powertrains.
| Keyword | Definition |
|---|---|
| Electric vehicle (EV) | A vehicle which uses one or more electric motors for propulsion. Includes cars, buses, and trucks. This term includes all-electric vehicles or battery electric vehicles and plug-in hybrid electric vehicles. |
| PEV | A plug-in electric vehicle is an electric vehicle that can be externally charged and generally includes all electric vehicles as well as plug-electric vehicles as well as plug-in hybrids. |
| Battery-as-a-Service | A business model in which the battery of an EV can be rented from a service provider or swapped with another battery when it runs out of charge |
| Battery Cell | The basic unit of an electric vehicle's battery pack, typically a lithium-ion cell, that stores electrical energy. |
| Module | A subsection of an EV battery pack, consisting of several cells grouped together, often used to facilitate manufacturing and maintenance. |
| Battery Management System (BMS) | An electronic system that manages a rechargeable battery by protecting the battery from operating outside its safe operating area, monitoring its state, calculating secondary data, reporting data, controlling its environment, and balancing it. |
| Energy Density | A measure of how much energy a battery cell can store in a given volume, usually expressed in watt-hours per liter (Wh/L). |
| Power Density | The rate at which energy can be delivered by the battery, often measured in watts per kilogram (W/kg). |
| Cycle Life | The number of complete charge-discharge cycles a battery can perform before its capacity falls under a specified percentage of its original capacity. |
| State of Charge (SOC) | A measurement, expressed as a percentage, that represents the current level of charge in a battery compared to its capacity. |
| State of Health (SOH) | An indicator of the overall condition of a battery, reflecting its current performance compared to when it was new. |
| Thermal Management System | A system designed to maintain optimal operating temperatures for an EV's battery pack, often using cooling or heating methods. |
| Fast Charging | A method of charging an EV battery at a much faster rate than standard charging, typically requiring specialized charging equipment. |
| Regenerative Braking | A system in electric and hybrid vehicles that recovers energy normally lost during braking and stores it in the battery. |
Research Methodology
Mordor Intelligence follows a four-step methodology in all its reports.
- Step-1: Identify Key Variables: To build a robust forecasting methodology, the variables and factors identified in Step-1 are tested against available historical market numbers. Through an iterative process, the variables required for market forecast are set and the model is built based on these variables.
- Step-2: Build a Market Model: Market-size estimations for the historical and forecast years have been provided in revenue and volume terms. Market revenue is calculated by multiplying the volume demand with volume-weighted average battery pack price (per kWh). Battery pack price estimation and forecast takes into account various factors affecting ASP, such as inflation rates, market demand shifts, production costs, technological developments, and consumer preferences, providing estimations for both historical data and future trends.
- Step-3: Validate and Finalize: In this important step, all market numbers, variables, and analyst calls are validated through an extensive network of primary research experts from the market studied. The respondents are selected across levels and functions to generate a holistic picture of the market studied.
- Step-4: Research Outputs: Syndicated Reports, Custom Consulting Assignments, Databases & Subscription Platforms


