Market Overview
| Study Period | 2021 - 2031 |
|---|---|
| Base Year For Estimation | 2025 |
| Forecast Data Period | 2026 - 2031 |
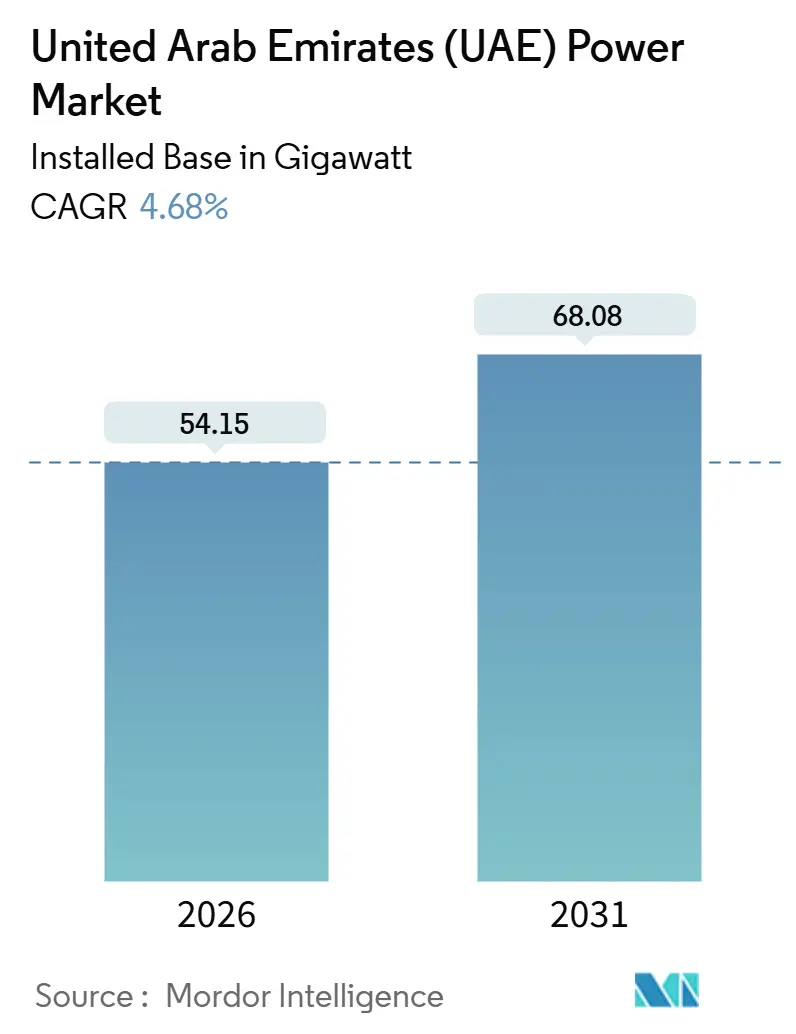
| Market Volume (2026) | 54.15 gigawatt |
| Market Volume (2031) | 68.08 gigawatt |
| Growth Rate (2026 - 2031) | 4.68% CAGR |
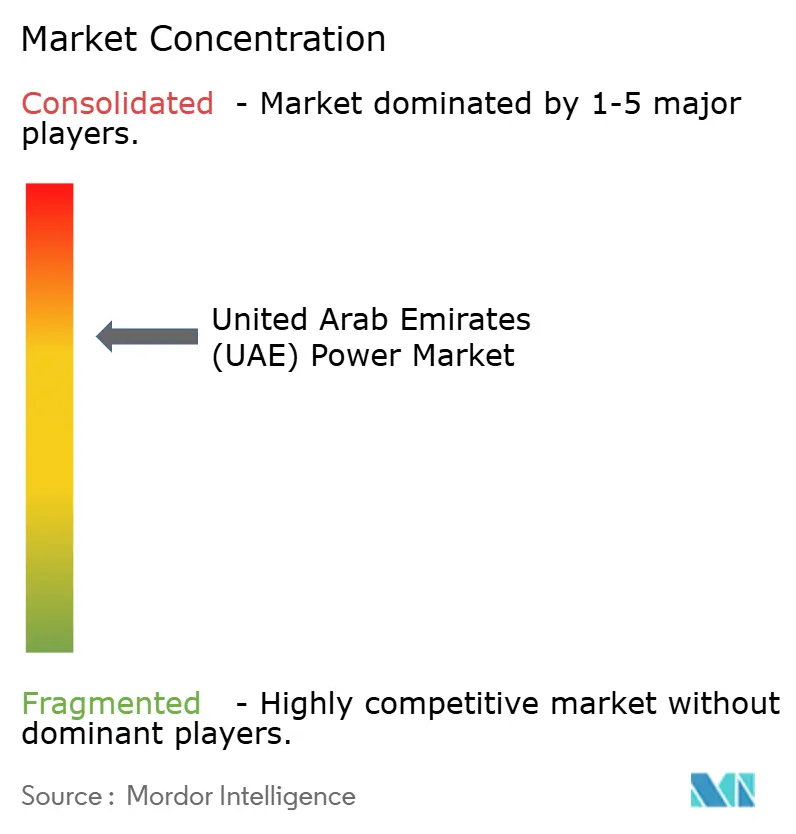
| Market Concentration | Medium |
Major Players *Disclaimer: Major Players sorted in no particular order Image © Mordor Intelligence. Reuse requires attribution under CC BY 4.0. | |
United Arab Emirates (UAE) Power Market Analysis by Mordor Intelligence
The UAE power market size stands at 54.15 GW in 2026 and is projected to reach 68.08 GW by 2031, advancing at a 4.68% CAGR, underpinned by a pivot from gas-dominated baseload toward a mix in which nuclear anchors reliability while solar capacity absorbs most additions. Ultra-low photovoltaic tariffs, the full commissioning of the 5.6 GW Barakah nuclear complex, wholesale-market liberalization, and a reinforced high-voltage grid are reshaping generation economics and accelerating capital deployment. Record solar bids as low as USD 0.0135 per kWh continue to compress the cost premium between renewables and gas, while mandatory rooftop programs and corporate net-zero targets spur distributed generation. Elevated gas-price volatility and Northern Emirates grid congestion create near-term headwinds, yet rapid battery-storage rollouts and interconnection projects limit the downside. As a result, the UAE power market is shifting toward a cleaner, more flexible capacity mix that still preserves system resilience through nuclear baseload and high-efficiency gas peakers.
Key Report Takeaways
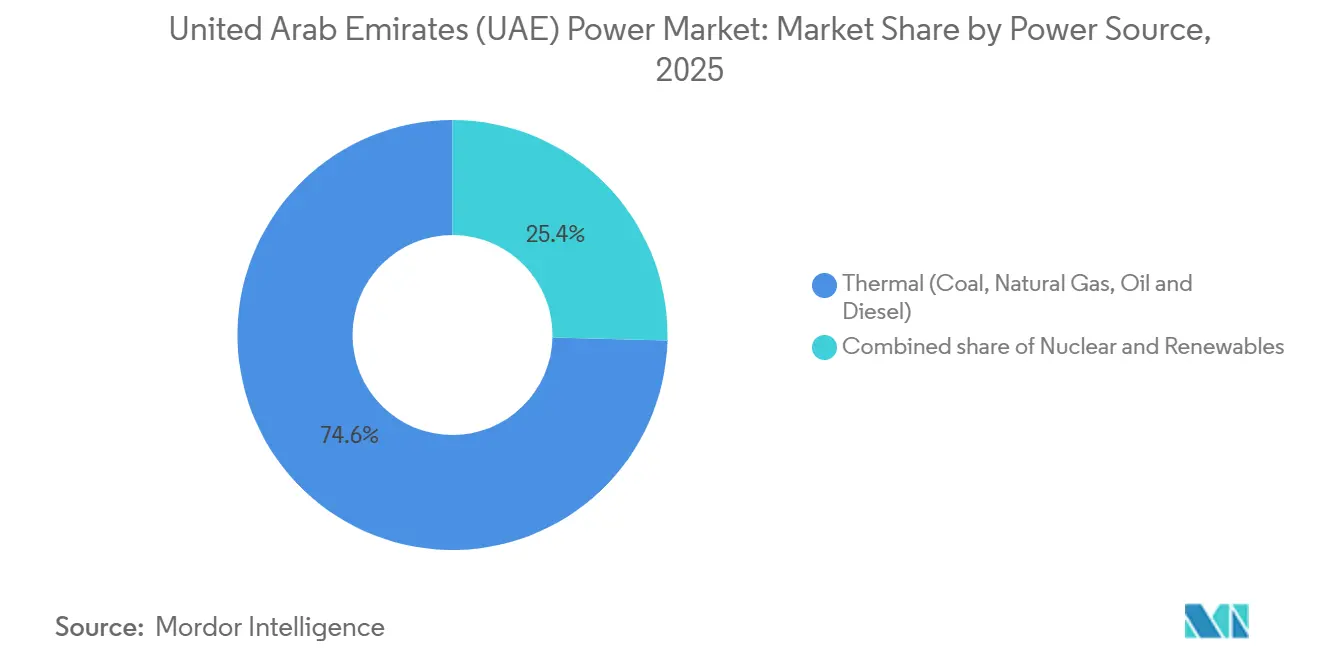
- By power source, thermal generation led with a 74.6% share of the UAE power market in 2025, while renewables are forecast to expand at an 11.1% CAGR through 2031.
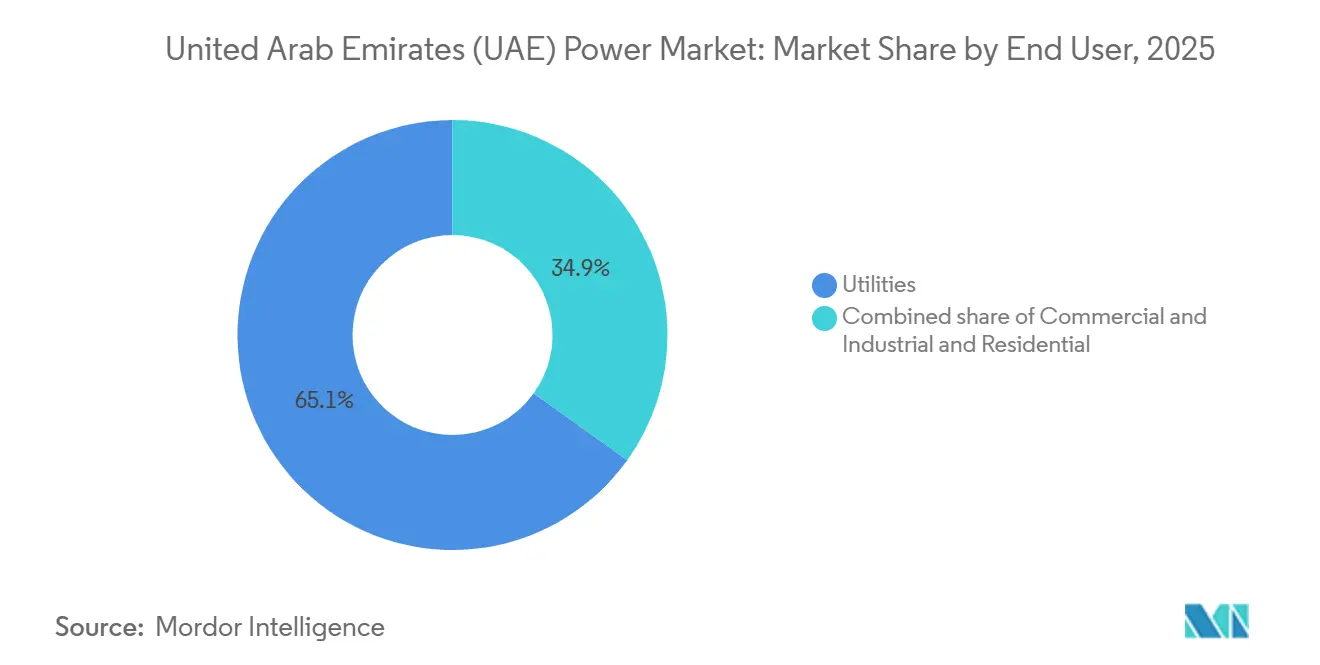
- By end user, the utilities segment held 65.1% of the UAE power market share in 2025; commercial and industrial demand is advancing at a 10.3% CAGR to 2031.
Note: Market size and forecast figures in this report are generated using Mordor Intelligence’s proprietary estimation framework, updated with the latest available data and insights as of January 2026.
United Arab Emirates (UAE) Power Market Trends and Insights
Drivers Impact Analysis
| Driver | (~) % Impact on CAGR Forecast | Geographic Relevance | Impact Timeline |
|---|---|---|---|
| Large-scale solar program rollouts under UAE Energy Strategy 2050 | 1.8% | National, concentrated in Abu Dhabi and Dubai | Medium term (2–4 years) |
| Green hydrogen initiatives boosting renewable integration into grid | 0.9% | Abu Dhabi (Khalifa Port, Taweelah industrial zones) | Long term (≥4 years) |
| Mandatory building rooftop PV regulations accelerating distributed generation | 0.7% | Dubai, Abu Dhabi, expanding to Northern Emirates | Short term (≤2 years) |
| Commissioning of Barakah nuclear units adding baseload capacity | 1.2% | National grid supply from Abu Dhabi | Short term (≤2 years) |
| Liberalization of wholesale electricity market and private IPP participation | 0.6% | Abu Dhabi (EWEC), Dubai (DEWA), emerging in Northern Emirates | Medium term (2–4 years) |
| Strategic interconnection (GCCIA & planned HVDC exports) opening export opportunities | 0.4% | GCC-wide, with UAE as net exporter by 2028 | Long term (≥4 years) |
| Source: Mordor Intelligence | |||
Understand The Key Trends Shaping This Market
Download PDF
Large-scale Solar Program Rollouts under UAE Energy Strategy 2050
The December 2024 update to Energy Strategy 2050 mandates a 30% clean-energy share by 2030, which requires clean capacity to climb from 14.2 GW to 19.8 GW. More than 10 GW of utility-scale solar is in various stages, led by the 5.2 GW Masdar 24/7 initiative that combines photovoltaics with 19 GWh of storage. Procurement cycles have compressed, evidenced by EWEC closing finance for the 1.5 GW Al Ajban project within two months of award. The policy’s emission-factor target of 0.27 kg CO₂⁄kWh effectively sidelines unabated gas, steering capital to solar-plus-storage hybrids. An estimated AED 150-200 billion in investment and 50,000 green jobs are expected by 2030, deepening local supply-chain sophistication. Module manufacturers have already secured multi-gigawatt orders, underscoring confidence in execution.[1]Staff Correspondent, “Masdar Launches 24⁄7 Solar-Storage Mega-Project,” PV Magazine, pv-magazine.com
Green Hydrogen Initiatives Boosting Renewable Integration Into Grid
The Masdar-TAQA-ADNOC-Mubadala hydrogen hub targets 1 GW of electrolyzers by 2031 and one million tonnes of annual hydrogen output. Flexible electrolyzer operation absorbs midday solar oversupply, raising renewable capacity factors and trimming curtailment. Co-location with industrial off-takers in Khalifa Port and Taweelah bypasses the grid for part of the output, creating dual revenue streams that lift project returns. International developers such as TotalEnergies and ENGIE are exploring similar setups, indicating replicability. IRENA’s 2024 assessment shows hydrogen-coupled renewables can achieve 15-20% higher IRRs than grid-only plants.[2]IRENA Analysts, “Hydrogen-Coupled Renewables Economics,” International Renewable Energy Agency, irena.org However, most capacity will come online after 2030, tempering its immediate contribution to the 2026-2031 CAGR.
Mandatory Rooftop PV Regulations Accelerating Distributed Generation
Dubai’s Shams Dubai mandate installed 300 MW of rooftop systems by mid-2025 and targets 1 GW by 2030. Abu Dhabi raised net-metering tariffs to 0.28 AED⁄kWh in January 2025, cutting commercial payback periods to under five years. The Northern Emirates are extending similar rules through Etihad Water & Electricity to relieve transmission strain. Distributed generation reduces line losses, DEWA reports 2%, versus 6–7% in Europe, and postpones substation upgrades. SirajPower’s zero-capex model has secured large retail and logistics clients, illustrating growing C&I appetite.
Commissioning of Barakah Nuclear Units Adding Baseload Capacity
Barakah Unit 4 entered commercial service in September 2024, completing the 5.6 GW fleet that now supplies roughly 25% of national electricity and avoids 22.4 million tonnes of CO₂ annually. Gas combined-cycle capacity factors have already fallen toward 45%, freeing fuel and enabling flexible peaking duty. With >90% availability, nuclear provides a steady anchor that eases variable-renewable integration. ENEC refinanced project debt in June 2023 at lower rates, improving economics for any future expansion. Barakah’s operational success is influencing nuclear feasibility studies underway in Saudi Arabia and Oman.
Restraints Impact Analysis
| Restraint | (~) % Impact on CAGR Forecast | Geographic Relevance | Impact Timeline |
|---|---|---|---|
| Gas price volatility challenging thermal generation cost competitiveness | -0.6% | National, with acute impact on Dubai and Northern Emirates | Short term (≤2 years) |
| Grid congestion in Northern Emirates limiting renewable project integration | -0.4% | Sharjah, Ajman, Ras Al Khaimah, Umm Al Quwain | Medium term (2–4 years) |
| Water–electricity cogeneration plants' retrofitting complexity slowing decarbonization | -0.3% | Abu Dhabi (Taweelah), Dubai (Jebel Ali), Fujairah | Long term (≥4 years) |
| Limited on-shore wind resource compared to solar reducing technology diversification | -0.2% | National, with marginal potential in Ras Al Khaimah | Long term (≥4 years) |
| Source: Mordor Intelligence | |||
Grid Congestion in Northern Emirates Limiting Renewable Integration
Sharjah, Ajman, Ras Al Khaimah, and Umm Al Quwain import most of their power over 132- and 220-kV lines running at up to 95% utilization during summer peaks.[3]Bureau Reporter, “Northern Emirates Grid Bottlenecks Persist,” Gulf News, gulfnews.com TRANSCO’s AED 40 billion upgrade will add 400-kV substations by 2028, yet roughly 800 MW of permitted solar remains stranded. Frequency deviations here reach ±0.3 Hz compared with ±0.1 Hz in Abu Dhabi, complicating inverter-based resource integration. Etihad Water & Electricity is promoting behind-the-meter storage, but clear net-metering rules are still in draft.
Gas Price Volatility Challenging Thermal Generation Cost Competitiveness
Regional LNG prices swung from USD 70⁄MMBtu in 2022 to USD 10–15⁄MMBtu in 2024, exposing gas generators to sharp margin compression. A 60%-efficient combined-cycle plant needs about 7 MMBtu per MWh, translating to USD 70–105 per MWh fuel cost versus sub-USD 15 solar tariffs. ADNOC’s below-market supply contracts begin expiring in 2028, increasing exposure to spot markets. Without long-term LNG deals, utilities face planning uncertainty, discouraging new gas capacity even for peaking roles.
Segment Analysis
By Power Source: Nuclear and Solar Redefine Baseload Economics
Thermal plants supplied 74.6% of electricity in 2025, yet solar and nuclear now dictate incremental investment decisions. Barakah’s 5.6 GW fleet delivers ≈40 TWh annually and anchors system reliability.[4]Editorial Team, “Barakah Unit 4 Enters Service,” World Nuclear News, world-nuclear-news.org The UAE power market size attributable to renewables is forecast to rise sharply as new photovoltaic parks like the 2 GW Al Dhafra and the 5.2 GW Masdar 24⁄7 complex come online. Concentrated solar units with thermal storage already reach 35-40% capacity factors, displacing evening gas peakers. Coal is absent following the Hassyan fuel switch, and oil use has fallen below 2%. Wind, hydro, and biomass remain marginal. The UAE power market is therefore converging on a tri-pillar mix of nuclear, solar-plus-storage, and flexible gas turbines for residual balancing.
Capital is migrating accordingly. Module makers secure multi-gigawatt orders, and battery suppliers such as CATL have landed 19 GWh contracts. Gas assets built for 8,000-hour duty now run near 4,000 hours, eroding returns. Without carbon capture or hydrogen blending, investors see limited upside in new gas capacity. This dynamic will persist through 2031 as policy, tariffs, and technology advantages reinforce solar dominance within the UAE power market.
Note: Segment shares of all individual segments available upon report purchase
Get Detailed Market Forecasts at the Most Granular Levels
Download PDF
By End User: Commercial and Industrial Buyers Capture Behind-the-Meter Economics
Utilities accounted for 65.1% of demand in 2025, yet commercial and industrial customers are the growth engine. They are adding rooftop arrays that sidestep wheeling charges and lock in long-term savings, propelling an expected 10.3% CAGR for the segment. SirajPower’s fleet exceeds 200 MW and targets 500 MW by 2026 under zero-capex, long-tenor PPAs. The UAE power market size tied to distributed systems is scaling fast as retailers, logistics operators, and heavy industry respond to corporate net-zero mandates.
Utilities are repositioning as platform providers that procure capacity from IPPs while selling ancillary services. EWEC’s 400 MW⁄800 MWh storage tender illustrates a pivot to flexibility products. Residential uptake is smaller in absolute terms but rising because of zero-interest loans and shorter paybacks after January 2025 tariff tweaks. By 2031, behind-the-meter assets are expected to materially flatten evening peaks, moderating capacity-addition needs across the wider UAE power market.
Note: Segment shares of all individual segments available upon report purchase
Get Detailed Market Forecasts at the Most Granular Levels
Download PDF
Geography Analysis
Abu Dhabi and Dubai supplied roughly 70% of 2025 electricity, leveraging 18 GW of TAQA assets, the 5.6 GW Barakah complex, and 3.86 GW of Dubai solar. EWEC’s auctions have delivered world-low tariffs that continuously expand the UAE power market across both emirates. Dubai’s Mohammed bin Rashid Al Maktoum Solar Park will rise from 3.86 GW in 2025 to 7.26 GW by 2030, and Phase 7 will add a 1 GW six-hour battery, making it the first dispatchable solar hub in the region.
Northern Emirates grids remain capacity-constrained, importing up to 90% of peak load over lines operating near design limits. TRANSCO’s new 400 kV substations in Sharjah and Ras Al Khaimah will not enter service until 2028, so rooftop solar and behind-the-meter storage are the interim solutions. Fujairah’s east-coast plants act as swing suppliers to Oman through GCCIA links, highlighting the strategic value of interconnection.
Cross-border flows reached 1.2 TWh in 2024, and a 1,500 MW HVDC line to Oman scheduled for 2028 will further integrate regional markets. Until then, Abu Dhabi will balance national deficits using new storage plants and flexible gas units, reinforcing its role as the backbone of the UAE power market.
Competitive Landscape
TAQA, DEWA, and EWEC control about three-quarters of installed capacity, yet the project pipeline is dominated by IPPs that win auctions through record-low solar bids. Masdar’s purchase of 50% of Terra-Gen imports 3.8 GW of operating assets and 5.1 GWh of storage expertise to the UAE power market. ACWA Power, EDF, ENGIE, and KEPCO form consortia with local sponsors to secure land and long-term offtake guarantees.
Technology differentiation is accelerating. Jinko Solar and JA Solar bypass turnkey EPCs to supply direct to developers, while Schneider Electric digital twins cut asset downtime for DEWA by 80%. Storage is the new battleground: EWEC’s 2024 tender drew 27 bidders vying for the first utility-scale standalone battery in the country. distributed-solar specialists such as SirajPower undermine the traditional utility margin by leasing rooftops and bundling energy management services.
Regulation cements these trends. The updated Energy Strategy 2050 and Dubai Clean Energy Strategy prioritize clean generation, making new gas approvals unlikely unless paired with carbon capture. As dispatchable solar-plus-storage hybrids gain scale, the competitive window for pure gas developers closes further, reshaping future capacity mixes within the UAE power market.
United Arab Emirates (UAE) Power Industry Leaders
Abu Dhabi National Energy Company PJSC (TAQA)
Dubai Electricity and Water Authority(DEWA)
Emirates Water and Electricity Company (EWEC)
ACWA Power Company
Emirates Nuclear Energy Corporation (ENEC)
- *Disclaimer: Major Players sorted in no particular order
Need More Details on Market Players and Competitors?
Download PDF
Recent Industry Developments
- May 2025: Emirates Nuclear Energy Corporation signed an MoU with GE Vernova Hitachi to explore BWRX-300 small modular reactors and chart a roadmap for commercialization.
- May 2025: Masdar and OMV agreed to collaborate on green hydrogen and sustainable aviation fuels, advancing plans to reach 100 GW of renewables by 2030.
- April 2025: EWEC, TAQA, ENGIE, and Sumitomo inked a 15-year PPA to convert Shuweihat 1 into a 1.1 GW flexible-reserve facility.
- January 2025: Masdar and EWEC launched the first 24/7 gigascale solar-plus-storage project, 5.2 GW PV with 19 GWh batteries, delivering 1 GW baseload power.
Research Methodology Framework and Report Scope
Market Definitions and Key Coverage
Our study defines the UAE power market as the sum of grid-connected installed generating capacity, thermal, nuclear, and renewable, that is available to the national transmission and distribution network and measured in gigawatts (GW). It captures capacity commissioned by federal utilities and independent power producers that sell to Emirates-level off-takers.
Scope exclusion: Behind-the-meter captive plants below 5 MW, stand-alone diesel generators, and electricity trading revenues are excluded from the sizing.
Segmentation Overview
- By Power Source
- Thermal (Coal, Natural Gas, Oil and Diesel)
- Nuclear
- Renewables (Solar, Wind, Hydro, Geothermal, Biomass & Waste, Tidal)
- By End User
- Utilities
- Commercial and Industrial
- Residential
- By T&D Voltage Level (Qualitative Analysis only)
- High-Voltage Transmission (Above 230 kV)
- Sub-Transmission (69 to 161 kV)
- Medium-Voltage Distribution (13.2 to 34.5 kV)
- Low-Voltage Distribution (Up to 1 kV)
Detailed Research Methodology and Data Validation
Primary Research
Interviews and structured surveys with grid planners, EPC contractors, solar park developers, and regulatory officials across Abu Dhabi, Dubai, and the Northern Emirates allowed us to verify commissioning schedules, capacity factors, and tariff expectations, which filled gaps left by desk work and sharpened assumption ranges.
Desk Research
We began with publicly available datasets from the Federal Competitiveness & Statistics Center, International Energy Agency, and the Ministry of Energy & Infrastructure, which outline yearly capacity additions, fuel mix, and peak-load evolution. Trade association releases, such as those from the Middle East Solar Industry Association, and multilateral papers from the IRENA and the World Bank enriched understanding of renewable build-out economics. Complementary insights on corporate strategy, project pipelines, and average selling prices were drawn from utility annual reports and investor presentations, then screened through Dow Jones Factiva for corroborating news coverage.
Subscription sources in Mordor's toolkit, notably D&B Hoovers for company financials and Questel for patent activity around grid-scale storage, helped validate technology adoption curves. This list is illustrative; many additional references informed cross-checks and narrative shaping.
Market-Sizing & Forecasting
A top-down construct starts with historical installed capacity, official five-year expansion plans, and net reserve-margin targets; these are then reconciled with selective bottom-up roll-ups of announced plant capacities and sampled weighted average capital costs. Key variables like population growth, peak-demand elasticity, gas price outlook, solar PV tariff bids, capacity factor by technology, and nuclear ramp-up milestones drive the multivariate regression that projects capacity to 2030. Bottom-up gaps, especially in distributed solar, are bridged with penetration-rate benchmarks from DEWA's Shams Dubai roster.
Data Validation & Update Cycle
Mordor analysts triangulate provisional outputs against independent indicators such as monthly fuel burn, grid emission factors, and tender awards. Variances beyond preset thresholds trigger re-engagement with sources before sign-off. The model is refreshed annually, with interim updates when material events, like Barakah Unit 4 synchronization, occur.
Why Mordor's UAE Power Baseline Remains Dependable and Influential
Published figures for the same market often diverge because firms differ in unit of measure, technology scope, and refresh cadence.
Key gap drivers include whether studies report installed capacity or electricity generated, how they treat upcoming but unwired projects, and the currency year chosen for baselining. Our analysts lock scope to grid-connected capacity, apply uniform derating factors, and update assumptions each quarter, which together reduce volatility in the baseline year.
Benchmark comparison
| Market Size | Anonymized source | Primary gap driver |
|---|---|---|
| 45.56 GW (2025) | Mordor Intelligence | - |
| 60 GW (2025) | Regional Consultancy A | Counts committed projects still awaiting financial close |
| 183.67 TWh (2024) | Trade Journal B | Uses energy produced, not capacity, hindering like-for-like comparison |
| 79.1 GW (2035) | Global Consultancy C | Presents long-range scenario, then back-allocates to current year, inflating baseline |
In sum, Mordor's disciplined scope definition, variable selection, and timely refresh give decision-makers a balanced, transparent baseline that links clearly to observable capacity additions and policy signals.
Need A Different Region or Segment?
Customize Now
Key Questions Answered in the Report
How large is the UAE power market in 2026?
The UAE power market size is 54.15 GW in 2026 and is forecast to reach 68.08 GW by 2031.
What is driving the fastest growth in UAE electricity generation?
Ultra-low solar tariffs and the 30% clean-energy mandate are propelling renewables at an 11.1% CAGR through 2031.
How significant is nuclear power in the UAE electricity mix?
The 5.6 GW Barakah fleet supplies about 25% of national demand, providing stable zero-carbon baseload.
Why are commercial and industrial customers installing rooftop solar?
Behind-the-meter PV avoids transmission charges, delivers tariffs 20-30% below grid rates, and supports corporate net-zero goals, pushing a 10.3% CAGR in the segment.
What role will battery storage play by 2030?
Utility-scale tenders like EWEC’s 400 MW⁄800 MWh project and a 1 GW battery at Dubai’s solar park signal that storage will provide peak shaving and solar firming, reducing reliance on gas peakers.


