
Market Overview
| Study Period | 2020 - 2031 |
|---|---|
| Forecast Data Period | 2026 - 2031 |
| Base Year Market Size (2025) | USD 0.95 Billion |
| Market Size (2026) | USD 1 Billion |
| Market Size (2031) | USD 1.31 Billion |
| Growth Rate (2026 - 2031) | 5.57 % |
| Market Concentration | Medium |
Major Players *Disclaimer: Major Players sorted in no particular order Image © Mordor Intelligence. Reuse requires attribution under CC BY 4.0. | |
United States Automotive Air Filters Market Analysis by Mordor Intelligence
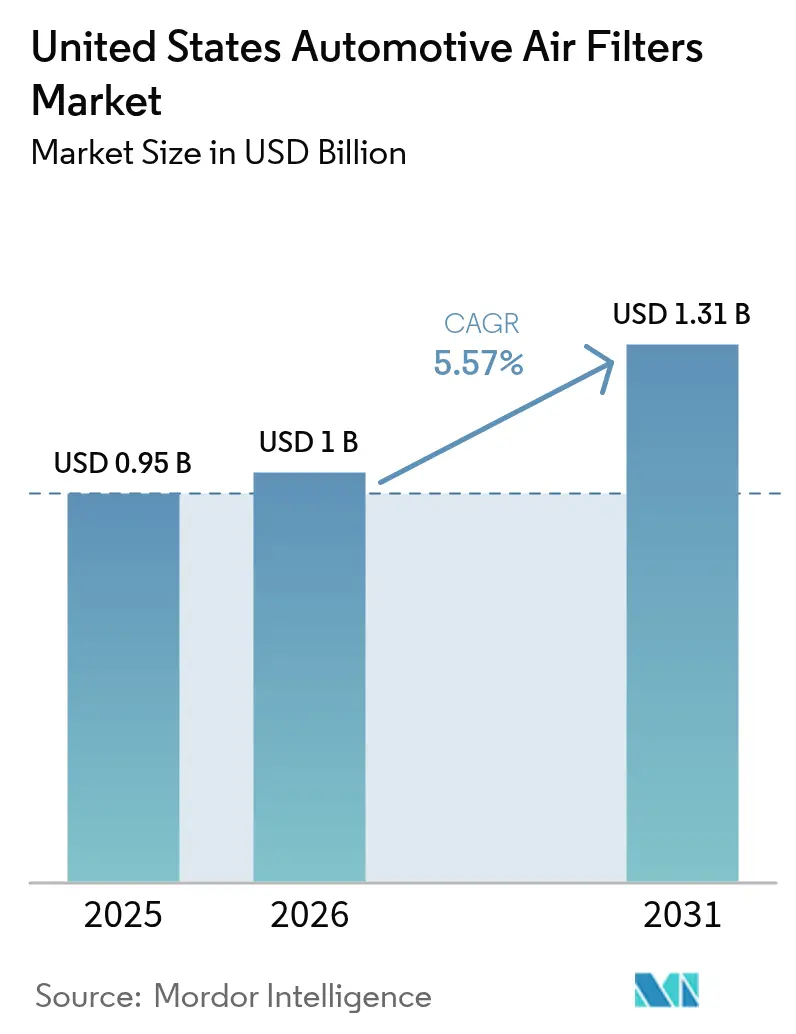
The United States automotive air filters market size was valued at USD 0.95 billion in 2025 and estimated to grow from USD 1 billion in 2026 to reach USD 1.31 billion by 2031, at a CAGR of 5.57% during the forecast period (2026-2031). Steady expansion is underpinned by an aging national vehicle fleet, stricter emissions rules, and post-pandemic concern for in-car air quality. A record average vehicle age of 12.6 years boosts replacement volumes, while Environmental Protection Agency (EPA) particulate limits of 0.5 mg/mi compel automakers to integrate high-efficiency gasoline particulate filters. Cabin filter innovation accelerates as consumers seek allergen and pathogen protection, and nanofiber media gains traction by delivering higher capture efficiency with lower pressure drop. Supply-chain reconfiguration after the May 2025 import-tariff hike is pushing manufacturers toward regionalized sourcing, and forward-looking suppliers are investing in advanced thermal-management filtration to offset future internal-combustion-engine (ICE) volume attrition.
Key Report Takeaways
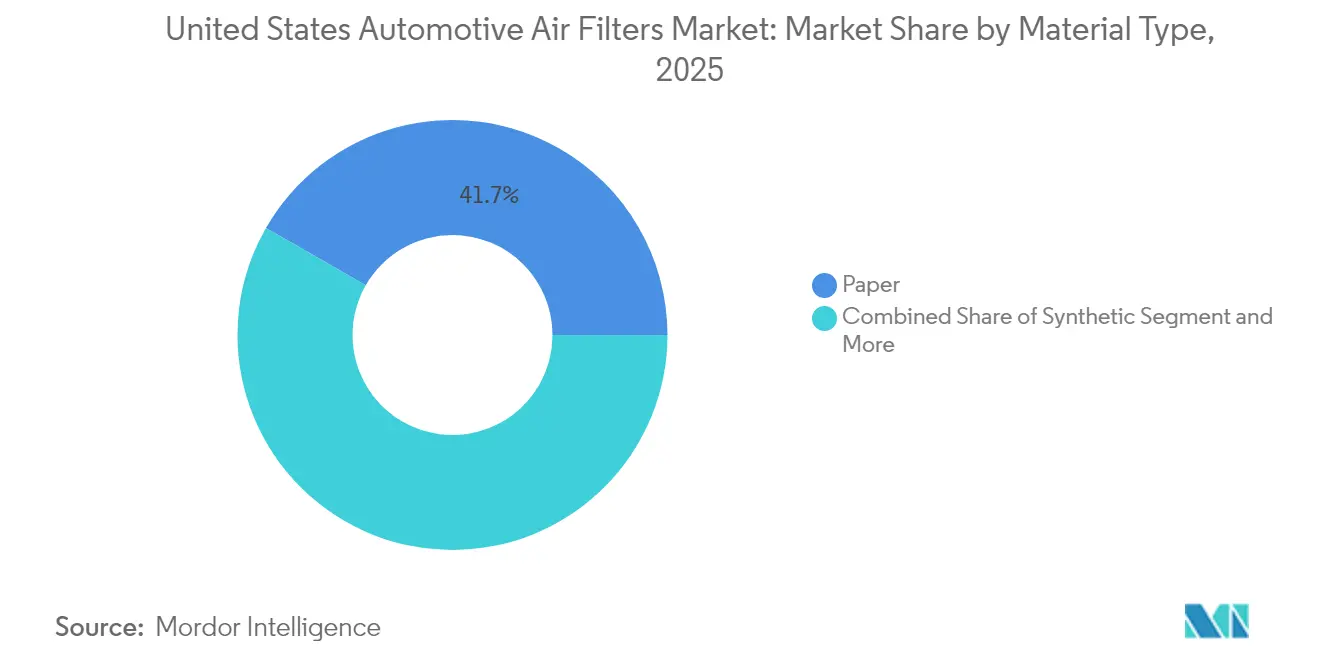
- By material type, paper filters led with 41.72% of the United States automotive air filters market share in 2025, while nanofiber composites are on track to expand at an 8.15% CAGR through 2031.
- By filter type, cabin filters held 55.48% revenue share in 2025; HEPA and antiviral cabin filters are advancing at a 12.57% CAGR to 2031.
- By vehicle type, passenger cars accounted for 62.41% of the United States automotive air filters market size in 2025 and are projected to grow at a 5.62% CAGR between 2026-2031.
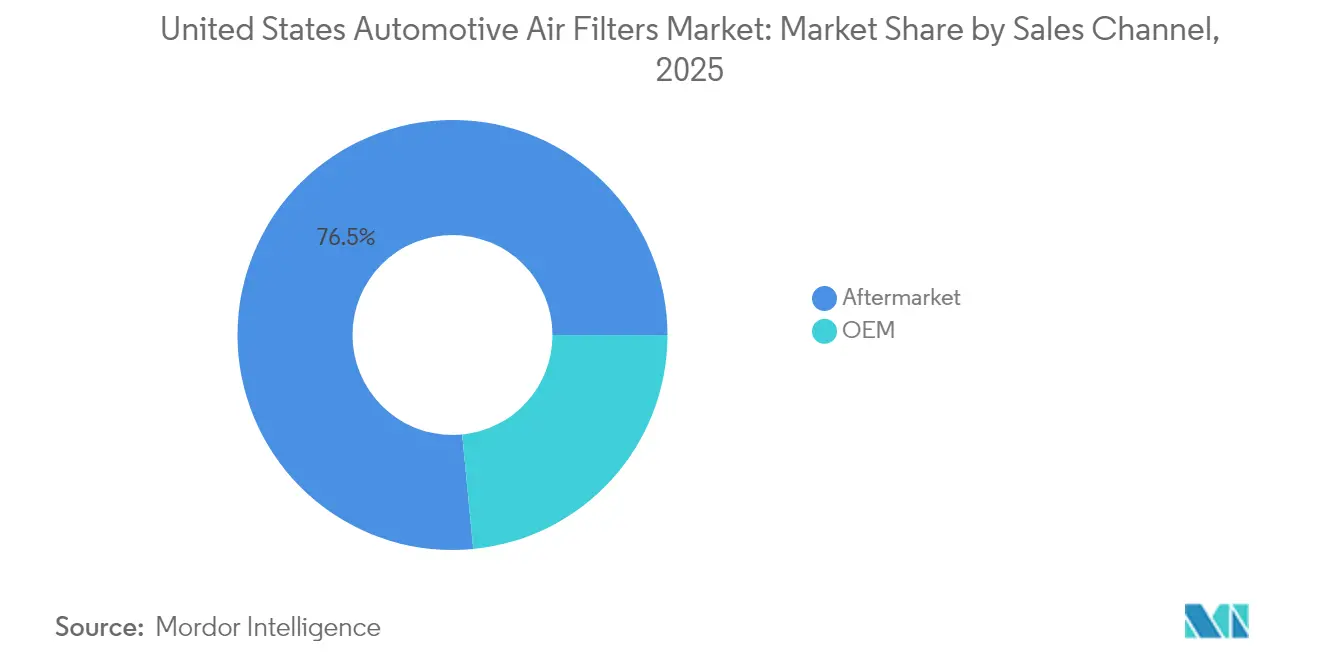
- By sales channel, the aftermarket captured 76.54% of the United States automotive air filters market share in 2025, while online retailers are forecast to expand at a 13.11% CAGR through 2031.
- By distribution channel, brick-and-mortar retail commanded 39.98% share in 2025; and is expected to post the fastest 13.11% CAGR over the forecast period.
Note: Market size and forecast figures in this report are generated using Mordor Intelligence’s proprietary estimation framework, updated with the latest available data and insights as of 2026.
United States Automotive Air Filters Market Trends and Insights
Drivers Impact Analysis*
| Driver | (~) % Impact on CAGR Forecast | Geographic Relevance | Impact Timeline |
|---|---|---|---|
| Rise in Vehicle Production and Parc Growth | +1.8% | Nationwide | Medium term (2-4 years) |
| Stringent EPA/CARB Emission Standards | +1.5% | National, with early gains in California, New York, | Short term (≤ 2 years) |
| Aging Fleet Boosting Aftermarket Demand | +1.2% | Nationwide | Long term (≥ 4 years) |
| Rising Adoption of Cabin Filters for In-Car Air Quality | +0.9% | Urban areas in California, Texas, New York, Florida | Medium term (2-4 years) |
| Advanced Thermal-Air Management Requirement for EVs | +0.7% | California, Washington, Oregon, Northeast corridor | Long term (≥ 4 years) |
| Nanofiber and Antiviral Media Enter Mass Production | +0.6% | Manufacturing hubs in Ohio, Michigan, North Carolina | Medium term (2-4 years) |
| Source: Mordor Intelligence | |||
Rise in Vehicle Production and Parc Growth
Vehicle production recovery and an expanding parc create a dual-demand surge. About 110 million units sit in the 6-14-year sweet spot for service, representing 38% of the total fleet and translating into higher filter-replacement frequency. Robust aftermarket expansion is supported by consumers deferring new-car purchases, which channels spending toward maintenance parts. OEM demand also rises as U.S. assembly plants ramp up output following supply-chain normalization. Together, these trends underpin stable volume increases across both factory-installed and replacement filters.
Stringent EPA Emission Standards
The EPA final rule for model-year 2027-2032 light-duty vehicles cuts fleet-average greenhouse-gas emissions in half and sets the first nationwide 0.5 mg/mi particulate limit. Automakers must therefore fit gasoline particulate filters on direct-injection engines, effectively adding an entirely new high-volume filter line. Compliance pressure is highest in California and other Section 177 states that historically adopt more aggressive thresholds, driving early procurement cycles that ripple through the supplier base[1].
Aging Fleet Boosting Aftermarket Demand
Older vehicles require more frequent oil, air, and cabin filter changes as component efficiency declines over time. Replacement-rate studies show that cars past year 6 need 40% more filters per service life than newer models. The aftermarket benefits because cash-constrained drivers retain vehicles longer and opt for lower-priced non-OEM parts, a pattern that proved resilient during the 2024 macro-slowdown. Suppliers with strong retail and installer networks capitalize on this structural upswing.
Rising Adoption of Cabin Filters for In-Car Air Quality
Health-conscious buyers now view a car interior as a protective bubble. Advanced cabin filters with HEPA or antiviral layers command premium price points by promising near-hospital-grade air quality. Bosch’s FILTER+pro, for instance, targets viruses, bacteria, and allergens while maintaining low restriction, demonstrating how filtration has shifted from a basic maintenance part to a wellness feature [2]. Automakers increasingly specify such products at the factory level, widening the installed base.
Restraints Impact Analysis*
| Restraint | (~) % Impact on CAGR Forecast | Geographic Relevance | Impact Timeline |
|---|---|---|---|
| Shift Toward BEVs Curbing ICE Filter Volumes | -0.8% | California, Washington, Oregon, Northeast corridor | Long term (≥ 4 years) |
| Raw-Material (Cellulose, Synthetics) Price Volatility | -0.6% | Manufacturing centers in Ohio, Michigan, North Carolina | Short term (≤ 2 years) |
| OEM Service Intervals Lowering Replacement Frequency | -0.4% | Nationwide, concentrated in newer vehicle markets | Medium term (2-4 years) |
| Growth Of Washable/Reusable Filters | -0.3% | California, Oregon, environmentally conscious regions | Long term (≥ 4 years) |
| Source: Mordor Intelligence | |||
Shift Toward BEVs Curbing ICE Filter Volumes
Battery-electric models eliminate fuel and oil filters and cut intake-air filter demand. The EPA forecasts that 30%-56% of light-duty sales will be electric by 2032, producing a structural headwind for ICE-specific categories. Although emerging BEV thermal-management filters offer partial volume substitution, they cannot fully offset the decline through 2030, tempering overall growth prospects for legacy component makers.
Raw-Material Price Volatility
Cellulose and synthetic fibers experienced double-digit inflation across 2024, and a 25% tariff on imported auto parts, effective May 2025, raised industry costs by roughly USD 8 billion per year. Manufacturers with narrow margins face tough choices between passing increases to wholesalers or absorbing hits to profitability. Many have accelerated near-shoring into Mexico and the U.S. South to reduce duty exposure and logistical uncertainty.
*Our forecasts treat driver/restraint impacts as directional, not additive. The impact forecasts reflect baseline growth, mix effects, and variable interactions.
Segment Analysis
By Material Type: Paper Dominance Faces Nanofiber Challenge
Paper still commands 41.72% of the United States automotive air filters market share in 2025, owing to low cost and wide availability. The segment’s entrenched tooling base and mass-production scale keep unit prices attractive for do-it-yourself shoppers and fleet managers alike. Nevertheless, nanofiber composites are forecast to grow at an 8.15% CAGR through 2031, the fastest among all substrates, as automakers and tier-ones specify media that deliver superior particulate capture without boosting pressure drop. Synthetic melt-blown blends occupy a mid-price niche, marrying durability with acceptable efficiency, while gauze and foam serve performance enthusiasts and specialty off-highway equipment.
Momentum is shifting as manufacturers retrofit domestic lines to mass-produce nano-enabled rolls, reducing import exposure and aligning with tariff-mitigation strategies. Sustainability pressures also influence material choice: PFAS-free coatings and recycled fibers are moving from optional to baseline requirements in new RFQs. Suppliers able to balance environmental credentials with filtration performance gain an edge in the United States automotive air filters market. Over the forecast horizon, value migration toward advanced materials supports price realization even as traditional paper volumes plateau.

By Filter Type: Cabin Filters Lead Health-Driven Growth
Cabin units generated 55.48% of 2025 revenue, underscoring the consumer pivot toward wellness features inside the vehicle. Particulate cabin filters remain the volume leader, yet HEPA and antiviral variants are advancing at a 12.57% CAGR to 2031, driven by heightened sensitivity to allergens, wildfire smoke, and airborne viruses. Intake-air filters, still essential for ICE engines, face gradual volume erosion as BEVs gain share, although medium-duty trucks and off-highway machinery sustain demand. Fuel, oil, and transmission filters hold steady in the aftermarket but plateau in OEM channels as factory-filled units adopt extended-life designs.
Premium cabin media also deliver higher margins that offset sliding sales of traditional engine-air elements. Automakers now market air-quality technology as a competitive differentiator, bundling advanced filters with connected sensors that alert drivers when replacements are due. Regulatory bodies are exploring indoor-air-quality standards, further legitimizing the category. Collectively, these forces ensure cabin products remain the principal growth engine within the United States automotive air filters market.
By Vehicle Type: Passenger Cars Drive Volume Despite EV Transition
Passenger cars represented 62.41% of the United States automotive air filters market size in 2025 and are projected to grow at a 5.62% CAGR, underpinned by fleet renewal and sustained commuter-car dependence in sprawling metro areas. Light commercial vehicles benefit from the e-commerce boom, with high utilization translating into frequent filter changes. Medium and heavy trucks add stable dollar contributions due to larger element dimensions and extended operating hours. Off-highway equipment—including construction and agriculture—delivers cyclical upside tied to infrastructure funding and commodity cycles.
Electrification reshapes long-term demand but does so unevenly across vehicle classes. Sedans and crossovers electrify first, curbing some ICE-filter volumes, whereas pickups, vans, and heavy trucks retain combustion powertrains for payload and range reasons. Suppliers hedging with BEV-specific thermal-management filters and premium cabin solutions preserve growth avenues. This diversified exposure helps stabilize overall revenues in the United States automotive air filters market.
By Sales Channel: Aftermarket Dominance Reflects Consumer Behavior
The aftermarket controlled 76.54% of 2025 revenue, propelled by cost-conscious owners and extended vehicle lifetimes. Independent garages and parts retailers capture the bulk of transactions, but e-tail is the standout growth channel. OEM service departments hold 23.46% share, catering to vehicles still under warranty or to owners loyal to dealership servicing. Suppliers that balance house-brand penetration with private-label programs for retailers position themselves best for sustained growth.
Economic uncertainty typically nudges consumers toward repairs over new-car purchases, reinforcing aftermarket heft. Loyalty programs, subscription filter kits, and fitment-guarantee promises enhance stickiness. Conversely, OEMs leverage telematics data to prompt timely service visits, defending share in younger-vehicle cohorts. These competing tactics maintain a dynamic channel mix within the United States automotive air filters market.
By Distribution Channel: Online Growth Disrupts Traditional Retail
Brick-and-mortar chains retained 39.98% share in 2025, yet online storefronts are set to expand at a 13.11% CAGR through 2031 as consumers grow comfortable sourcing maintenance parts digitally and arranging local installation. Click-and-collect models blend the advantages of immediate availability with e-commerce pricing transparency, challenging pure-play internet sellers to provide value-added content and virtual fitment verification. Service centers leverage bundled installation to defend margins, while direct-to-consumer OEM portals target premium buyers seeking genuine parts.
Hybrid fulfillment strategies are redefining inventory planning and last-mile logistics. Retailers integrate AI-driven demand forecasting to minimize stockouts and free shelf space for high-turn SKUs. At the same time, filter manufacturers employ digital configurators and augmented-reality tutorials to cut return rates. These innovations enhance the customer journey and underpin robust digital-channel expansion in the United States automotive air filters market.
Geography Analysis
California leads the United States' automotive air filters market in 2024. The Advanced Clean Trucks Regulation further accelerates the uptake of specialty filters in commercial segments. Texas follows as a manufacturing and population powerhouse, benefiting suppliers of both production-line and service-replacement filters. The state’s diverse climate, from dusty plains to humid coasts, increases replacement frequency across filter categories.
Michigan remains the intellectual and production hub for powertrain filtration research, hosting R&D centers and pilot lines for nanofiber media. Despite a mature local vehicle parc, the concentration of engineering talent ensures that most domestic prototype validation occurs within the state. The Northeast corridor—covering New York, Massachusetts, and Connecticut—features high disposable incomes and a propensity for premium cabin filters, driven by urban pollution and severe winter conditions demanding reliable HVAC dehumidification and odor removal. The Southeast, particularly Georgia and the Carolinas, is emerging as a near-shoring magnet. Lower labor costs and proximity to port infrastructure provide competitive landing points for Asian filter-media producers seeking a U.S. manufacturing base, supporting flexible supply for OEM plants across the South and Midwest. The Rocky Mountain region shows above-average growth in reusable off-road filters tied to mining and energy exploration, while Pacific Northwest states prioritize low-VOC and biodegradable media aligned with sustainability goals.
Regulatory Landscape
The US automotive air filters market is shaped primarily by emissions and trade policy rather than filter-specific mandates. The US Environmental Protection Agency (EPA) finalized its Multi-Pollutant Emissions Standards for MY 2027-2032 light-duty and medium-duty vehicles in April 2024. The framework tightens tailpipe requirements and reinforces the need for higher-efficiency particulate control on combustion platforms, supporting adoption of advanced intake-side and exhaust-related filtration solutions such as gasoline particulate filters in OEM compliance strategies.
On the trade side, a 25% Section 232 tariff on certain imported automobiles and automobile parts took effect on May 3, 2025 under Proclamation 10908 and related amendments. This directly impacts the landed cost of imported filtration components, media, and subassemblies used in OEM and aftermarket programs. In April 2026, the Bureau of Industry and Security (BIS), in coordination with the International Trade Administration (ITA), opened a quarterly inclusions window for requests to add additional automobile parts to the Section 232 tariff scope (with recurring windows in January, April, July, and October). This creates ongoing compliance and sourcing uncertainty for parts categories adjacent to filtration.
Value Chain Analysis
Upstream inputs focus on cellulose and synthetic fibers, with nanofiber and composite layers gaining use, along with supporting consumables such as resins, sealants, plastics, and metal end-caps. Filter media production and pleating or conversion are followed by assembly (gasketing, potting, end-cap bonding), validation and fitment engineering (particularly for HEPA and antiviral cabin filters and newer particulate-control applications), and then packaging and labeling for multi-channel distribution.
Downstream, the market is heavily aftermarket-led, so distribution density, SKU availability, and rapid replenishment influence the value chain. Distribution and fulfillment investments have become a differentiator: Donaldson opened a distribution center in Olive Branch, Mississippi (October 2024), and Premium Guard Inc. opened a 377,000-square-foot distribution center in Weirton, West Virginia (July 2025) in a Foreign Trade Zone to manage inventory flow and speed delivery. Partnerships combining product with inventory expertise are also increasing, including Mighty Distributing System of America expanding its heavy-duty filtration offering via a partnership with Donaldson (July 2025). Same-day logistics models are also emerging for filtration products through Filterbuy partnering with Roadie, a UPS company (June 2025).
Competitive Landscape
Market concentration is moderate as global groups and regional specialists vie for share. Technology investment is the primary differentiator; nanofiber media and antiviral coatings command premium ASPs and strengthen brand positioning.
Strategic moves illustrate a shift toward vertical integration and advanced materials. Hengst’s 2024 acquisition of an Ontario-based hydraulic-filter specialist added local capacity and diversified its North American revenue base. IDEX’s purchase of sintered-metal-pore expert Mott Corporation broadened its advanced porous-media know-how, enhancing cross-sell potential into battery-thermal applications. Atmus Filtration Technologies introduced NanoNet N3, a gradient mesh delivering higher dust-loading capacity and lower flow restriction, targeting both OE and retrofit markets. Across the board, suppliers are building direct-to-consumer storefronts to capture data, control pricing, and defend share against low-cost imports.
During the forecast period, AI-enabled predictive maintenance solutions that monitor filter pressure drop and remaining life promise to shift replacement decisions from mileage-based heuristics to sensor-driven alerts, potentially smoothing aftermarket demand cycles. Firms capable of embedding smart diagnostics into filter housings or service apps may capture higher lifetime value and forge stickier relationships with fleet operators.
United States Automotive Air Filters Industry Leaders
-
MANN+HUMMEL
-
DENSO Corporation
-
Fram Group
-
Donaldson Company Inc.
-
Cummins Filtration (Fleetguard)
- *Disclaimer: Major Players sorted in no particular order

Market Opportunities and Future Outlook
Near-shoring and consolidation of North American filtration manufacturing and distribution footprints are creating whitespace for suppliers that can deliver cost-competitive output with high service levels for a SKU-heavy aftermarket. A concrete example is Premium Guard Inc. completing Phase 2 of its acquisition of First Brands Group assets in June 2026. The company consolidated manufacturing from Greenville, Ohio into Albion, Illinois and added a 730,000-square-foot distribution center in Hebron, Kentucky, a setup aimed at faster replenishment and broader private-label programs across retail and installer channels.
On the product side, demand is shifting toward premium cabin filtration (HEPA and antiviral) and toward air-quality offerings that incorporate sensing and control into consumable filters. OEMs and suppliers are combining PM2.5 and CO2 sensing with purification actuators and related modules to automate cabin air management, creating room for filter makers to partner on complete HVAC-filtration solutions. This also supports bundling higher-margin cabin filters with clearer replacement prompts and fitment assurance in the aftermarket. Separately, the EPA’s finalized MY 2027-2032 multi-pollutant framework (April 2024) continues to support higher-efficiency particulate-control strategies on combustion vehicles in the parc, reinforcing advanced-media adoption even as the powertrain mix shifts.
Recent Industry Developments
- July 2026: MANN+HUMMEL published an update on nanofiber layers used in MANN-FILTER air filters for commercial vehicles, emphasizing higher protection and support for extended service intervals. The communication underscores competitive momentum around advanced media that can deliver performance without large pressure-drop penalties, a key purchase criterion for fleets and heavy-use duty cycles.
- July 2025: Premium Guard Inc. opened a 377,000-square-foot distribution center in Weirton, West Virginia, located in a Foreign Trade Zone, to improve inventory positioning and distribution speed. Added logistics capacity at this scale supports broader SKU availability and faster replenishment for high-turn aftermarket filtration lines.
- June 2024: Hengst Filtration completed the acquisition of Canadian-American Filter Company, adding decades of regional filtration expertise to its portfolio. The deal strengthens North American capability and can improve responsiveness to OEM and aftermarket demand that increasingly prioritizes local supply continuity.
Research Methodology Framework and Report Scope
Market Definition and Coverage
For this report, the market covers automotive air filters sold for vehicles operating in the United States, including engine intake filters and cabin air filters across OEM fitment and replacement demand.
Scope exclusions: We exclude heavy industrial HVAC filtration, stationary engine filtration outside automotive use, and vehicle air filter services when they are billed as labor-only without a separable product value.
Segmentation Overview
- By Material Type
- Paper
- Synthetic
- Gauze
- Foam
- Nanofiber / Composite
- Others
- By Filter Type
- Intake Filters
- Cellulose Intake
- Synthetic Intake
- Nanofiber / Composite Intake
- Cabin Filters
- Particulate
- Activated Carbon
- HEPA / Antiviral
- Intake Filters
- By Vehicle Type
- Passenger Cars
- Light Commercial Vehicles
- Medium and Heavy Commercial Vehicles
- Off-Highway (Construction and Agriculture)
- Two-Wheelers
- By Sales Channel
- OEM
- Aftermarket
- By Distribution Channel
- Online Retailers
- Brick and Mortar Retail
- Service Centers and Dealerships
Data Sources, Market Sizing, and Validation
Desk Research
Desk work started with public datasets that help explain the demand pool and replacement cycles. We referenced the US EPA to understand emissions direction, used US DOT and state DMV fleet statistics for vehicle population, and relied on US Census trade data for imports and exports that influence filter availability and pricing.
We also used information from association websites and standards bodies such as SAE, plus peer reviewed papers on filtration media performance and cabin air quality. Company filings, investor presentations, product catalogs, and credible automotive press were used to cross-check product positioning and channel mix. Where needed, paid subscriptions supported company financials and intelligence, and we used patent databases and an import export shipment-level database to sanity-check trade flows. These are illustrative sources only, and additional public references were used to fill gaps and validate assumptions.
Primary Interviews and Surveys
Expert interviews and surveys with manufacturers, distributors, retailers, repair professionals, and fleet maintenance buyers in the United States test secondary findings, fill gaps in replacement timing and pricing, and refine OEM and aftermarket assumptions. We recheck unusual responses against channel evidence before final analysis.
Distribution of primary research fieldwork respondents
| Company type | Respondent position |
|---|---|
| Top tier: 30% | CXOs: 15% |
| Mid tier: 50% | Functional/Unit leaders: 35% |
| Smaller Players: 20% | Managers: 50% |
Market-Sizing & Forecasting
The sizing logic starts from a top-down rebuild of the served vehicle parc in the United States, then converts that demand pool into annual filter consumption using replacement rates and average filters per vehicle. Value is calculated by applying price bands by filter type and material, and separating OEM fitment from the aftermarket using build and service channel indicators.
To keep totals realistic, we also did selective bottom-up checks using sampled ASP x volume math from supplier and channel discussions, along with distribution-channel markups where they are visible. Key inputs used in the model include vehicle population and age mix, average miles driven, oil change and service visit cadence (which affects replacement timing), cabin filtration adoption levels, and the share shift toward online retailers versus brick-and-mortar and service centers. Forecasting was run with scenario analysis supported by expert consensus on variables such as emissions direction, consumer focus on in-cabin air quality, and media upgrades toward activated carbon and HEPA.
Where bottom-up clues were incomplete for smaller channels or private label flows, we filled gaps using conservative share ranges, then re-checked the totals against trade signals and service channel feedback before finalizing.
Data Validation & Update Cycle
Outputs were validated through multiple checks so that no single source drove the result. We compared implied units per vehicle against service patterns, checked price progression against observed retail and wholesale movements, and reviewed any sharp year-on-year swings against known events such as tariff changes or shifts in channel stocking.
Before sign-off, the model goes through analyst review steps, where assumptions that drive most of the value are challenged and recalculated. The report is refreshed annually, and interim updates are triggered when material events occur, such as regulation changes, major supply disruptions, or step-changes in media adoption. Right before delivery, a fresh pass is completed so clients receive the most current view based on the latest available signals.
Mordor Intelligence's U S Automotive Airfilters Market Size Compared Against Other Published Estimates
Published market values for US automotive air filters can look far apart, even when the topic sounds the same, because the boundaries and the pricing basis are not always aligned. Differences usually come from what is counted as automotive, whether cabin filters are treated fully or partially, and how OEM versus aftermarket pricing is handled.
By tracking replacement-driven volumes, channel-specific ASP movement, and filter-type coverage, Mordor Intelligence keeps the estimate tied to a defined US demand pool, which reduces over-counting from industrial air filtration spillovers or wholesale-to-retail double counting.
Benchmark comparison
| Source | Market Size | Gaps in Research Methodology |
|---|---|---|
| Mordor Intelligence | USD 0.95 B (2025) | |
| Global Consultancy A | USD 6.50 B (2024) | The figure appears to apply broader pricing layers and a wider product boundary, which can inflate value if retail markups and adjacent filtration categories are included along with automotive filters. |
| Trade Data Publisher B | USD 1.40 B (2024) | This view is closer to a wholesale intake-filter definition and is anchored to trade and producer-level value, which can understate the total when cabin filters and downstream channel pricing are not fully captured. |
The spread mainly comes from scope and price-layer choices, not from a simple disagreement on demand direction. When the model is anchored to vehicle parc, replacement cadence, and clearly separated OEM versus aftermarket pricing, the resulting market size stays traceable to inputs that can be rechecked year after year.
Key Questions Answered in the Report
What is the current size of the United States automotive air filters market?
The market stands at USD 1 billion in 2026 and is forecast to reach USD 1.31 billion by 2031.
Which filter type is growing the fastest?
HEPA and antiviral cabin filters are expanding at a 12.57% CAGR between 2026-2031, driven by heightened health awareness.
Why does the aftermarket hold a larger share than OEM channels?
Extended vehicle lifespans and consumer price sensitivity push owners toward lower-cost replacement parts, giving the aftermarket 76.54% share in 2025.
How will the shift to electric vehicles affect filter demand?
BEVs remove several ICE-specific filters, reducing volumes, yet they introduce opportunities for advanced thermal-management and high-end cabin filtration; overall impact is a gradual mix shift rather than an immediate decline.
Which United States regions show the highest growth potential?
California leads in regulatory-driven adoption of advanced filters, Texas benefits from vehicle production and population growth, and the Southeast gains from near-shoring manufacturing moves.