
Market Overview
| Study Period | 2021 - 2031 |
|---|---|
| Forecast Data Period | 2026 - 2031 |
| Historical Data Period | 2021 - 2024 |
| Market Volume (2026) | 82.25 gigawatt |
| Market Volume (2031) | 121.80 gigawatt |
| Growth Rate (2026 - 2031) | 8.17 % |
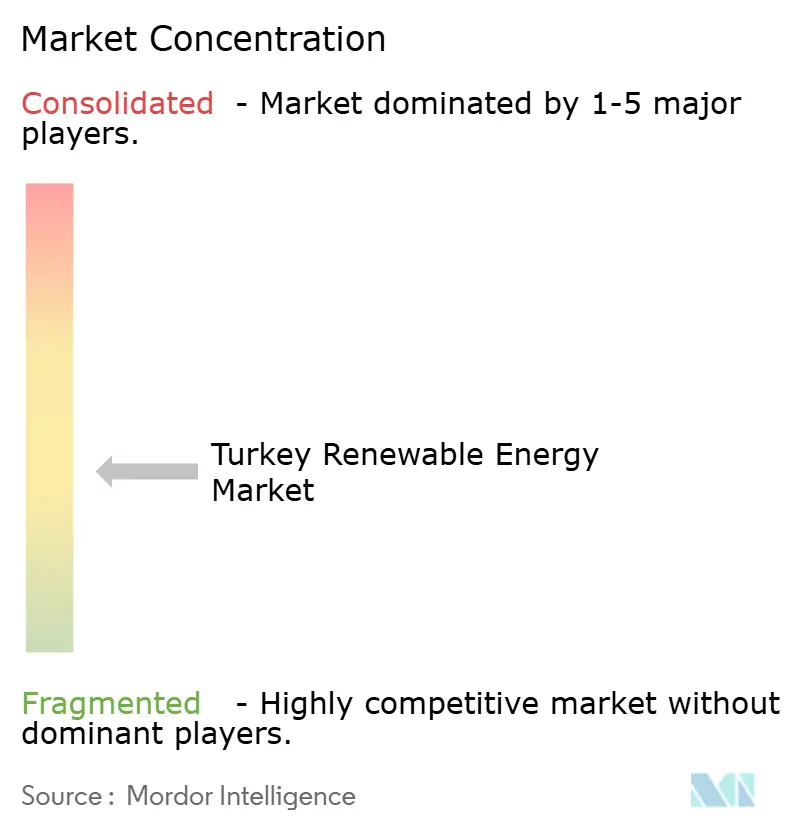
| Market Concentration | Medium |
Major Players *Disclaimer: Major Players sorted in no particular order Image © Mordor Intelligence. Reuse requires attribution under CC BY 4.0. | |
Turkey Renewable Energy Market Analysis by Mordor Intelligence
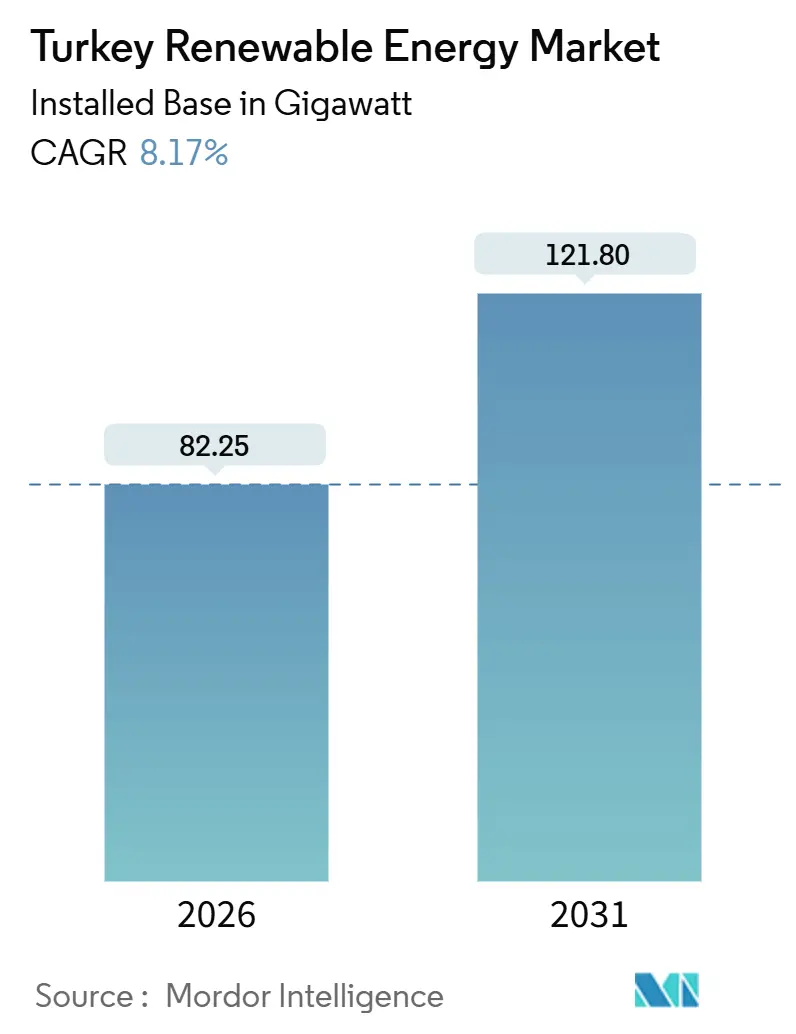
The Turkey Renewable Energy Market size in terms of installed base is expected to grow from 82.25 gigawatt in 2026 to 121.80 gigawatt by 2031, at a CAGR of 8.17% during the forecast period (2026-2031).
The Turkey renewable energy market is expanding because solar auctions now clear at EUR 32.5–55 per MWh, corporate PPAs outcompete grid tariffs, and a 1:1 storage mandate begins to lift ancillary-service revenues. Rapid growth in unlicensed commercial and industrial (C&I) projects signals that distributed self-consumption is easing grid-connection queues. Hybrid wind–solar plants smooth output, raise capacity factors, and help the Turkey renewable energy market sidestep Western Anatolia congestion. Ankara’s USD 2.5 billion solar-manufacturing plan and syndicated loans worth more than USD 1 billion for new wind farms underline rising capital inflows. Yet lira depreciation, transmission bottlenecks, and seasonal hydro swings temper near-term momentum across the Turkey renewable energy market.
Key Report Takeaways
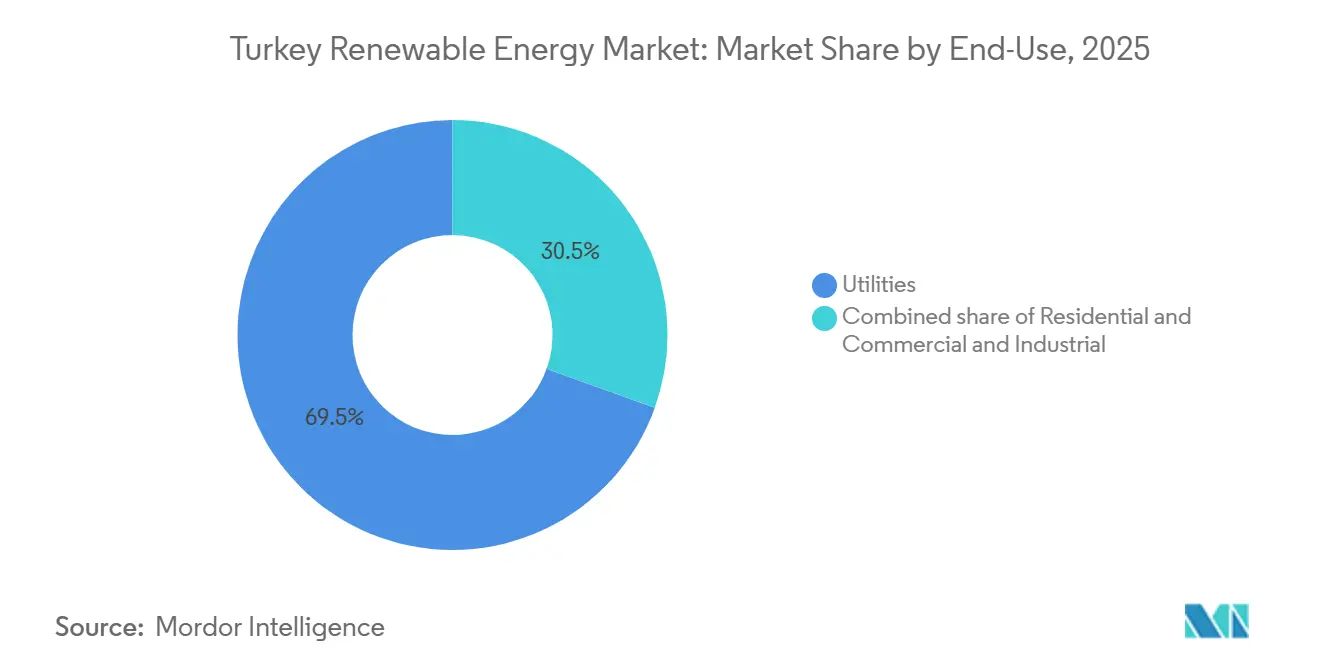
- By technology, hydropower led with 43.4% of Turkey's renewable energy market share in 2025, while solar capacity is forecast to expand at a 15.0% CAGR through 2031.
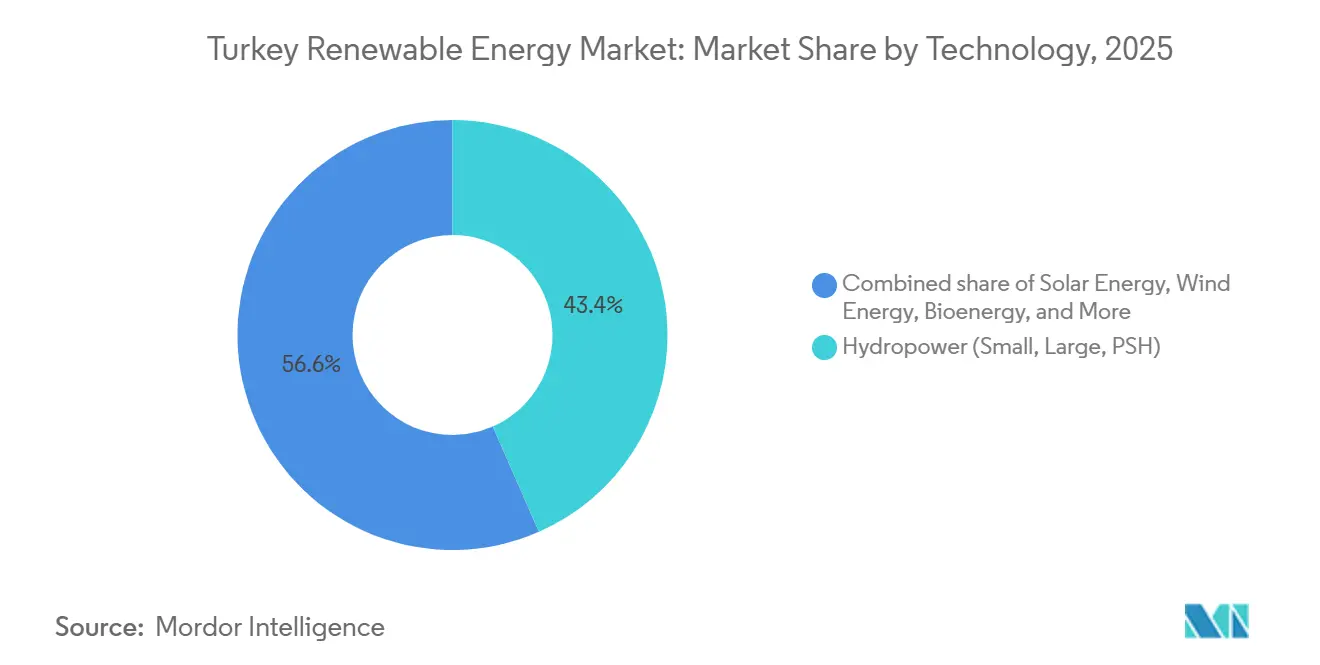
- By end-user, utilities accounted for 69.5% of the Turkey renewable energy market size in 2025, whereas the C&I segment is advancing at a 9.5% CAGR through 2031.
Note: Market size and forecast figures in this report are generated using Mordor Intelligence’s proprietary estimation framework, updated with the latest available data and insights as of January 2026.
Turkey Renewable Energy Market Trends and Insights
Drivers Impact Analysis*
| Driver | (~) % Impact on CAGR Forecast | Geographic Relevance | Impact Timeline |
|---|---|---|---|
| Grid-connected YEKA Auctions Accelerating Utility-scale Solar Buildout | +1.8% | National, concentrated in Central Anatolia solar zones | Medium term (2–4 years) |
| Rapid Deployment of Hybrid Wind-Solar Plants to Optimize Existing Grid Capacity | +1.2% | Western Anatolia, Marmara, Aegean regions | Short term (≤ 2 years) |
| Stranded Gas Import Costs Driving Urgent Diversification to Domestic Renewables | +1.5% | National | Short term (≤ 2 years) |
| Emerging Green-Hydrogen Export Ambitions Boosting Wind-Electrolyzer Projects | +0.8% | Coastal regions (Marmara, Black Sea, Mediterranean) | Long term (≥ 4 years) |
| Corporate PPA Boom Led by Automotive & White-Goods Exporters Seeking RE100 Compliance | +1.0% | Industrial hubs (Istanbul, Bursa, Kocaeli, Izmir) | Medium term (2–4 years) |
| Geothermal Heat Utilisation in Agri-Food Processing Hubs of Aydın & Denizli | +0.3% | Western Anatolia (Aydın, Denizli, Manisa) | Medium term (2–4 years) |
| Source: Mordor Intelligence | |||
Grid-Connected YEKA Auctions Accelerating Utility-Scale Solar Buildout
YEKA tenders awarded 1,200 MW of wind in January 2025 and 800 MW of solar in February 2025, locking in 15-year offtake at EUR 32.5–55 per MWh.[1]International Energy Agency, “Turkey Energy Policies Review 2024,” iea.org Developers must close grid-connection deals within 18 months, so vertically integrated conglomerates dominate awards, reinforcing scale advantages inside the Turkey renewable energy market. Solar capacity doubled from 11.3 GW in 2023 to 20 GW in 2024, hitting the 18 GW policy milestone 18 months ahead of plan. The HIT-30 industrial program steers USD 2.5 billion toward cell plants that will manufacture 15 GW annually by 2030, supporting job creation and import substitution. As auctions compress timelines and expand local content, utility-scale solar will remain the fastest catalyst of growth across the Turkey renewable energy market.
Rapid Deployment of Hybrid Wind–Solar Plants to Optimize Existing Grid Capacity
Regulators in 2024 allowed hybrids to oversubscribe interconnections by 30% if dispatch stays within the contracted limit.[2]Ember Climate, “Hybrid Wind-Solar Trends in Turkey,” ember-climate.org Pairing 100 MW of wind with 30 MW of solar on a single feeder lifts capacity factors by up to 12 percentage points and cuts levelized cost by 15%. Roughly 1 GW is online and 3.5 GW in the queue, illustrating how the Turkey renewable energy market converts stranded grid assets into revenue. Hybrids also hedge against hydro droughts because mandatory 1:1 batteries shift output from midday peaks to evening demand. This flexibility turns transmission congestion from a restraint into an engineering opportunity for the Turkey renewable energy market.
Emerging Green-Hydrogen Export Ambitions Boosting Wind-Electrolyzer Projects
The 2024 hydrogen roadmap targets 2 GW of electrolyzers by 2030 and 70 GW by 2053.[3]Hydrogen Technologies Platform, “National Hydrogen Roadmap,” hypat-global.org A EUR 3 million EU grant funds a 10 MW pilot that blends hydrogen into the gas grid. World Bank studies find Marmara offshore wind can deliver electrons for USD 3 kg of hydrogen by 2030, undercutting gray hydrogen. Domestic refiners and steel mills will absorb early volumes, yet export plans expect 2 million tonnes by 2040, positioning the Turkey renewable energy market as a regional hydrogen bridge between the Middle East and Europe.
Corporate PPA Boom Led by Automotive and White-Goods Exporters Seeking RE100 Compliance
Unlicensed C&I solar added 8.9 GW between 2023 and 2024, accounting for 90% of new solar. A 10-year PPA at EUR 40/MWh beats the grid price of EUR 55/MWh, delivering immediate savings and Scope 2 compliance for exporters. Automotive shipments of USD 32 billion in 2024 face EU carbon tariffs from 2026, so factories in Bursa, Kocaeli, and Sakarya are rushing to lock in renewable certificates. The C&I rush underscores how corporate risk management is rewriting demand curves inside the Turkey renewable energy market.
Restraints Impact Analysis*
| Restraint | (~) % Impact on CAGR Forecast | Geographic Relevance | Impact Timeline |
|---|---|---|---|
| Congested Western Anatolia Transmission Corridors Limiting New Feed-ins | -0.9% | Western Anatolia, Marmara, Aegean regions | Short term (≤ 2 years) |
| Lira Volatility Inflating Imported Turbine & Module CAPEX | -1.1% | National | Short term (≤ 2 years) |
| Seasonal Hydro Variability from Euphrates Basin Drought Cycles | -0.5% | Southeastern Anatolia, Euphrates-Tigris basin | Medium term (2–4 years) |
| Slow Environmental Permitting for Offshore Wind Leasing Zones | -0.3% | Marmara Sea, Black Sea coastal zones | Long term (≥ 4 years) |
| Source: Mordor Intelligence | |||
Congested Western Anatolia Transmission Corridors Limiting New Feed-ins
Substations in Izmir, Manisa, and Balıkesir run at up to 95% of capacity during peaks, stretching grid-connection queues to three years.[4]World Bank, “Transmission System Transformation Project,” worldbank.org Curtailment hit 6% of potential wind output in early 2024, eroding revenue by EUR 15 million. Hybrids and batteries provide partial relief, yet full resolution awaits USD 1 billion of line upgrades due in 2027. Until then, congestion slows the roll-out pace of the Turkey renewable energy market in its most resource-rich zones.
Lira Volatility Inflating Imported Turbine and Module CAPEX
The lira halved in value between January 2023 and December 2024. A VAT re-classification lifted landed module prices from USD 0.21/W to USD 0.51/W, while an anti-dumping tariff added USD 25/m² on Asian panels. Battery systems rose 30% after a tax surcharge, adding two years to payback. Lenders shortened tenors and raised spreads, squeezing developer margins across the Turkey renewable energy market.
*Our forecasts treat driver/restraint impacts as directional, not additive. The impact forecasts reflect baseline growth, mix effects, and variable interactions.
Segment Analysis
By Technology – Solar Surges as Hydro Plateaus
Solar recorded the fastest 15.0% CAGR outlook, doubling to 20 GW in 2024 on the back of YEKA awards and C&I self-consumption. Hydropower’s 43.4% share in 2025 makes it the largest block, yet additions slow because the best dam sites are built out and pumped-storage permits need more than 36 months. Wind sits at 11.4% of capacity and benefits from co-location that boosts capacity factors by 8 - 12 points. Bioenergy supplies 1.5% of generation, anchored by Istanbul’s waste-to-energy plant. Geothermal covers 3.2% with direct-use upside in food hubs. Ocean energy remains absent. The 120 GW wind-and-solar target for 2035 means these two technologies will represent over 60% of the Turkey renewable energy market size by the end of the forecast period.
Solar continues to outpace other resources because tariff certainty, domestic manufacturing incentives, and relaxed site rules align. Hydropower growth plateaus as ecological scrutiny increases. Wind accelerates where grid capacity allows, and hybrid plants help skirt curtailment. Geothermal’s direct heat supplies agro-clusters with cheaper process energy. Bioenergy scales through municipal waste contracts, diversifying feedstocks. Together, evolving technology shares reshape the Turkey renewable energy market toward a more balanced mix.


By End-User – Utilities Lead While C&I Self-Consumption Accelerates
Utilities controlled 69.5% of capacity in 2025 and still enjoy pooled demand and long-term PPAs. Regulatory mandates require state distributors to meet a 50% renewable supply by 2030, so utility pipelines stay full. The C&I segment, however, grew 82% in 2023-24 after cross-zone rules allowed factories to contract remote solar, and it now drives 90% of annual solar additions. Rooftop residential remains modest given 11-year paybacks, although a USD 1 billion World Bank program targets 7.5 GW of distributed solar plus batteries by 2035.
Utility dominance stems from financing scale and grid priority. Yet export-oriented manufacturers rush to secure renewable attributes before EU carbon levies bite. Residential uptake will rise if VAT waivers and cheap loans arrive. The shift toward self-consumption broadens participation, embedding thousands of new actors in the Turkey renewable energy market.
Geography Analysis
Turkey’s 82.25 GW renewable fleet clusters where resources, load, and grid overlap. Western Anatolia and Marmara host 45% of wind, thanks to 7-8 m/s speeds and dense industry. Central Anatolia secures 30% of solar on high irradiance plains. Southeastern dams provide 40% of hydro but face water stress, with flow down 15-20% during drought. Black Sea and Marmara waters hold 10 GW offshore potential, yet permitting lags. Eastern Anatolia’s rugged terrain limits projects despite strong winds. Mediterranean geothermal wells in Aydın and Denizli promise heat for agro-processing.
Regional growth skews forward. Central Anatolia solar could rise 16–18% yearly to 2031. Western corridors will absorb 40% of new wind once 800 km of line upgrades finish in 2027. Hydro in the southeast grows below 2% because viable sites are scarce. Offshore zones may add 2–3 GW if licenses emerge by mid-2026. Without regulatory clarity, resource-rich coasts wait, constraining geographic diversification in the Turkey renewable energy market.
Regulatory Landscape
Turkey regulates renewable generation through the Energy Market Regulatory Authority (EMRA) and uses the Renewable Energy Resource Areas (YEKA) mechanism (under the YEKA regulation published in the Official Gazette in 2016) to allocate sites and run competitive tenders with local-content and execution requirements. The National Energy Plan 2035 provides the overall policy direction, setting a target of 120 GW combined wind and solar by 2035 and positioning renewables as a majority share of installed capacity, while TEIAS oversees transmission planning and integration for new capacity.
Recent rule updates have focused on grid integration and measurement. An Official Gazette decision dated April 2, 2026 introduced hourly net metering (mahsuplasma) protocols for renewable generation and required supporting infrastructure to be in place by May 1, 2026, tightening settlement mechanics for self-consumption and export profiles. Separately, a 2025 legislative proposal indicated faster permitting and an 85% discount on land and easement fees for projects commissioned by December 31, 2030, reinforcing a commissioning deadline that shapes project structuring and timelines.
Competitive Landscape
The top five players, İçtaş, Kalyon, Zorlu, Enerjisa, and Limak, hold 30–35% of capacity, leaving room for over 200 smaller firms. Enerjisa will add 1 GW by early 2026 after a USD 1 billion loan, lifting its renewable ratio to 60%. Limak’s green Eurobond refinances 1,141 MWe and backs agrivoltaic pilots. Polat and Kontrolmatik pioneer storage, installing Turkey’s largest 4 MWh battery and contracting 1 GWh wind-plus-storage, respectively. Siemens Gamesa’s Izmir nacelle plant meets 30% of turbine demand and signals localisation momentum.
Hybrid engineering skill and domestic content decide auction wins because the 1:1 storage mandate raises complexity. The HIT-30 policy waives VAT when modules are 100% Turkish-made, pushing backward integration into polysilicon. Offshore wind remains open; no firm yet holds permits, so first movers that master EIAs could secure premium Marmara leases. Moderate fragmentation and rising technical thresholds define competition in the Turkey renewable energy market.
Turkey Renewable Energy Industry Leaders
İÇ İçtaş Energy Investment Holding
Enerjisa Üretim
Kalyon Enerji
Sanko Energy Group
Polat Enerji Yatirimlari A.Ş.
- *Disclaimer: Major Players sorted in no particular order

Market Opportunities and Future Outlook
Utility-scale growth is increasingly tied to YEKA auctions, which create capacity-award whitespace for developers and OEMs that can meet compressed schedules and localization conditions. In July 2026, the Ministry of Energy and Natural Resources announced a new YEKA tender pipeline totaling 2.4 GW (14 solar projects totaling 900 MW and 7 wind projects totaling 1.5 GW), giving a clearer near-term route for new capacity awards and the associated EPC, turbine, module, and balance-of-plant demand.
Distributed and self-consumption renewables offer another scaling path that depends on financing availability and metering modernization. In June 2026, the World Bank Group approved additional financing to expand Turkiye's distributed renewable energy market, supporting the shift toward unlicensed C&I solar and storage-enabled projects. On the corporate side, large industrials are increasing on-site and contracted renewable spending to manage electricity costs and export competitiveness, illustrated by BBVA-backed export financing in July 2026 for Tosyali's solar buildout (including an initial 261 MW self-consumption phase) and by storage-integrated wind project structures such as Aksa Enerji's financed Mersin project.
Recent Industry Developments
- July 2026: Enerjisa Uretim completed financing for a 250 MW wind portfolio across three projects in Mugla via a USD 180 million loan from FMO and DEG. The close supports near-term construction and reinforces the role of international development lenders in funding large onshore wind additions.
- June 2026: The World Bank Group approved EUR 400 million (USD 468.4 million) in additional financing to expand Turkiye's distributed renewable energy market. The funding supports wider deployment of distributed solar and related grid upgrades, strengthening the pipeline for C&I self-consumption projects.
- May 2026: The Nordex Group received a new 110 MW order from Eksim Enerji in Turkiye for the Balikesir-3 wind farm, covering 16 N175/6.X turbines and their installation. The deal adds to the active onshore wind order book and signals continued procurement of higher-capacity turbine platforms in the local market.


Research Methodology Framework and Report Scope
Market Definition and Coverage
For this report, the market is defined as Turkey's grid connected renewable power generation base, measured by installed capacity in gigawatts across operating projects and capacity additions within the stated study period.
Scope exclusions: Off grid systems, stand alone energy storage, and renewable based hydrogen production assets are excluded from the sizing unless they are counted as grid connected generation capacity.
Segmentation Overview
- By Technology
- Solar Energy (PV and CSP)
- Wind Energy (Onshore and Offshore)
- Hydropower (Small, Large, PSH)
- Bioenergy
- Geothermal
- Ocean Energy (Tidal and Wave)
- By End-User
- Utilities
- Commercial and Industrial
- Residential
Data Sources, Market Sizing, and Validation
Desk Research
Desk research was used to build the starting dataset for installed capacity, yearly additions, and technology level baselines, then carried into the model. We relied on public and official sources such as Turkey's energy regulator publications, the national transmission operator disclosures, energy ministry statistics, and international agency databases that track power capacity and generation.
To keep the assumptions grounded, we also reviewed company filings and investor presentations for project commissioning timelines, along with association websites and reputable press for auction announcements and policy changes. Where it helped close gaps on ownership and project status, a paid subscription focused on company financials and intelligence was used as a cross check, and patent databases were used lightly to sense technology direction rather than to size demand. These desk research sources are illustrative only, and many other public materials were reviewed for collection, validation, and clarification.
Primary Interviews and Surveys
Interviews and surveys in Turkey cover developers, utilities, engineering and construction specialists, equipment distributors, and project finance professionals. Their input is used to test commissioning assumptions, identify projects missing from public records, clarify delays or changes in project status, and assess the technology outlook before the model is finalized.
Distribution of primary research fieldwork respondents
| Company type | Respondent position |
|---|---|
| Top tier: 28% | CXOs: 15% |
| Mid tier: 47% | Functional/Unit leaders: 30% |
| Smaller Players: 25% | Managers: 55% |
Market-Sizing & Forecasting
The core sizing logic is top-down and is built by reconstructing Turkey's renewable installed capacity from official capacity series and tracked project commissioning, then rolling it forward by technology. Once the annual capacity base is set, it is corroborated with selective bottom-up approximations, such as sample roll ups of announced project sizes, channel checks on EPC backlogs, and simple volume based reality checks when inputs looked stretched.
Several market fingerprints were used as model inputs, including the historical pattern of annual capacity additions, auction and licensing outcomes, grid connection readiness, technology mix shifts between hydro, wind, solar, geothermal, and bioenergy, and typical commissioning delays that show up during permitting and financing. Forecasts were built using scenario analysis, where the base case is anchored to policy visibility and a confirmed pipeline, and then optimistic and conservative cases adjust assumptions like auction award conversion and average project lead times. When a bottom-up view was incomplete for a year, gaps were handled by applying technology specific carryover rates from the validated pipeline into the next period, before being reconciled back to the top-down totals.
Data Validation & Update Cycle
Validation is done through triangulation between the model outputs and independent signals, such as regulator capacity totals, grid operator snapshots, and year over year commissioning patterns that should not break without a clear reason. If a technology total looked inconsistent with recent awards or observed build cycles, the inputs were reviewed again and targeted re-contacts were triggered to confirm whether timing or scope needed adjustment.
Before sign off, the numbers go through multi step analyst reviews that include variance checks against prior editions and sanity checks on implied additions by year. Reports are refreshed annually, and interim updates are made when material events occur, such as a major auction change or a policy shift affecting tariffs. Right before delivery, an analyst performs a fresh pass to ensure the latest public releases are reflected in the final view.
Mordor Intelligence's Turkey Renewable Energy Market Estimate Compared With Other Published Estimates
Published estimates for Turkey renewable energy often do not match because the unit of measurement and the boundary of what is being counted can change from one publisher to another. Some sources talk in value terms in USD, while others focus on physical capacity, and even within capacity, the treatment of grid connected versus off grid systems can move the number.
The gap is also shaped by refresh cadence and timing choices, where exchange rates, inflation pass through, and average price assumptions can shift value based estimates without any real change in gigawatts. In our checks, capacity totals stayed consistent when they were tied to regulator series and project commissioning, whereas value based estimates moved more with assumed capex and tariff paths across years.
Benchmark comparison
| Source | Market Size | Gaps in Research Methodology |
|---|---|---|
| Mordor Intelligence | USD 82.25 B (2026) | |
| Global Consultancy A | USD 12.53 B (2024) | Uses a revenue style value frame that depends on assumed capex and pricing paths, and the timing of currency conversion can materially swing the USD number even if capacity is unchanged. |
| Industry Publisher B | USD 27.45 B (2032) | Extends the horizon and applies growth rates that can embed aggressive pipeline conversion, and it is not always clear if hybrid, off grid, or adjacent energy assets are folded into the value total. |
The table shows that the spread is mainly about measurement and timing, not only about growth expectations. By refreshing key assumptions close to publication, keeping currency timing consistent, and validating commissioning against official series, Mordor Intelligence keeps the estimate tied to what is actually being added to the grid and when.


Key Questions Answered in the Report
How large is the Turkey renewable energy market in 2026?
Installed capacity reaches 82.25 GW and is on track for 121.80 GW by 2031.
Which resource grows the fastest through 2031?
Solar leads with a 15.0% CAGR driven by YEKA auctions and C&I self-consumption.
Why do Turkish manufacturers sign corporate PPAs?
Ten-year solar PPAs near EUR 40/MWh beat grid tariffs and help exporters meet EU carbon rules.
What delays offshore wind projects?
Environmental assessments of up to 24 months and undefined licensing slow investment in Marmara and Black Sea zones.
How does grid congestion affect new projects?
Western substations operate near capacity, extending connection queues to three years and raising curtailment to 6% of wind output.
Page last updated on:


 Your data is secure and never sold or shared.


