
Tunisia Fruit And Vegetable Market Analysis by Mordor Intelligence
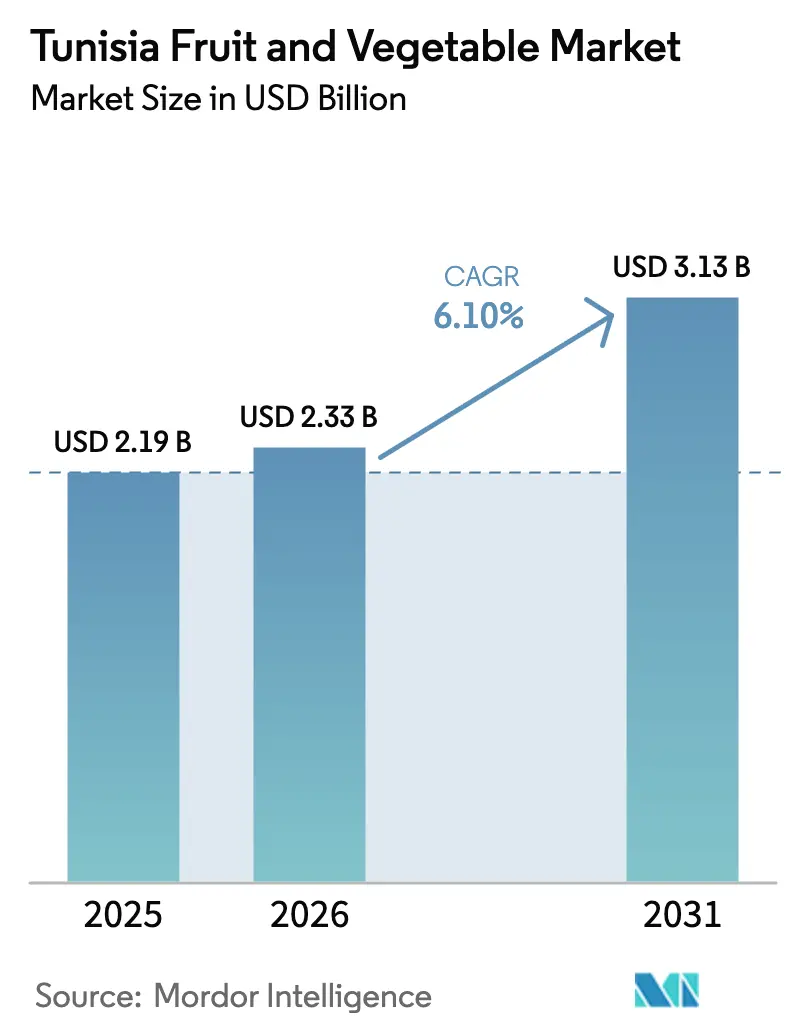
The Tunisia Fruit and Vegetable Market size was valued at USD 2.19 billion in 2025 and is estimated to grow from USD 2.33 billion in 2026 to reach USD 3.13 billion by 2031, at a CAGR of 6.10% during the forecast period (2026-2031). This outlook positions the Tunisia fruit and vegetable market as a resilient pillar of national employment despite water scarcity that has pushed annual renewable availability down to 357 cubic meters per person. The efficient adoption of drip irrigation underpins growth, as does the rollout of geothermal greenhouses in the southern oases, and the expanding European Union demand for certified produce is further fueling the growth of technological adoption in the Tunisian fruits and vegetables market. Tomato canning, date processing, and citrus packing collectively attract private equity and multilateral financing that shore up the supply chain. Export prospects also benefit from Tunisia’s proximity to France and Libya, which shortens shipping times and limits cold-chain exposure.
Key Report Takeaways
- By produce type, vegetables led with 65% Tunisia fruit and vegetable market share in 2025, while fruits are projected to expand at a 6% CAGR through 2031.
Note: Market size and forecast figures in this report are generated using Mordor Intelligence’s proprietary estimation framework, updated with the latest available data and insights as of January 2026.
Tunisia Fruit And Vegetable Market Trends and Insights
Drivers Impact Analysis*
| Driver | (~) % Impact on CAGR Forecast | Geographic Relevance | Impact Timeline |
|---|---|---|---|
| Rising Maltese-orange export push to France from Tunisia | +0.8% | Cap Bon and Nabeul in Tunisia, French wholesale hubs | Medium term (2–4 years) |
| Accelerated build-out of geothermal-heated greenhouse tomato capacity in Tunisia’s Southern Oases | +0.9% | Tozeur, Kebili, Gabes, winter demand hubs in the European Union | Long term (≥4 years) |
| International Finance Corporation (IFC)-backed capacity growth in date processing | +0.7% | Kebili and Tozeur date belt, global importers | Medium term (2–4 years) |
| Government drip-irrigation subsidies for water efficiency | +0.6% | National with early gains in Cap Bon, Kairouan, and Sfax | Short term (≤2 years) |
| Duty-free European Union (EU) quota for early-season potatoes | +0.5% | Northern plains, buyers in France, Italy, Germany | Short term (≤2 years) |
| Private-equity funding into tomato processor SICAM (Industrial Food Canning Company) | +0.6% | Mejez-el-Bab and Cap Bon, European Union and Libya corridors | Medium term (2–4 years) |
| Source: Mordor Intelligence | |||
Rising Maltese-orange export push to France from Tunisia
Tunisia’s targeted push to expand Maltese-orange shipments to France bolsters market growth by unlocking a larger, higher-value export channel at the very start of the European citrus season. Government co-financing of pre-cooling units reduces field heat within six hours, extends shelf life, and enables exporters to fill reefer containers quickly, which improves delivered-quality scores and supports premium pricing that can be 15-20% above that of Valencia oranges. By aiming to triple volumes beyond the 51,449 metric ton baseline recorded in the 2024/2025 season, the program materially enlarges revenue potential and spreads fixed logistics costs over more cartons, improving margins for growers and packers. Compliance with the European Union’s pest-free regulations also raises entry barriers for rival suppliers, securing market share for Tunisian fruit and translating directly into higher foreign-exchange earnings that stimulate reinvestment across the broader fruit and vegetable value chain[1]Source: European Union, “Commission Implementing Regulation 2019/2072,” eur-lex.europa.eu .
Accelerated build-out of geothermal-heated greenhouse tomato capacity in Tunisia’s Southern Oases
Greenhouses heated by 60 to 70 degrees Celsius aquifer water stretch harvests into the November to March window when Rotterdam prices peak. Heating costs are approximately 70% lower than those of diesel tunnels, lifting margins for exporters committed to off-season contracts. Yields reach 23,000 to 24,000 kg per hectare, roughly 80% higher than open-field plots. Scalability depends on aquifer recharge rates and retailer willingness to pay a low-carbon premium.
International Finance Corporation (IFC)-backed capacity growth in date processing
A EUR 10 million (USD 10.5 million) International Finance Corporation loan has been injected into Tunisia’s date-processing segment, doubling national concentrate capacity and installing lines that convert lower-grade fruit into juice and syrup, earning margins 30 to 40% above those of bulk exports. The scale-up increases aggregate export potential to 25,000 tons by 2026, ensuring buyers in Europe and North America of steadier Deglet Nour volumes. Linked certification programs have already increased organic acreage in Kebili and Tozeur to over 4,200 hectares, expanding the pipeline of traceable supply. The financing template is now spurring additional processors to secure similar deals with local banks, signaling wider capital inflows that strengthen Tunisia’s entire fruit and vegetable value chain[2]Source: International Finance Corporation, “IFC provides USD 10 million in financing to Tunisian date exporter,” ifc.org .
Government drip-irrigation subsidies for water efficiency
Fifty percent capital grants cover buried diffuser kits that reduce water use by up to 54% and increase yields by as much as 50%. Farmers must install flow meters and file monthly extraction reports, which improves transparency and curbs illegal pumping. Tomato and pepper growers adopt the most efficient methods because they face the steepest water tariffs. Long-term success rests on strict enforcement as solar-powered pumps spread nationwide[3]Source: Agence Française de Développement, “Tunisia,” afd.fr.
Restraints Impact Analysis*
| Restraint | (~) % Impact on CAGR Forecast | Geographic Relevance | Impact Timeline |
|---|---|---|---|
| High post-harvest loss due to limited cold-chain nodes | -0.7% | National, acute in the southern oases and the central plains | Short term (≤2 years) |
| Recurrent drought and rising groundwater salinity | -1.2% | The whole country with severe stress in Kairouan, Sfax, Kebili, and Gabes | Long term (≥4 years) |
| Fragmented smallholder structure slows mechanization | -0.5% | Small plots dominate Cap Bon, Nabeul, Bizerte, and other regions | Medium term (2–4 years) |
| Periodic export bans to curb local food inflation | -0.4% | National policy affecting all export corridors | Short term (≤2 years) |
| Source: Mordor Intelligence | |||
High post-harvest loss due to limited cold-chain nodes
Only 17 pre-cooling facilities cover the entire country, leaving inland growers without access to rapid temperature reduction. Tomatoes lose 10 to 15% of volume and stone fruits lose 8 to 12% before they reach ports. The World Bank has allocated USD 45 million to build hubs in Kairouan and Gabes, with completion slated for 2027. Until those hubs open, exports remain exposed to downgrades that depress farm-gate prices[4]Source: World Bank, “Tunisia Overview,” worldbank.org .
Recurrent drought and rising groundwater salinity
Dam reserves fell to 23% of capacity in 2024 while groundwater extraction rose to 119% of sustainable recharge. Salinity levels above 3,000 mg/L can reduce tomato yields by 30% and trigger blossom-end rot in peppers. Climate models project another 10–15% drop in rainfall by 2030, which will likely prompt growers to shift toward salt-tolerant crops. The widespread adoption of solar pumps enables unmetered withdrawals, erasing the water savings gained from drip irrigation[5]Source: Agence Française de Développement, “Tunisia,” afd.fr.
*Our forecasts treat driver/restraint impacts as directional, not additive. The impact forecasts reflect baseline growth, mix effects, and variable interactions.
Geography Analysis
Cap Bon remained the largest consumer hub, accounting for the majority of Tunisia's fruit and vegetable consumption in 2025, a lead built on 144,264 hectares of irrigated land dedicated to tomatoes, citrus, and potatoes, situated close to the ports of Rades and La Goulette. Land fragmentation, with 75% of farms under 5 hectares, and coastal aquifer salinity exceeding 3,000 mg/L, is projected to slow expansion through 2031. At the opposite end of the spectrum, the Southern Oases of Tozeur, Kebili, and Gabes held a minority share but are forecast to grow at the fastest CAGR from 2026 to 2031, powered by geothermal greenhouses that cut winter heating costs by 70% and by an International Finance Corporation loan that doubled date-processing capacity. This growth faces headwinds from groundwater extraction exceeding sustainable recharge and from 2,358 solar pumps enabling unmetered withdrawals.
The Sahel region, encompassing Sousse, Monastir, and Mahdia, accounted for a significant share of 2025 consumption and is tracking a substantial rate of expansion as growers use olive-oil pomace as organic fertilizer and diversify into pomegranates and stone fruits that thrive in calcareous soils. Cooperative investment in optical sorters and water-recycling lines cut early-season potato rejection rates from 18% to 9% and improved utilization of the 20,000 metric tons of duty-free European Union quota. The North-West Beja, Jendouba, and Kef held a prominent share and are growing at a significant rate, anchored by rain-fed rotations of cowpea and broad bean that rebuild soil nitrogen, yet suffer from shallow aquifers and recurrent drought. During the 2022 Ramadan export ban, North-West stocks of potatoes and onions were redirected to Tunis wholesale markets, helping curb vegetable inflation and underscoring the region’s buffer role.
Cap Bon processors aim to maintain their share through land consolidation pilots and mechanization, while state-funded pre-cooling units for Maltese oranges will support premium exports to France. Sahel cooperatives plan to scale up pomegranate acreage and exploit mid-season price gaps between Cap Bon and Southern Oases harvests, aided by new cold-storage hubs slated for Kairouan and Gabes under a World Bank loan that is set to conclude in 2027. The European Bank for Reconstruction and Development’s USD 68 million hydraulic overhaul is set to widen controlled-environment acreage in the Southern Oases and anchor off-season tomato flows to European winter markets. Collectively, these regional initiatives will diversify export routes, ease domestic supply swings, and lift Tunisia's fruit and vegetable commodity earnings through 2031.
Regulatory Landscape
Tunisia's fruit and vegetable value chain is primarily overseen by the Ministry of Agriculture, Hydraulic Resources and Maritime Fisheries, which sets production oversight, plant health, and phytosanitary controls. The Official Gazette framework is used to update control procedures periodically. Decree No. 716-2024 (dated December 30, 2024) defines modalities for official food-chain controls, reinforcing compliance documentation for regulated products and formalizing inspection practices that affect handling, packing, and processing sites.
For plant material and trade compliance, Tunisia uses an official catalogue approach for varieties, including a ministerial order dated February 23, 2026 that fixed the list of plant varieties registered in the official catalogue for the 2025 year. Import entry for plant products is tied to quarantine and phytosanitary rules under Law No. 92-72, including prohibitions on specified plant products and an IPPC-model phytosanitary certificate requirement, typically issued shortly before shipment. Export-facing quality differentiation also relies on official origin schemes such as Geographical Indications and Controlled Designations of Origin (for example, Djebba figs, Sbiba apples, and Gabes pomegranates), which supports traceability and positions for premium channels.
Value Chain Analysis
The Tunisia fruit and vegetable value chain begins with a fragmented farm base dominated by smallholders, supported by input suppliers (seed, fertilizers, crop protection) and irrigation equipment providers. Harvesting and aggregation then rely on collectors and wholesale markets. Post-harvest operations (sorting, packing, pre-cooling, cold storage, and refrigerated transport) are decisive for quality preservation, particularly for export-oriented citrus, early-season potatoes, tomatoes, and dates. Processing is a key value-add node, led by tomato canning/concentrate, citrus packing, and date processing, where larger integrated operators and cooperatives provide contract growing, quality protocols, and access to certifications.
Distribution moves through domestic wholesale hubs and export corridors that depend on packhouses, freight forwarders, and port logistics, with proximity to European markets supporting time-sensitive shipments. Cold-chain coverage remains a structural bottleneck, reflected in limited pre-cooling access and reported losses in perishables before reaching ports, and exporters also face coordination frictions around containers and port operations. Recent trade patterns show both reliance and diversification, with Libya reported as a major destination for Tunisian fruit exports during 2026 while exports were also reported across a broader set of international markets, reinforcing the role of standardization, packing capacity, and logistics performance in capturing higher-value demand.
Competitive Landscape
The competitive field is fragmented, yet a few prominent processors set the tone through deep vertical integration. The leading tomato processor operates multiple aseptic lines, controls demonstration farms, and extends pre-season financing to hundreds of contract growers, which stabilizes the raw material flow and maintains consistent quality. The foremost date exporter has leveraged multilateral loans to double throughput and add concentrate equipment that turns lower-grade fruit into high-margin sweeteners. Both front-runners have earned international food-safety certifications that open doors to supermarket chains in Europe and North America, allowing them to secure reliable off-take agreements even during volatile seasons.
Several significant mid-tier firms specialize in packing citrus, peppers, and potatoes, investing in pre-cooling units and optical sorters to reduce rejection rates under European phytosanitary regulations. These operators pool capital through cooperatives or private-equity partnerships to share cold-storage infrastructure and negotiate better freight rates. Some diversify into geothermal greenhouse projects in the southern oases, targeting the November-to-March window when European wholesale prices spike. Others pursue organic certification across thousands of hectares, aiming to capture price premiums in health food channels and hedge against commodity price swings.
Future expansion will rely on technology adoption, traceability, and resource stewardship rather than land consolidation. Processors are piloting proprietary hybrid varieties, real-time soil-moisture sensors, and blockchain-enabled tracking to meet retailer transparency demands. Cold-storage hubs, financed by international lenders, are slated to come online in 2027, which will lengthen the shelf life and enable sea freight to distant markets. At the same time, looming groundwater caps may favor operators who adopt drip irrigation and renewable-energy pumps, reshaping competitive advantages over the remainder of the decade.
Market Opportunities and Future Outlook
Policy-driven investment incentives and export-market compliance requirements are broadening the opportunity set for modern post-harvest infrastructure and water-efficient production systems. Tunisia's 2026-2030 agriculture strategy emphasizes food security, climate resilience, and export competitiveness, aligning with investment support mechanisms that include subsidies of up to 50% for high-tech agricultural projects (for example, smart irrigation, AI, and remote sensing). Private capital formation adds momentum, with APIA reporting TND 515.3 million in approved private agricultural investments in 2025, and sector programs such as ARDII-Tounes (multi-phase, aligned to the 2026-2030 plan) focused on technical innovation and water and wastewater engineering.
The most investable gaps sit in cold-chain nodes and export-grade packing capabilities, where improved pre-cooling, cold storage, and sorting reduce downgrades and help unlock longer-haul routes beyond nearby markets. The export channel is also showing tangible development signals, including reported increases in fruit export receipts during early 2026 and structured trade-promotion efforts (for example, CEPEX-led company missions) aimed at deeper routes into European wholesale platforms. On-farm, drought and salinity keep adoption focused on drip irrigation, flow metering, and controlled-environment cultivation where feasible, while processors and exporters continue to prioritize certification and traceability to meet European phytosanitary and retailer requirements.
Recent Industry Developments
- May 2026: Tunisia's Interprofessional Fruit Group reported fruit export revenues of 45.8 million dinars by mid-May 2026, up from 38.5 million dinars over the same period in 2025. The improvement points to stronger market access and better commercialization for higher-value fruit categories, increasing incentives for packing, grading, and cold-chain investments that protect export quality.
- March 2026: The Agricultural Investment Promotion Agency (APIA) announced approval of 638 private agricultural investments worth 111 million Tunisian dinars during the first quarter of 2026. The step-up in approved projects supports faster turnover of mechanization, irrigation upgrades, and on-farm infrastructure that improve consistency of supply for processors and exporters.
- December 2025: Tunisia's citrus industry outlined plans to ship 15,000 metric tons of Maltese oranges to France in the 2025/2026 season, backed by a ministry-led promotional drive in European trade fairs. Scaling shipments into a quality-sensitive European channel increases pressure on pre-cooling, packing discipline, and phytosanitary compliance across the citrus value chain.


Research Methodology Framework and Report Scope
Market Definition and Coverage
This market is defined as the value of fruits and vegetables supplied within Tunisia, covering locally produced and imported produce that is sold for domestic consumption and for export shipments, tracked in both value and volume terms.
Scope exclusions: Excludes processed fruit and vegetable products where processing is the primary value driver (such as canning, freezing, or drying) rather than fresh produce trade.
Segmentation Overview
- Vegetables
- Tomatoes
- Production Analysis
- Production Volume
- Area Harvested and Yield
- Consumption Analysis (Value and Volume)
- Trade Analysis (Value and Volume)
- Import Market Analysis
- Import Value and Volume
- Key Supplying Markets
- Export Market Analysis
- Export Value and Volume
- Key Destinations Markets
- Import Market Analysis
- Wholesale Price Trend Analysis and Forecast
- Seasonality Analysis
- Production Analysis
- Potatoes
- Production Analysis
- Production Volume
- Area Harvested and Yield
- Consumption Analysis (Value and Volume)
- Trade Analysis (Value and Volume)
- Import Market Analysis
- Import Value and Volume
- Key Supplying Markets
- Export Market Analysis
- Export Value and Volume
- Key Destinations Markets
- Import Market Analysis
- Wholesale Price Trend Analysis and Forecast
- Seasonality Analysis
- Production Analysis
- Leafy and Brassica Vegetables
- Production Analysis
- Production Volume
- Area Harvested and Yield
- Consumption Analysis (Value and Volume)
- Trade Analysis (Value and Volume)
- Import Market Analysis
- Import Value and Volume
- Key Supplying Markets
- Export Market Analysis
- Export Value and Volume
- Key Destinations Markets
- Import Market Analysis
- Wholesale Price Trend Analysis and Forecast
- Seasonality Analysis
- Production Analysis
- Legumes
- Production Analysis
- Production Volume
- Area Harvested and Yield
- Consumption Analysis (Value and Volume)
- Trade Analysis (Value and Volume)
- Import Market Analysis
- Import Value and Volume
- Key Supplying Markets
- Export Market Analysis
- Export Value and Volume
- Key Destinations Markets
- Import Market Analysis
- Wholesale Price Trend Analysis and Forecast
- Seasonality Analysis
- Production Analysis
- Tomatoes
- Fruits
- Citrus
- Production Analysis
- Production Volume
- Area Harvested and Yield
- Consumption Analysis (Value and Volume)
- Trade Analysis (Value and Volume)
- Import Market Analysis
- Import Value and Volume
- Key Supplying Markets
- Export Market Analysis
- Export Value and Volume
- Key Destinations Markets
- Import Market Analysis
- Wholesale Price Trend Analysis and Forecast
- Seasonality Analysis
- Production Analysis
- Grapes
- Production Analysis
- Production Volume
- Area Harvested and Yield
- Consumption Analysis (Value and Volume)
- Trade Analysis (Value and Volume)
- Import Market Analysis
- Import Value and Volume
- Key Supplying Markets
- Export Market Analysis
- Export Value and Volume
- Key Destinations Markets
- Import Market Analysis
- Wholesale Price Trend Analysis and Forecast
- Seasonality Analysis
- Production Analysis
- Stone Fruits
- Production Analysis
- Production Volume
- Area Harvested and Yield
- Consumption Analysis (Value and Volume)
- Trade Analysis (Value and Volume)
- Import Market Analysis
- Import Value and Volume
- Key Supplying Markets
- Export Market Analysis
- Export Value and Volume
- Key Destinations Markets
- Import Market Analysis
- Wholesale Price Trend Analysis and Forecast
- Seasonality Analysis
- Production Analysis
- Pomegranate
- Production Analysis
- Production Volume
- Area Harvested and Yield
- Consumption Analysis (Value and Volume)
- Trade Analysis (Value and Volume)
- Import Market Analysis
- Import Value and Volume
- Key Supplying Markets
- Export Market Analysis
- Export Value and Volume
- Key Destinations Markets
- Import Market Analysis
- Wholesale Price Trend Analysis and Forecast
- Seasonality Analysis
- Production Analysis
- Dates
- Production Analysis
- Production Volume
- Area Harvested and Yield
- Consumption Analysis (Value and Volume)
- Trade Analysis (Value and Volume)
- Import Market Analysis
- Import Value and Volume
- Key Supplying Markets
- Export Market Analysis
- Export Value and Volume
- Key Destinations Markets
- Import Market Analysis
- Wholesale Price Trend Analysis and Forecast
- Seasonality Analysis
- Production Analysis
- Citrus
Data Sources, Market Sizing, and Validation
Desk Research
Desk work started with public agriculture and trade statistics to understand supply, trade flows, and pricing direction before we modeled the market value. We relied on FAOSTAT for production series, UN Comtrade for import and export values and volumes, and World Bank macro indicators to frame demand conditions.
We also referenced Tunisia Ministry of Agriculture publications, national statistics releases, and customs or port updates where available, which helped anchor crop seasonality and shipment timing. To cross-check price assumptions, we used public wholesale price references and agriculture market bulletins, then added context from company filings, investor decks, and reputable news. A paid subscription for shipment-level import and export records and a company financials and intelligence database was used selectively to confirm trade mixes and revenue ranges. These examples are illustrative, and many other public and paid sources were reviewed to collect, validate, and clarify the data points used in the model.
Primary Interviews and Surveys
We speak with growers, wholesalers, exporters, retailers, processors, and agricultural officials in Tunisia. Their input clarifies production levels, price formation, trade flows, crop losses, channel margins, and demand, while helping address gaps in secondary data and check the final analysis.
Distribution of primary research fieldwork respondents
| Company type | Respondent position |
|---|---|
| Top tier: 28% | CXOs: 20% |
| Mid tier: 47% | Functional/Unit leaders: 30% |
| Smaller Players: 25% | Managers: 50% |
Market-Sizing & Forecasting
Sizing was built using a top-down logic where national production and trade data were used to reconstruct the available supply pool by major produce groups, and then converted into market value using observed price ranges. Since price can vary widely by season and by export grade, the model uses a blended pricing layer that reflects wholesale price trends, export unit values, and expected domestic market mixes.
To keep totals realistic, we corroborated results with selective bottom-up approximations, such as sampling exporter throughput and typical pricing, and then using channel checks on wholesale market turnover to adjust the implied consumption. Key inputs included production volumes by crop, import and export volumes and values, wholesale price movements, post-harvest loss and rejection rates, and shifts in export demand tied to certification and quality requirements. For forecasting, scenario analysis was used to reflect weather sensitivity, water constraints, and policy or logistics shocks, then the chosen scenario was aligned to expert expectations gathered in primary discussions. Where bottom-up signals were incomplete for smaller informal flows, gap-handling relied on conservative ranges and repeated checks against trade balances and price logic.
Data Validation & Update Cycle
Validation was handled through triangulation across production, trade, and pricing signals, and then reviewed for year-to-year jumps that did not match known harvest or export dynamics. Outliers were flagged, assumptions were revisited, and respondents were re-contacted when implied unit values or volume splits moved outside practical ranges.
Before sign-off, the model and its inputs go through a multi-step analyst review so calculation errors and inconsistent units are removed. The report is refreshed annually, and interim updates are made when a material event occurs, such as a sharp export restriction, a major drought season, or a step change in wholesale pricing. Right before delivery, a final pass is completed so clients receive the latest updated view based on the newest public releases and fresh field feedback.
Mordor Intelligence's Tunisian Fruit Vegetable Market Size Compared With Other Published Estimates
Published market sizes for Tunisia fruits and vegetables often do not match because the scope line, price basis, and the year used for conversion can differ across studies. Differences also show up when one estimate leans more on value-chain revenue, while another stays closer to production, trade, and realized selling prices.
Processed fruit and vegetable products, such as canned and frozen outputs, sit outside Mordor Intelligence's scope here, which is one reason some published figures come out higher when they blend fresh trade with processing revenues. Gaps also come from how export values are treated, since some sources keep export unit values as a proxy for all produce pricing, while others separate domestic wholesale pricing and export grade pricing. In addition, refresh cadence matters in this market because weather-driven swings and currency conversion timing can change the USD value even when volumes are steady.
Benchmark comparison
| Source | Market Size | Gaps in Research Methodology |
|---|---|---|
| Mordor Intelligence | USD 2.19 B (2025) | |
| Global Consultancy A | USD 2.57 B (2026) | Uses a broader value-chain lens that can blend fresh produce trade with distribution and retail value add, and it may apply a higher blended price level when converting volumes to USD. |
| Regional Consultancy B | USD 0.48 B (2025) | Tracks only fruit and vegetable processing activity, which excludes most fresh produce volumes and therefore reports a much smaller value than a fresh-market view. |
The table shows that the spread is mainly explained by what is counted, and at which price point the counting is done. When the model stays traceable to production, imports and exports, and realistic price layers by channel, the resulting market value becomes easier to replicate and to pressure-test year over year.


Key Questions Answered in the Report
What is the current size of the Tunisia fruit and vegetable commodity market in 2026?
The market is valued at USD 2.33 billion in 2026 and is forecast to grow to USD 3.13 billion by 2031.
Which crop contributes the most to processing revenue?
Tomato processing leads, accounting for 24% of production and supplying 26 canneries that produce double-concentrated paste.
How significant are date exports for Tunisia?
Dates generated TND 581.8 million (USD 194 million) in export receipts during the first five months of the 2024/2025 campaign and hold 35% of the global Deglet Nour market share.
Why is Libya important for exporters?
Libya purchases 51% of Tunisian fruit and vegetable shipments, providing a nearby outlet that requires minimal cold-chain infrastructure.
How is Tunisia improving early-season potato exports to Europe?
Three centralized packing stations with optical sorters and water recycling now standardize quality for the 20,000 metric tons duty-free European Union quota.
Page last updated on:


 Your data is secure and never sold or shared.


