
Tuna And Algae Omega-3 Ingredients Market Size and Share
Market Overview
| Study Period | 2021 - 2031 |
|---|---|
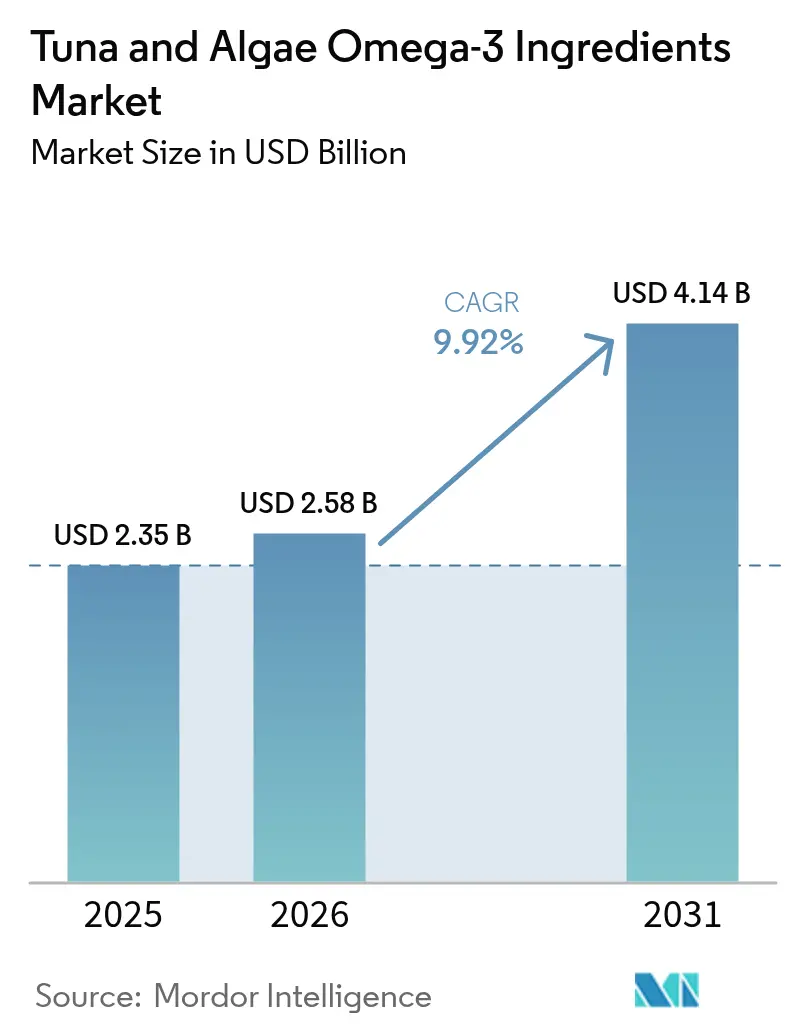
| Market Size (2026) | USD 2.58 Billion |
| Market Size (2031) | USD 4.14 Billion |
| Growth Rate (2026 - 2031) | 9.92 % |
| Fastest Growing Market | North America |
| Largest Market | Asia Pacific |
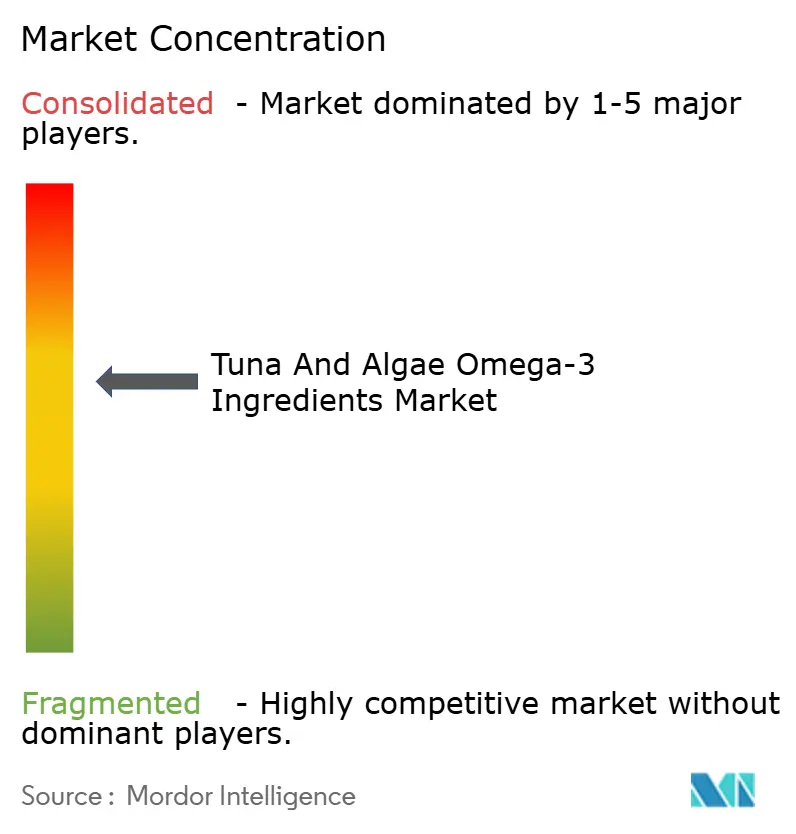
| Market Concentration | Medium |
Major Players *Disclaimer: Major Players sorted in no particular order Image © Mordor Intelligence. Reuse requires attribution under CC BY 4.0. | |
Tuna And Algae Omega-3 Ingredients Market Analysis by Mordor Intelligence
The tuna and algae omega-3 ingredient market size is expected to grow from USD 2.35 billion in 2025 to USD 2.58 billion in 2026 and is forecast to reach USD 4.14 billion by 2031 at 9.92% CAGR over 2026-2031. Multiple forces underpin this growth, including infant-formula mandates in China and the European Union, brisk uptake of prescription EPA and DHA therapies, and renewed scrutiny of wild-catch sustainability that is steering buyers toward vertically integrated, traceable supply chains. Ingredient suppliers are shifting capital toward pharmaceutical-grade refining, supercritical CO₂ extraction, and large-scale heterotrophic fermentation in a bid to secure long-term contracts with food, supplement, and drug formulators. Raw-material economics are also pivoting, as El Niño-linked yield volatility lifts the risk premium on tuna oil while ongoing process optimizations narrow the cost gap for cultivated algae sources. Competitive intensity is therefore migrating from simple volume throughput to differentiation on purity, oxidative stability, and documented environmental footprint.
Key Report Takeaways
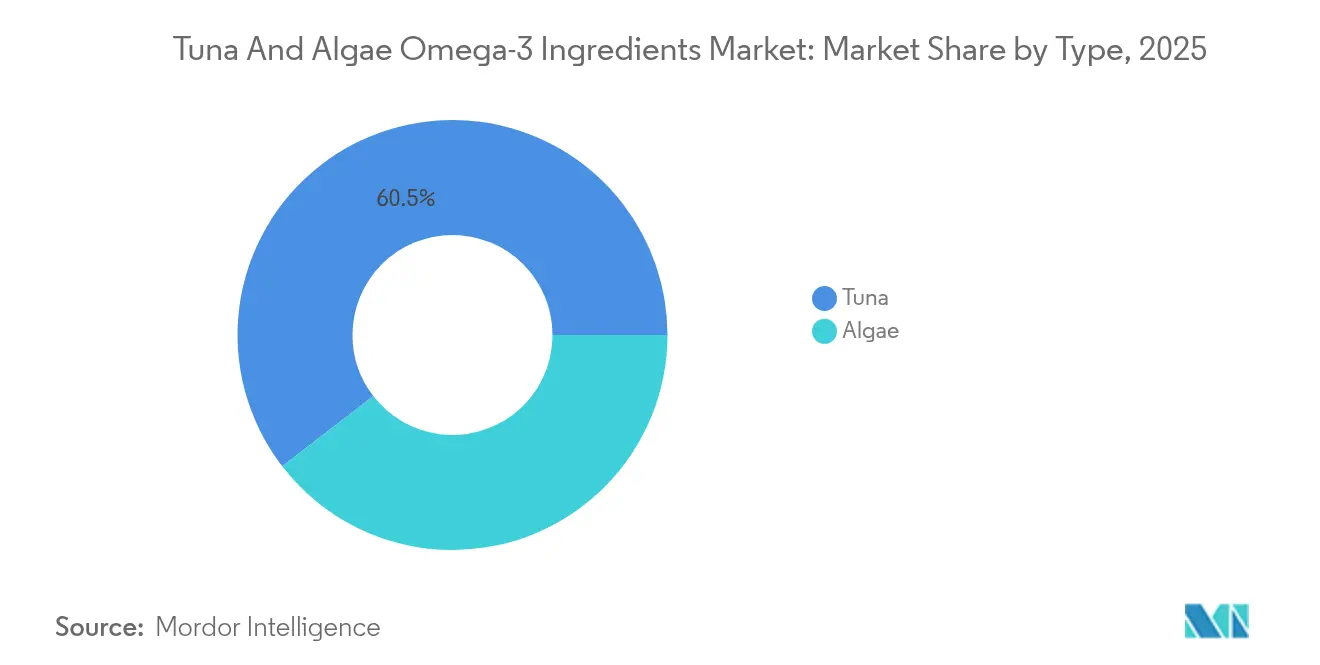
- By type, tuna omega-3 commanded 60.45% of the tuna and algae omega-3 ingredient market share in 2025, whereas algae omega-3 is projected to expand at an 11.12% CAGR through 2031.
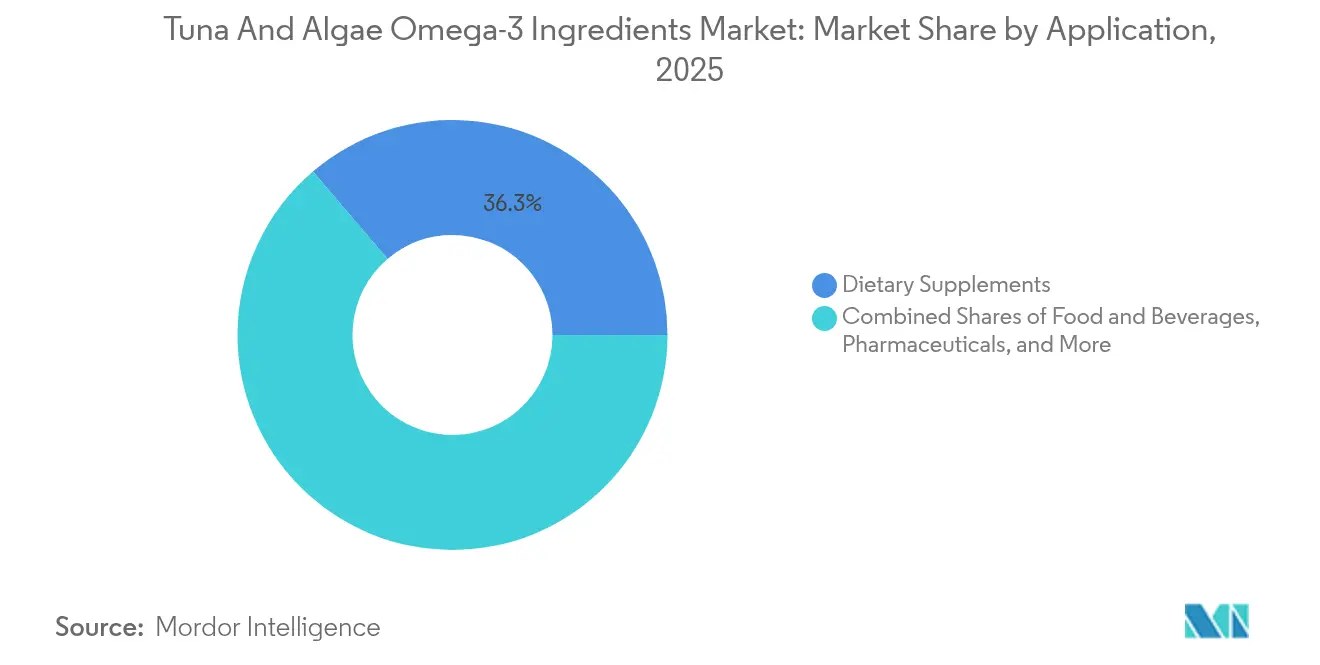
- By application, dietary supplements captured a 36.25% share of the tuna and algae omega-3 ingredient market size in 2025, but pharmaceutical use is advancing fastest at a 10.44% CAGR to 2031.
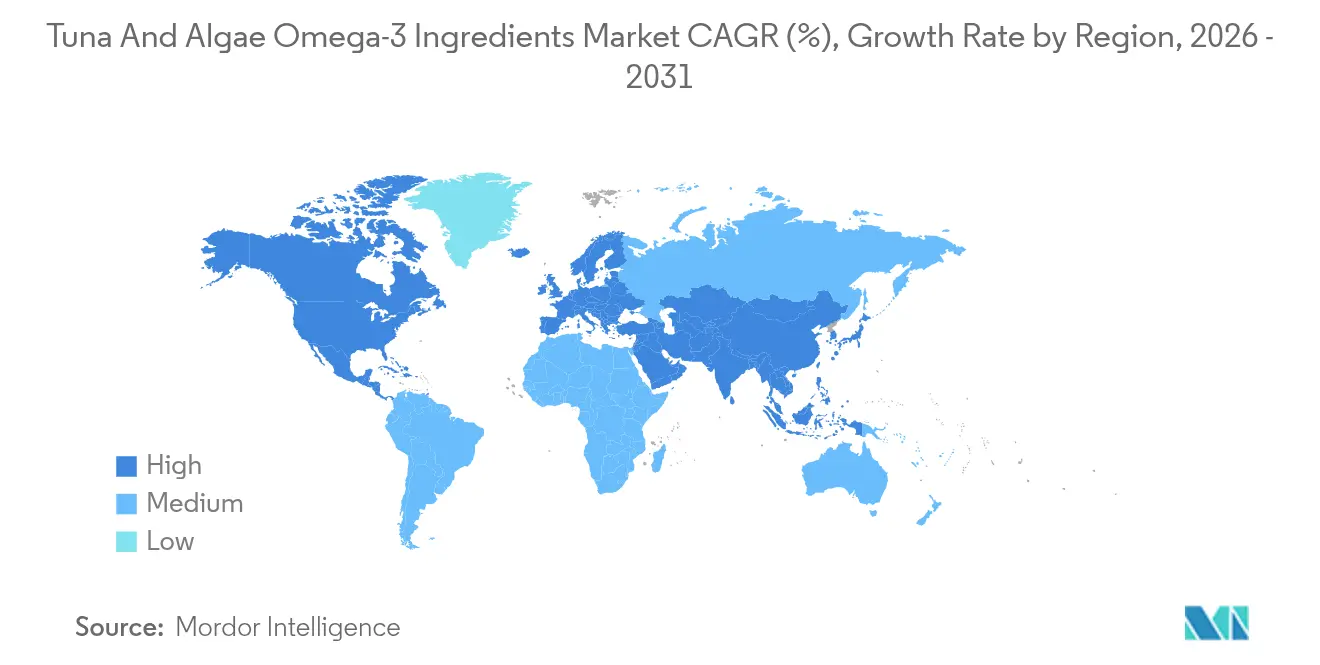
- By geography, Europe led with 31.15% of the 2025 value, while Asia-Pacific is poised for the strongest growth, charting a 12.2% CAGR to 2031.
Note: Market size and forecast figures in this report are generated using Mordor Intelligence’s proprietary estimation framework, updated with the latest available data and insights as of 2026.
Market Trends and Insights
Drivers Impact Analysis of Tuna And Algae Omega-3 Ingredients Market*
| Drivers | (~)% Impact on CAGR Forecasts | Geographic Relevance | Impact Timeline |
|---|---|---|---|
| Rising consumer awareness of omega-3 health benefits for cardiovascular, brain, and anti-inflammatory effects | +1.8% | Global, with concentrated uptake in North America and Europe | Medium term (2-4 years) |
| Surge in use for infant formula fortification, leveraging DHA benefits without off-odors | +2.3% | Asia-Pacific core (China, India), spill-over to Europe and Latin America | Short term (≤ 2 years) |
| Functional foods and beverage fortification expansion | +1.5% | North America, Europe, emerging in Asia-Pacific urban centers | Medium term (2-4 years) |
| Demand for sustainable, plant-based alternatives to fish oil amid overfishing and environmental concerns | +2.1% | Europe, North America, Australia; early adoption in coastal Asia-Pacific | Long term (≥ 4 years) |
| Integration into animal nutrition and feed for healthier animal products | +1.0% | Global aquaculture hubs (Norway, Chile, China), poultry in EU and US | Long term (≥ 4 years) |
| Technological advancements in algae cultivation, extraction, and bioreactor efficiency | +1.4% | Concentrated in Netherlands, US, Brazil; scaling in Asia-Pacific | Medium term (2-4 years) |
| Source: Mordor Intelligence | |||
Rising Consumer Awareness of Omega-3 Health Benefits for Cardiovascular, Brain, and Anti-Inflammatory Effects
Cardiovascular disease remains the leading global cause of mortality. Clinical evidence highlights EPA and DHA for lowering triglyceride levels and reducing major cardiac events, elevating omega-3s to therapeutic targets. The REDUCE-IT trial, with over 8,000 high-risk participants, showed high-dose icosapent ethyl (a purified EPA ethyl ester) reduced cardiovascular risks by 25% versus placebo. This led the U.S. Food and Drug Administration to approve its adjunctive use with statins[1]. Following this, supplement brands emphasized EPA-to-DHA ratios and third-party testing for oxidative markers like peroxide and anisidine values to differentiate premium products. Cognitive health claims are also rising, with studies linking over 500 milligrams of daily DHA intake to better executive function and memory, though the European Food Safety Authority notes challenges in proving causation outside infant and maternal contexts. Specialized pro-resolving mediators from EPA and DHA are under study for anti-inflammatory effects in chronic conditions like rheumatoid arthritis and inflammatory bowel disease, with Phase II trials showing modest but significant reductions in C-reactive protein and interleukin-6 levels. Regulatory bodies also play a role.
Surge in Use for Infant Formula Fortification, Leveraging DHA Benefits Without Off-Odors
China's GB 14880 standard requires all domestically sold infant formulas to meet a minimum DHA content, while the European Union's Delegated Regulation (EU) 2016/127 mandates DHA levels between 20 to 50 milligrams per 100 kilocalories. Algae-derived DHA, obtained from Schizochytrium and Crypthecodinium oils, has replaced fish oil in infant formulas. These algae oils offer high DHA concentrations without the fishy odor or allergenic risks that often discourage caregivers. In January 2025, the European Food Safety Authority (EFSA) approved Schizochytrium sp. oil for use in infant and follow-on formulas, citing safety data from post-market surveillance and toxicological studies in neonatal animal models[2]. The U.S. Food and Drug Administration (FDA) has issued several Generally Recognized As Safe (GRAS) notices for algal DHA oils, including GRN 1236 for Schizochytrium sp. oil, allowing levels up to 60 milligrams per 100 kilocalories, consistent with Codex Alimentarius's upper limit. Leading formula manufacturers such as Abbott, Nestlé, and Danone have reformulated flagship products to include algae-derived DHA. They market the ingredient as vegetarian-friendly and sustainably sourced, appealing to millennial and Gen-Z parents who value plant-based nutrition. Clinical trials continue to examine dose-response relationships.
Functional Foods and Beverage Fortification Expansion
Omega-3 fortification is moving from niche health foods to mainstream categories such as dairy, bakery, plant-based beverages, and sports nutrition. This trend is fueled by clean-label preferences and the goal of providing functional benefits without requiring consumers to follow supplement routines. Dairy products like milk, yogurt, and cheese fortified with algae-derived DHA are being introduced across Europe and North America. Brands are utilizing microencapsulation technologies to eliminate residual marine flavors and protect the oil from oxidation during storage. However, advancements in spray-dried powder forms and lipid encapsulation have enabled bread and snack-bar manufacturers to retain at least 80 percent of the initial DHA content during the baking process, according to USDA standards. In sports nutrition, brands are developing pre- and post-workout beverages with EPA and DHA to aid muscle recovery and reduce exercise-induced inflammation. Research suggests that omega-3 supplementation may alleviate delayed-onset muscle soreness and improve range of motion after eccentric exercise. Regulatory frameworks also play a role. The European Union's nutrition and health claims regulation allows claims that DHA supports normal brain function and vision with a daily intake of 250 milligrams. Similarly, the U.S. FDA permits a qualified health claim linking omega-3 fatty acids to a reduced risk of coronary heart disease.
Demand for Sustainable, Plant-Based Alternatives to Fish Oil Amid Overfishing and Environmental Concerns
Overfishing of forage species such as anchoveta, menhaden, and sardines—primary sources of fish oil for omega-3 extraction—has resulted in the implementation of Marine Stewardship Council certifications and catch quotas. However, climate-induced changes in stock distributions are making sustainable sourcing more challenging. In 2024, the Inter-American Tropical Tuna Commission reported a nearly 20 percent reduction in yellowfin tuna catches in the Eastern Pacific compared to the previous five-year average[3]. This decrease was attributed to warmer sea-surface temperatures, which shifted tuna aggregations eastward and reduced fishing efficiency. Regulatory frameworks are evolving to enhance sustainable sourcing, with the European Union's Common Fisheries Policy establishing total allowable catches. Additionally, the United Nations' Sustainable Development Goal 14 focuses on conserving and sustainably using oceans and marine resources. Both measures are driving the transition to land-based omega-3 production. Certification organizations like the Marine Stewardship Council and Friend of the Sea provide chain-of-custody assurance. Furthermore, ingredient buyers are increasingly demanding third-party verification to align with corporate sustainability goals and address growing investor concerns under environmental, social, and governance criteria.
Restraints Impact Analysis of Tuna And Algae Omega-3 Ingredients Market*
| Restraints | (~)% Impact on CAGR Forecasts | Geographic Relevance | Impact Timeline |
|---|---|---|---|
| Regulatory complexities, such as varying GRAS notices, novel food approvals | -1.2% | Global, with acute friction in EU, China, and emerging markets | Medium term (2-4 years) |
| Climate shifts and stricter sustainability audits disrupting tuna supply chains | -0.9% | Pacific and Atlantic tuna fisheries; ripple effects in North America, Europe, Asia-Pacific | Short term (≤ 2 years) |
| High cultivation and extraction costs for algae | -1.5% | Global, most pronounced in regions without scale economies (Latin America, Africa, smaller Asia-Pacific markets) | Long term (≥ 4 years) |
| Consumer skepticism over efficacy, stability, and limited research on algae omega-3 | -0.7% | North America, Europe; emerging in Asia-Pacific as awareness grows | Medium term (2-4 years) |
| Source: Mordor Intelligence | |||
Climate Shifts and Stricter Sustainability Audits Disrupting Tuna Supply Chains
Ocean warming and acidification are altering tuna migration patterns, reducing catch predictability and increasing the operational costs of fishing fleets that must travel farther to locate schools. The Inter-American Tropical Tuna Commission documented in 2024 that El Niño conditions shifted yellowfin tuna eastward, lowering catch rates in traditional fishing zones off Ecuador and Peru by approximately 20 percent and forcing vessels to extend trip durations, which raised fuel costs and reduced profitability. Some tuna fisheries have lost or are at risk of losing MSC certification due to overfishing or bycatch concerns, which excludes their oil from supply chains serving eco-conscious brands and retailers. Regulatory frameworks such as the European Union's Illegal, Unreported and Unregulated Fishing Regulation require catch certificates and port-state inspections, and non-compliance can result in import bans that disrupt ingredient availability. These supply-chain frictions elevate the cost and volatility of tuna-derived omega-3, accelerating the shift toward algae sources that offer stable, year-round production independent of climate variability and fishery politics.
High Cultivation and Extraction Costs for Algae
Algae omega-3 production incurs capital-intensive bioreactor construction, energy-intensive cultivation (lighting, mixing, temperature control), and sophisticated downstream processing, resulting in costs estimated at USD 5 to 15 per kilogram depending on scale and technology, compared to USD 2 to 5 per kilogram for refined tuna oil. Economies of scale are critical, as doubling production capacity can reduce per-unit costs by 40 to 60 percent through improved asset utilization and bulk purchasing of nutrients and consumables, yet many algae startups struggle to secure the capital required to reach the minimum efficient scale. Regulatory compliance adds further expense, with Good Manufacturing Practice certification, third-party testing for contaminants, and traceability systems collectively costing tens of thousands of dollars annually, which disproportionately burdens smaller operators. Until algae production costs converge with those of fish oil, price-sensitive applications such as animal feed and economy-tier dietary supplements will remain dominated by marine sources, limiting the addressable market for algae DHA to premium segments willing to pay a sustainability premium.
*Our forecasts treat driver/restraint impacts as directional, not additive. The impact forecasts reflect baseline growth, mix effects, and variable interactions.
Tuna And Algae Omega-3 Ingredients Market Segment Analysis
By Type:
Tuna Omega-3 Commands Majority Share on Established Supply Chains and Pharmaceutical-Grade RefiningTuna-derived omega-3 ingredients held 60.45% of the market value in 2025, reflecting decades of infrastructure investment in fishing fleets, refining facilities, and regulatory approvals that have made tuna oil the default source for dietary supplements, pharmaceutical formulations, and fortified foods. Tuna oil offers a balanced EPA-to-DHA ratio that aligns with cardiovascular health claims, and molecular distillation processes can concentrate omega-3 content to 90 percent or higher, meeting the purity thresholds required for prescription drugs such as icosapent ethyl and omega-3-acid ethyl esters approved by the U.S. Food and Drug Administration.
Algae-derived omega-3 ingredients are forecast to expand at 11.12% CAGR from 2026 to 2031, outpacing the overall market as infant-formula manufacturers and pharmaceutical developers prioritize allergen-free, vegetarian-compliant sources that avoid the supply-chain risks associated with wild fisheries. In January 2025, the European Food Safety Authority extended its positive opinion on Schizochytrium sp. oil to cover infant and follow-on formula, and China's GB 14880 standard mandates DHA in all infant formulas, creating a structural demand floor for algae DHA that is insulated from consumer discretion.

By Application:
Dietary Supplements lead the Market ShareIn 2025, dietary supplements contributed 36.25% of total revenue, supported by established consumer habits in the U.S. and Europe. The Council for Responsible Nutrition states that 25% of U.S. adults take omega-3 pills or gummies weekly. While private-label brands are reducing unit margins, premium SKUs are leveraging third-party oxidation certificates to justify higher prices. Algae-based vegetarian formats are now prominently displayed in leading drugstore chains, reflecting a stronger presence in the mainstream market. However, as the category matures, overall volume growth has slowed to low single digits.
In 2025, pharmaceutical applications are expected to grow over the forecast period, paving the way for a projected 10.44% CAGR through 2031. Generic versions of EPA ethyl esters are increasing omega-3 accessibility but at lower price points, maintaining volume stability. Ongoing Phase II/III trials are evaluating omega-3's potential for treating non-alcoholic steatohepatitis and cognitive decline; favorable outcomes could significantly boost demand for active pharmaceutical ingredients (APIs) beyond current projections. API buyers require a purity of ≥96%, along with residual-solvent testing and validated GMP documentation. These strict requirements create significant barriers for new entrants and strengthen the pricing power of established players. Algae-derived DHA is progressing in pediatric drug pipelines, particularly where fish allergens are a concern, indicating potential diversification in the regulated prescription market.
Geography Analysis
Europe Tuna and Algae Omega-3 Ingredients Market
Europe led with 31.15% of the 2025 global value, underpinned by stringent novel-food approvals that confer consumer confidence and by the wide uptake of MSC-certified ingredients. Germany and France dominate prescription volumes, aided by reimbursement under statutory insurance, whereas Scandinavia pioneers functional-food rollouts such as DHA-fortified dairy and bakery lines. The region’s Green Deal accelerates corporate commitments to cut supply-chain carbon emissions, a tailwind for algae DHA adoption. Retailer coalitions in the United Kingdom and the Netherlands now require verifiable sustainability labels, cementing long-term demand certainty for certified supply.
APAC Tuna and Algae Omega-3 Ingredients Market
Asia-Pacific is set to deliver the fastest expansion at 12.2% CAGR. China’s infant-formula rules mandate DHA inclusion, locking in fermentation capacity utilization, while Japan’s Foods with Function Claims system paves the way for on-pack omega-3 messaging across beverages and snacks. India’s middle-class consumers are adopting supplements as chronic disease awareness rises, and FSSAI fortification guidelines integrate DHA into edible-oil and dairy standards. Concurrent aquaculture growth fuels incremental algae-oil demand as feed formulators scramble to reduce fish-oil inclusion ratios and secure export-market eco-labels.
North America Tuna and Algae Omega-3 Ingredients Market
North America remains a mature but sizeable hub. The U.S. qualified health claim for omega-3 and coronary heart disease, coupled with Medicare reimbursement for EPA ethyl ester therapies, keeps baseline demand resilient. Retail chains stock omega-3-enriched eggs, almond milk, and yogurts, normalizing DHA intake beyond pill form. Sustainability agendas are intensifying: by 2025, several leading grocers have pledged 100% certified seafood sourcing, indirectly pressuring tuna-oil suppliers to align with MSC or shift toward cultivated alternatives.
Regulatory Landscape
Regulation spans food, supplements, pharmaceuticals, and animal nutrition, with algae oils typically handled as novel foods or GRAS ingredients, and tuna oils additionally constrained by fisheries compliance and contaminant limits. In the European Union, DHA/EPA-rich oils from Schizochytrium sp. fall under the Novel Food Regulation framework (EU) 2015/2283, with product-specific conditions of use and labeling set via Commission implementing acts, while infant formula DHA inclusion is anchored by Delegated Regulation (EU) 2016/127. In the United States, algal DHA oils commonly enter via the FDA GRAS notification pathway under 21 CFR Part 170, and pharmaceutical-grade omega-3s must align with drug quality and GMP requirements when used as APIs.
Internationally, Codex Alimentarius work on specifications for microbial omega-3 oils is a key harmonization lever for trade, since quality parameters for oxidation, contaminants, and composition can vary by jurisdiction. In February 2026, the Codex Committee on Fats and Oils discussed proposals (including GOED input) toward a standard for microbial omega-3 oils. This direction supports clearer cross-border benchmarks for microalgae-derived DHA/EPA and reduces friction for exporters serving infant formula, supplements, and specialized nutrition channels.
Value Chain Analysis
The value chain starts with two distinct feedstock routes: (i) tuna by-product streams (trimmings, heads, frames) from tuna processing hubs that are rendered to crude oil, and (ii) microalgae cultivation, largely via heterotrophic fermentation or controlled bioreactors that rely on nutrient inputs such as refined sugars. Midstream processing includes degumming, neutralization, winterization, and high-end concentration steps such as molecular distillation to achieve high-purity EPA/DHA concentrates required for premium supplements and regulated pharmaceutical uses. Algae oils also require downstream purification and deodorization to deliver low-odor, oxidation-stable ingredients suitable for infant nutrition.
Downstream, omega-3 ingredients move through B2B distributors and direct supply contracts to infant-formula manufacturers, dietary supplement brands, functional-food producers, pharmaceutical companies, and animal nutrition formulators. Bottlenecks differ by route, since tuna oils are exposed to wild-catch variability and tightening sustainability scrutiny (including chain-of-custody programs such as MSC and Friend of the Sea), while algae omega-3 supply is constrained by capital intensity, regulatory market-entry steps, and the cost of cultivation and refining. As a result, large integrated ingredient houses and specialized refiners compete on traceability documentation, oxidative stability testing, and consistent lot-to-lot quality to secure multi-year offtake agreements.
Competitive Landscape
Five global majors—Archer Daniels Midland, DSM-Firmenich, BASF, Corbion, and Aker BioMarine—control an estimated 40–50% of the tuna and algae omega-3 ingredient market. Vertical integration delivers margin insulation via control of cultivation, extraction, and downstream concentration steps. Recent moves center on capacity expansion: Corbion’s 30% Brazil fermentation boost, DSM-Firmenich’s scale-up of life’sOMEGA in the United States, and BASF’s dairy-co-op joint venture to embed algae DHA in European yogurts. M&A remains active; Lonza’s 2024 purchase of Capsugel’s algae assets signals pharmaceutical forays by contract manufacturers formerly focused on capsules.
Smaller challengers carve niches in vegan supplements, aquaculture feed, and upcycled-substrate fermentation. MiAlgae leverages whisky-distillery co-products as feedstock, lowering unit costs and resonating with circular-economy narratives. Technology differentiation is sharpening: AI-controlled photobioreactors, blockchain traceability, and patented phospholipid-bound EPA/DHA complexes each offer competitive moats. However, rising compliance costs and widening ESG disclosures may force sub-scale players into consolidation or strategic alliances with larger ingredient houses.
Retail and CPG buyers now rank supply-chain transparency alongside price and sensory profile. Suppliers responding with life-cycle-assessment publication, Friend-of-the-Sea certification, and MSC chain-of-custody evidence secure multi-year contracts despite modest price premiums. Overall, bargaining power is tilting toward buyers capable of steering suppliers toward verifiable ESG metrics.
Tuna And Algae Omega-3 Ingredients Industry Leaders
-
Archer Daniels Midland Company
-
Polaris S.A.
-
Clover Corporation Limited
-
Corbion N.V.
-
DSM-Firmenich
- *Disclaimer: Major Players sorted in no particular order
Tuna And Algae Omega-3 Ingredients Market Companies Covered in this Report
- Archer Daniels Midland (ADM)
- Koninklijke DSM-Firmenich
- BASF SE
- Corbion NV
- Lonza Group
- Bioprocess Algae LLC
- Neptune Wellness Solutions
- Polaris SA
- Source-Omega LLC
- AlgaeCytes
- GC Rieber VivoMega
- Golden Omega SA
- Epax Norway AS
- Aker BioMarine
- TASA
- KD Pharma Group
- MiAlgae
- Cellana Inc.
- Solutex GC
- Nippon Suisan Kaisha, Ltd. (Nissui)
Read Analysis of Tuna And Algae Omega-3 Ingredients Companies
Market Opportunities and Future Outlook
Infant formula and other regulated nutrition channels create durable demand for algae-derived DHA, supported by compositional requirements and safety review frameworks. China keeps mandatory DHA inclusion via GB 14880, and in Europe, the infant formula DHA mandate under Delegated Regulation (EU) 2016/127 reinforces baseline need for DHA sources that avoid fish allergens and off-odors. With EFSA issuing opinions covering Schizochytrium sp. oils for infant and follow-on formula use (including the January 2025 approval referenced in the report context), suppliers that pair regulatory dossiers with validated oxidation-control systems are better positioned to expand into premium pediatric and medical-nutrition formulations.
Supply-chain resilience remains a key whitespace that favors algae omega-3 as climate variability tightens marine-oil economics. In April 2026, industry reporting cited Peru setting a first-season anchovy quota of 1.91 million metric tons, down 36% year over year, illustrating how marine-lipid availability can shift quickly due to environmental and management decisions. This is reinforcing procurement strategies centered on dual-sourcing and marine-algae blends across supplements and animal nutrition, while ongoing Codex discussions in early 2026 on microbial omega-3 oil standards provide a route toward more uniform trade specifications for algae oils used by multinational brand formulators.
Recent Industry Developments in Tuna And Algae Omega-3 Ingredients Market
- April 2026: dsm-firmenich launched Veramaris O3 Max Pure, positioned as a fish oil replacement ingredient, at Petfood Forum 2026. The launch supports algae-based omega-3 penetration in pet food by offering an alternative to marine oils as buyers tighten specifications on sustainability and supply continuity.
- March 2025: dsm-firmenich won a UK patent infringement lawsuit involving Mara Renewables Corporation and Algal Omega-3 Ltd related to high-purity algal DHA oil technology. The decision reinforces IP protection around algal oil processing know-how, raising the competitive bar for new entrants and influencing partnership and licensing dynamics.
- July 2024: dsm-firmenich announced the sale of its MEG-3 fish oil business to KD Pharma Group SA, including production facilities in Piura, Peru and Mulgrave, Canada. The divestment changes capacity ownership in fish-oil-based omega-3 ingredients and supports dsm-firmenich portfolio emphasis toward algal omega-3 platforms.
Tuna And Algae Omega-3 Ingredients Market Report Scope and Research Methodology
Market Definition and Coverage
This market is defined as the sales value of omega-3 ingredients derived from tuna and from algae, supplied as raw materials for use in finished products like supplements, fortified foods, pharma, and animal nutrition.
Scope exclusions: We exclude retail sales of finished omega-3 products and focus only on ingredient level revenues.
Segments Covered in This Report
- Type
- Tuna Omega-3 Ingredient
- Algae Omega-3 Ingredient
- Application
- Food and Beverage
- Infant Formula
- Fortified Food and Beverages
- Dietary Supplements
- Pharmaceutical
- Animal Nutrition
- Food and Beverage
- Geography
- North America
- United States
- Canada
- Mexico
- Rest of North America
- Europe
- Germany
- United Kingdom
- Italy
- France
- Spain
- Netherlands
- Poland
- Belgium
- Sweden
- Rest of Europe
- Asia-Pacific
- China
- India
- Japan
- Australia
- Indonesia
- South Korea
- Thailand
- Singapore
- Rest of Asia-Pacific
- South America
- Brazil
- Argentina
- Colombia
- Chile
- Peru
- Rest of South America
- Middle East and Africa
- South Africa
- Saudi Arabia
- United Arab Emirates
- Nigeria
- Egypt
- Morocco
- Turkey
- Rest of Middle East and Africa
- North America
Data Sources, Market Sizing, and Validation
Desk Research
Desk work starts with mapping the ingredient value chain and the main demand pools, and then we align definitions across regions so the same ingredient type is not counted twice. Public sources are used to set realistic guardrails for supply and demand, such as FAO fishery and aquaculture statistics, NOAA fisheries updates, and national trade statistics portals that publish HS-code import and export data for fish oils and related materials.
We also reference sources such as the European Commission and EFSA publications, the US FDA food and supplement guidance pages, and peer reviewed nutrition and lipid science journals for data points on allowable use, typical dosage ranges, and stability and purity expectations. Company annual reports, investor presentations, and press releases are used to sanity-check capacity additions and product focus, and we selectively use paid subscriptions for company financials, patent databases, and shipment level import and export checks to reduce blind spots. These examples are illustrative only, and many other sources were reviewed for data collection, validation, and clarification.
Primary Interviews and Surveys
Primary work is used to pressure test demand drivers and pricing logic across applications, and then to confirm how quickly algae based supply is scaling compared with tuna derived supply. We speak with ingredient suppliers, distributors, contract manufacturers, and downstream buyers across APAC, EMEA, and the Americas, and we revisit assumptions when responses indicate shifts in regulatory acceptance, formulation direction, or large price moves.
Distribution of primary research fieldwork respondents
| Company type | Respondent position | Region |
|---|---|---|
| Top tier: 39% | CXOs: 13% | APAC: 41% |
| Mid tier: 47% | Functional/Unit leaders: 36% | EMEA: 37% |
| Smaller Players: 14% | Managers: 51% | Americas: 22% |
Market-Sizing & Forecasting
Sizing is built by a top-down approach where category demand is reconstructed from application level consumption signals, and then filtered through realistic inclusion rules for tuna and algae omega-3 ingredients. For example, infant formula fortification norms, supplement penetration, and animal nutrition inclusion rates are translated into ingredient demand, which is then valued using region specific price bands.
To keep the model grounded, we track a set of inputs that buyers and suppliers routinely reference, such as EPA and DHA concentration ranges used in formulations, blend ratios between tuna and algae sources, regional mix by end use (supplements versus fortified food), import dependency in key consuming markets, and observed price movement tied to crude fish oil and refined concentrate availability. Forecasts are generated using scenario analysis supported by simple multivariate relationships, with application growth, source substitution trends toward algae, and expected pricing progression as capacity scales forming the main drivers.
After that, totals are checked using selective bottom-up approximations like sampled supplier revenue bands, channel checks with distributors, and ASP times volume sanity checks for a few large application pools. When a bottom-up view is incomplete in a country, we bridge gaps using trade flows and consumption indicators, and then we validate the final number with experts before locking assumptions.
Data Validation & Update Cycle
Outputs are validated through triangulation across independent signals, and unusual jumps are flagged for rework before the model is finalized. We compare implied per capita intake, application level ingredient intensity, and trade based availability against the modeled demand, and then we recheck countries where the implied numbers look out of line.
A second analyst review is completed for key assumptions like pricing, inclusion rules, and regional splits, followed by a final coherence check across all tables and narratives. Reports are refreshed annually, and interim updates are triggered when material events occur, such as a major capacity addition, regulatory change, or a sustained shift in ingredient pricing. Before delivery, a fresh pass is done so clients receive the most current view available.
Mordor Intelligence's Tuna and Algae Omega 3 Ingredient Market Size Measured Against Other Published Estimates
Published market values for tuna and algae omega-3 ingredients can look far apart, even when they use similar sounding labels, because the underlying counting rules are not always the same. The biggest differences usually come from what gets treated as an ingredient sale versus a finished product sale, which years are used for pricing, and how fast algae substitution is assumed to happen.
Some estimates widen the scope into broader omega-3 categories or fold finished supplement and functional food revenues into the same total, which naturally lifts the number. For Mordor Intelligence, only tuna and algae sourced omega-3 ingredients sold into applications like food and beverage, dietary supplements, pharmaceutical, and animal nutrition are counted, and the pricing path is refreshed using recent trade and contract signals before forecasts are extended.
Benchmark comparison
| Source | Market Size | Gaps in Research Methodology |
|---|---|---|
| Mordor Intelligence | USD 2.35 B (2025) | |
| Industry Publisher A | USD 1.68 B (2024) | Uses an earlier base year and a broader segment set that mixes source, packaging, and channel level views, which can depress ingredient revenues if pricing and purity grades are not normalized across regions. |
| Market Tracker B | USD 2.94 B (2024) | Leans on production and shipment reporting alongside revenue, and the conversion from tons to value can overstate totals when refined concentrates and blended oils are valued using a single average price. |
The spread in the table is mainly explained by scope and pricing treatment, not by a disagreement that demand exists. By keeping ingredient only revenues, aligning application demand signals to realistic inclusion rates, and then reconciling with trade and pricing checks, our estimate stays traceable to inputs that can be reviewed and repeated.
Key Questions Answered in the Report
What is the forecast value of the tuna and algae omega-3 ingredient market in 2031?
The market is projected to reach USD 4.14 billion by 2031, growing at a 9.92% CAGR.
Which omega-3 source is growing fastest?
Algae omega-3 is expected to expand at 11.12% CAGR, outpacing tuna-derived oils as infant-formula and sustainability mandates favor cultivated supply.
Why are infant-formula regulations important for omega-3 suppliers?
China’s GB 14880 and EU rules require DHA inclusion, guaranteeing consistent demand for pharmaceutical-grade, allergen-free algae oils.
Which application segment shows the strongest growth momentum?
Pharmaceutical use of EPA and DHA is rising at 10.44% CAGR as prescription therapies gain reimbursement for cardiovascular risk reduction.