
Trenbolone Enanthate Market Size and Share
Market Overview
| Study Period | 2020 - 2031 |
|---|---|
| Market Size (2026) | USD 90.6 Million |
| Market Size (2031) | USD 106.28 Million |
| Growth Rate (2026 - 2031) | 3.25 % |
| Fastest Growing Market | Asia Pacific |
| Largest Market | North America |
| Market Concentration | Medium |
Major Players *Disclaimer: Major Players sorted in no particular order Image © Mordor Intelligence. Reuse requires attribution under CC BY 4.0. | |
Trenbolone Enanthate Market Analysis by Mordor Intelligence
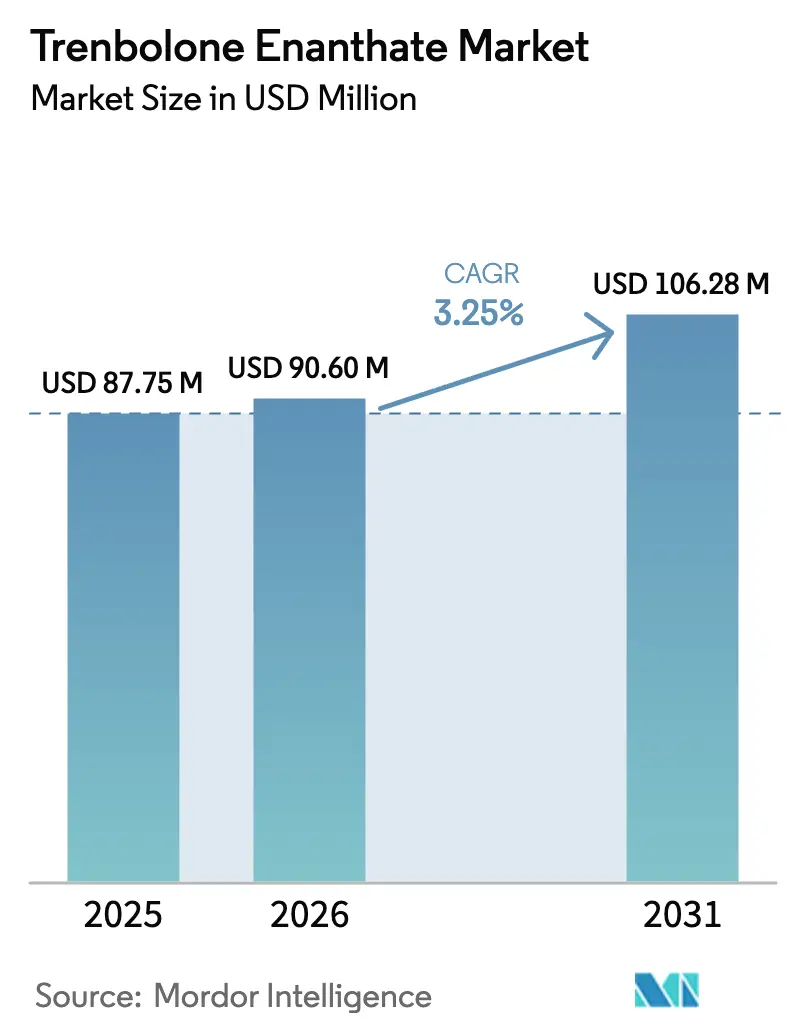
The Trenbolone Enanthate Market size was valued at USD 87.75 million in 2025 and estimated to grow from USD 90.6 million in 2026 to reach USD 106.28 million by 2031, at a CAGR of 3.25% during the forecast period (2026-2031).
Demand is shaped by two parallel channels: regulated livestock growth-promotion products and unregulated human performance-enhancement supply chains. Veterinary implant approvals in North America, expanding cattle herds across Asia-Pacific, and cost-efficient production clusters in China and India underpin steady volume growth. At the same time, persistent consumer interest in physique enhancement, the convenience of encrypted e-commerce, and resilient underground laboratory networks continue to buoy illicit demand despite tightening oversight. The interplay of these factors keeps the trenbolone enanthate market on a moderate but dependable growth trajectory, with legitimate animal-use revenue increasingly offsetting headwinds in human-use segments.
Key Report Takeaways
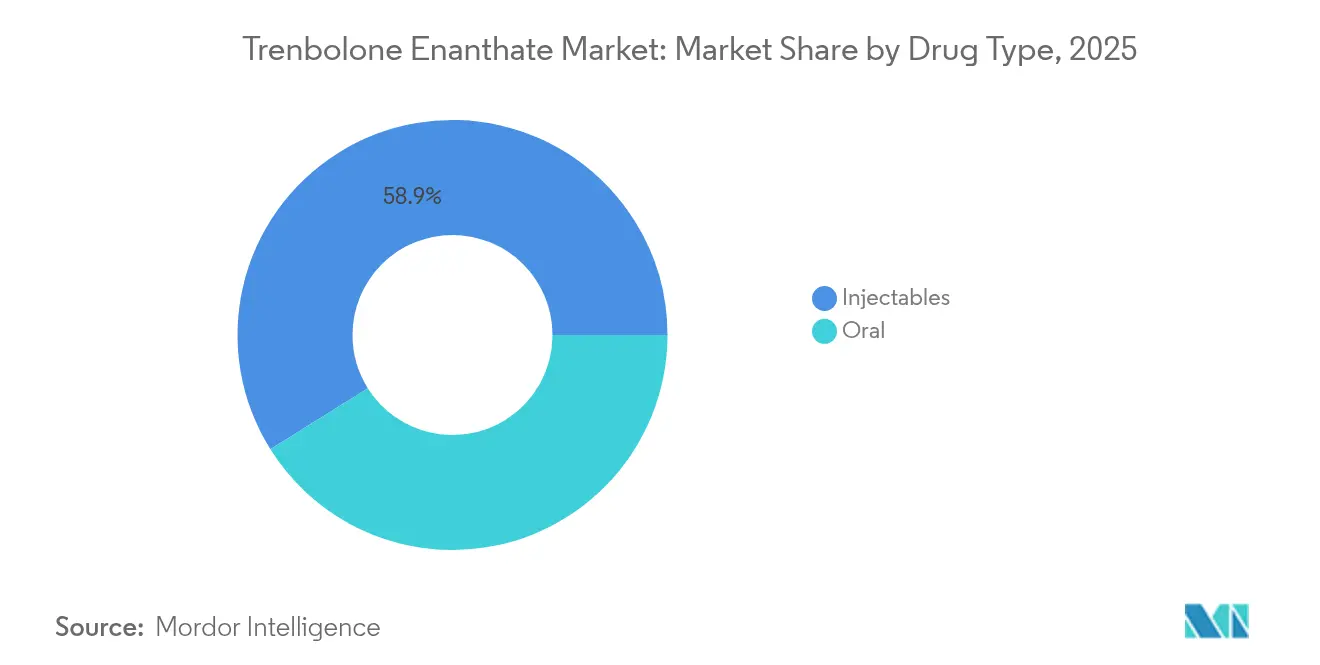
- By drug type, injectable formulations held 58.92% of trenbolone enanthate market share in 2025; the segment is projected to expand at a 6.92% CAGR through 2031.
- By application, human use captured 74.05% revenue share in 2025, while animal use is forecast to climb at an 8.75% CAGR to 2031.
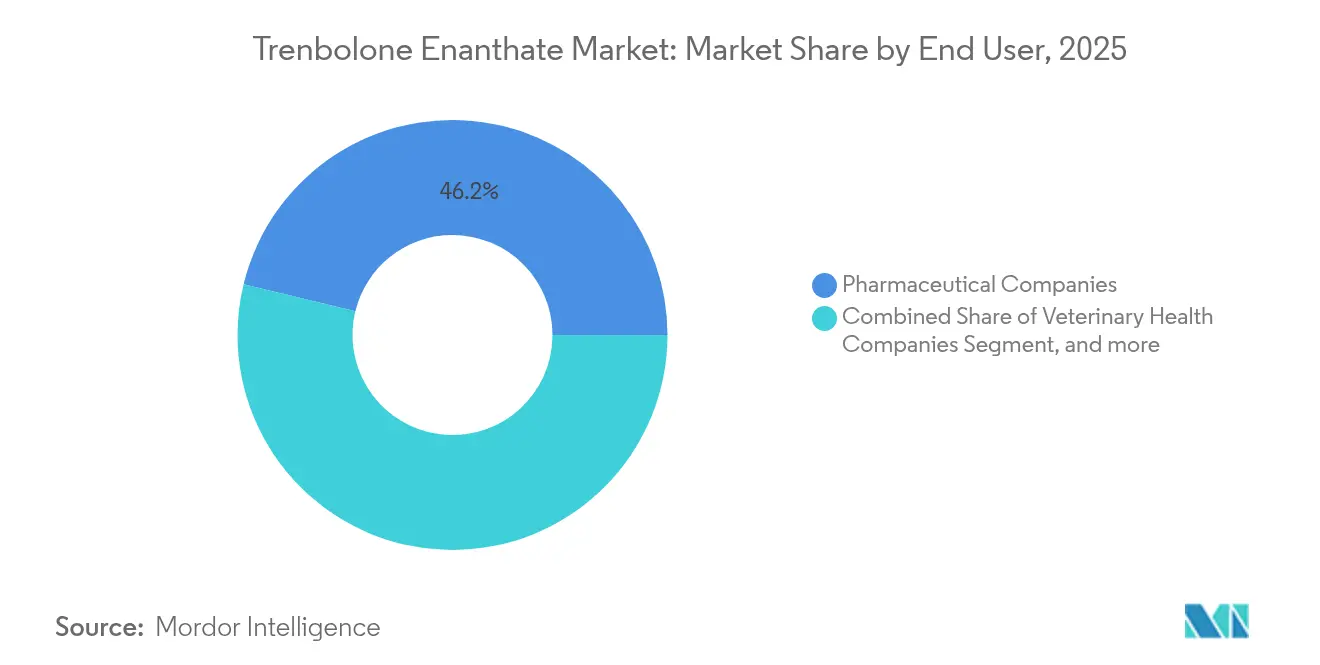
- By end user, pharmaceutical companies accounted for 46.20% of the trenbolone enanthate market size in 2025, whereas veterinary health companies lead growth at a 8.96% CAGR to 2031.
- By geography, North America dominated with 39.82% of 2025 revenue; Asia-Pacific is set to record the fastest regional CAGR of 8.14% through 2031.
Note: Market size and forecast figures in this report are generated using Mordor Intelligence’s proprietary estimation framework, updated with the latest available data and insights as of 2026.
Market Trends and Insights
Drivers Impact Analysis of Trenbolone Enanthate Market*
| Driver | (~) % Impact on CAGR Forecast | Geographic Relevance | Impact Timeline |
|---|---|---|---|
| Surging Interest in Bodybuilding and Fitness Lifestyles | +0.8% | Global, concentrated in North America & Europe | Medium term (2-4 years) |
| Wider Access via Online and Informal Distribution Channels | +0.6% | Global, with Asia-Pacific manufacturing hubs | Short term (≤ 2 years) |
| Rising Use in Veterinary Applications | +1.2% | North America, expanding to Asia-Pacific | Long term (≥ 4 years) |
| Ongoing R&D in Hormonal Deficiency Therapies | +0.4% | North America & EU regulatory markets | Long term (≥ 4 years) |
| Growth of Dark-Web and Crypto-Based Supply Chains | +0.7% | Global, with concentrated activity in developed markets | Medium term (2-4 years) |
| Cost-Effective Peptide/Steroid Manufacturing in Developing Countries | +0.5% | Asia-Pacific core, spillover to global markets | Medium term (2-4 years) |
| Source: Mordor Intelligence | |||
Surging Interest in Bodybuilding and Fitness Lifestyles
Widespread fitness culture and social-media exposure have normalised discussions around performance-enhancing substances, elevating trenbolone’s profile among gym-goers and competitive bodybuilders. Influencers often spotlight dramatic physique transformations, indirectly promoting stronger compounds that promise significant muscle accretion in shorter cycles. Industry surveys in Europe show hundreds of thousands of adult males admitting to anabolic steroid use each year, signalling deep market penetration beyond elite sports. Trenbolone’s anabolic potency, roughly quintuple that of testosterone, makes it a favoured option for advanced users seeking dense, lean mass gains. This cultural shift underpins a stable retail base even while enforcement intensity rises.
Wider Access via Online and Informal Distribution Channels
Encrypted messaging apps, small-batch drop-shipping, and cryptocurrency payments have streamlined consumer access to injectable compounds. Global crypto-enabled drug, with anabolic agents occupying a meaningful share.[1] Suppliers in China routinely adapt product codes and shipping labels, sustaining export pipelines despite customs seizures. Peer-review systems inside private fitness groups cultivate perceived vendor reliability, lowering entry barriers for first-time buyers. Collectively, these digital pathways insulate demand spikes from local supply disruptions and help stabilise the trenbolone enanthate market during enforcement sweeps.
Rising Use in Veterinary Applications
Economic imperatives in beef production continue to drive legitimate implant adoption. FDA supplemental approvals for SYNOVEX Choice and SYNOVEX PRIMER in 2024 validated trenbolone acetate’s feed-efficiency benefits, with treated cattle gaining 2.50 lbs/day versus 2.21 lbs/day in control herds.[2] Studies put incremental profit at USD 5.20 per head, making growth implants a straightforward decision for large feedlots. Asia-Pacific producers are following suit as domestic meat consumption scales with income growth, creating new demand corridors for bulk active pharmaceutical ingredients. These trends anchor long-term volume growth and add regulatory legitimacy to the trenbolone enanthate market.
Ongoing R&D in Hormonal Deficiency Therapies
The FDA’s 2025 class-wide removal of cardiovascular warnings from testosterone therapies revived scientific and investor interest in anabolic molecules with differentiated profiles. Academic labs are exploring trenbolone derivatives for cachexia and muscle-wasting disorders where sustained anabolic support is desirable. Advances in fungal biotransformation now convert steroid precursors at more than 80% efficiency, cutting input costs for high-potency candidates.[3] Although clinical hurdles remain, the pipeline signals incremental, future-oriented upside for the trenbolone enanthate market.
Restraints Impact Analysis of Trenbolone Enanthate Market*
| Restraint | (~) % Impact on CAGR Forecast | Geographic Relevance | Impact Timeline |
|---|---|---|---|
| Tightening Regulatory Oversight and Bans | -1.4% | Global, with strictest enforcement in North America & EU | Short term (≤ 2 years) |
| Shift Toward Safer Alternatives like Selective Androgen Receptor Modulators (SARMs) | -0.9% | North America & Europe, expanding globally | Medium term (2-4 years) |
| High Risk of Adverse Health Effects | -0.8% | Global, with heightened awareness in developed markets | Medium term (2-4 years) |
| Increased Scrutiny on Social Media Advertising Platforms | -0.5% | Global, concentrated in North America & Europe | Short term (≤ 2 years) |
| Source: Mordor Intelligence | |||
Tightening Regulatory Oversight and Bans
Cross-border task forces are scaling up pharmaceutical crime operations, as illustrated by INTERPOL’s 2025 Operation Pangea XVII that seized USD 65 million in illicit medicines and arrested 769 suspects. In parallel, the DEA’s Cyber Juice raids targeted dozens of US-based digital suppliers, underscoring the growing focus on online distribution. Penalties include asset forfeitures and lengthy prison terms, pushing underground labs to absorb higher operating risks and costs. These crackdowns constrict supply, elevate end-user prices, and may deter novice consumers, tempering short-term momentum across the trenbolone enanthate market.
Shift Toward Safer Alternatives like Selective Androgen Receptor Modulators (SARMs)
Clinical literature shows SARMs such as LGD-4033 increasing lean mass while exhibiting milder androgenic effects, addressing core safety objections tied to traditional anabolic steroids. Oral bioavailability and tissue-selectivity make these compounds appealing to risk-averse athletes. Urinalysis data from Scandinavian anti-doping labs registered SARM positives in 4% of male samples during 2024, often in combination with older steroids, indicating accelerating substitution. As mainstream awareness grows, SARMs could siphon a share of discretionary spending away from the trenbolone enanthate market, particularly in regions with aggressive health-risk messaging.
*Our forecasts treat driver/restraint impacts as directional, not additive. The impact forecasts reflect baseline growth, mix effects, and variable interactions.
Trenbolone Enanthate Market Segment Analysis
By Drug Type:
Injectables Sustain LeadershipInjectable products represented 58.92% of the trenbolone enanthate market in 2025. Their superior bioavailability, eight-to-twelve-day half-life, and lower hepatotoxicity compared with oral options support solid user adherence in both cattle management and physique-enhancement cycles. The segment is forecast to compound at 6.92% through 2031, comfortably ahead of oral counterparts. Price competitiveness improves as Chinese contract manufacturers scale GMP-compliant fill-finish lines, creating cost advantages that cascade through veterinary distributors and grey-market resellers. Growing acceptance of once-per-cycle veterinary implant programs further entrenches injectables as the preferred delivery system.
Stronger enforcement against counterfeit oral tablets has also nudged consumers toward sealed-vial products with verifiable batch codes. Combined with more efficient logistics, this shift underpins steady share gains. Oral formulations, constrained by first-pass metabolism and dosage-related liver strain, face muted growth despite niche appeal among needle-averse users. Consequently, injectables will continue to anchor the trenbolone enanthate market, while modest oral sales persist largely as ancillary offerings. This dynamic keeps the injectable segment central to overall trenbolone enanthate market performance.

By Application:
Veterinary Momentum BuildsHuman use retained 74.05% of trenbolone enanthate market revenue in 2025, reflecting entrenched demand across competitive bodybuilding and recreational fitness circles. Nevertheless, animal use displays the strongest forward trajectory, expanding at 8.75% CAGR to 2031. Livestock operators in North America and emerging Asian economies are embracing growth-promotion implants to raise feed-conversion efficiencies and meet surging meat demand. FDA-backed efficacy data reinforces corporate adoption, feeding a stable and legal revenue stream that partially buffers the sector from human-use enforcement volatility.
Regulatory scrutiny of gym-oriented supply chains, coupled with rising SARM alternatives, is likely to curb growth in some human-use pockets. By contrast, veterinary protocols enjoy well-defined safety parameters and economic calculators that link implant utilisation directly to profit per head. As a result, increasing veterinary uptake is set to recalibrate overall demand distribution inside the trenbolone enanthate market, diminishing reliance on illicit sales volumes over time.
By End User:
Veterinary Health Companies Lead GrowthPharmaceutical companies controlled 46.20% of the trenbolone enanthate market size in 2025, leveraging established formulation capacity and global distribution contracts. Yet veterinary health companies are projected to accelerate fastest at 8.96% CAGR. Corporate portfolios are expanding to include cattle-specific implants, long-acting pellets, and combination hormone regimens, backed by comprehensive extension-service marketing. Producers view these suppliers as reliable partners capable of ensuring consistent potency and traceability critical differentiators in export-oriented meat supply chains.
Hospitals and clinics deploy trenbolone derivatives mostly within experimental or compassionate-use frameworks, resulting in a smaller but steady demand baseline. The “other end-user” bucket, dominated by underground labs, is under pressure from law-enforcement seizures that disrupt inventory pipelines. Long term, brand-aligned veterinary health companies are expected to capture incremental wallet share as ranchers prioritise audited supply chains, reinforcing their status as primary growth engines within the trenbolone enanthate market.
Geography Analysis
North America Trenbolone Enanthate Market
North America generated 39.82% of global revenue in 2025, underpinned by FDA-approved cattle implants and a robust bodybuilding subculture that sustains premium-priced injectable sales. Regional veterinary networks benefit from mature cold-chain infrastructure, allowing high-volume distribution directly to feedlots and veterinary pharmacies. Legal avenues for animal-use products, coupled with strict but transparent enforcement on human-use diversion, foster a predictable commercial environment.
APAC Trenbolone Enanthate Market
Asia-Pacific is forecast to expand at 8.14% CAGR, the quickest among all regions. China’s dominance in active ingredient synthesis underpins competitively priced exports, while India’s contract-manufacturing base offers formulation flexibility ranging from multi-dose vials to extended-release pellets. Rapid urbanisation lifts disposable incomes, spurring gym membership growth and wider supplement experimentation among younger demographics. Simultaneously, expanding domestic cattle inventories to satisfy growing protein consumption drives legitimate veterinary uptake, reinforcing demand on both supply and consumption fronts.
Europe Trenbolone Enanthate Market
Europe maintains a cautious stance due to ongoing bans on hormonal growth promoters in livestock. Nevertheless, underground gyms and e-commerce fulfil a consistent illicit stream, particularly in Eastern Europe where price sensitivity favours bulk powder imports repackaged locally. Regulatory bodies coordinate inspections at border crossings and postal hubs, but fragmented enforcement leaves loopholes that cross-border networks exploit. This tension results in modest overall growth, with veterinary potential constrained but human-use demand steady, keeping Europe a significant yet tightly regulated slice of the trenbolone enanthate market.

Regulatory Landscape
Regulation splits between regulated veterinary growth-promotant pathways for trenbolone actives and stringent controls over human possession and diversion. In the United States, trenbolone and its esters are treated as Schedule III controlled substances under the DEA framework, while competitive-sport use is prohibited under World Anti-Doping Agency (WADA) rules. The legal veterinary channel is also shaped by labeled implant indications and post-approval compliance expectations, including the US FDA supplemental approvals in April 2024 for SYNOVEX Choice and SYNOVEX PRIMER implants containing trenbolone acetate for beef cattle performance outcomes.
Outside North America, restrictions tighten for human supply chains. Jurisdictions such as the United Kingdom classifying anabolic steroids (including trenbolone) as controlled substances (Misuse of Drugs Act, Class C), and Australia treating possession of trenbolone esters as a criminal offense, add friction for any non-veterinary use. Enforcement actions against organized distribution networks, for example, UK cases involving illicit anabolic steroid supply, reinforce that most human-use activity sits outside legitimate healthcare channels, pushing compliant participants toward veterinary-labeled products, auditable manufacturing, and research-grade handling rather than consumer-oriented distribution.
Competitive Landscape
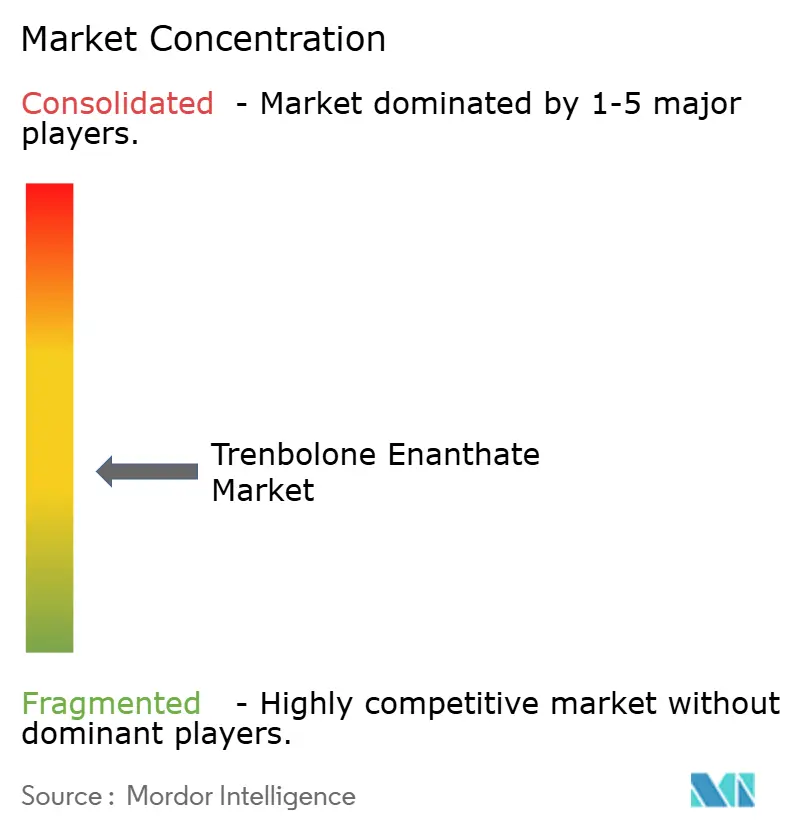
The trenbolone enanthate market is highly fragmented, split between licensed veterinary-product manufacturers and loosely organised underground laboratories. Legitimate firms such as Aspen Veterinary and Huvepharma emphasise GMP compliance, product authentication features, and producer education programs to carve defensible positions. Underground brands like Dragon Pharma and Balkan Pharmaceuticals trade on aggressive dosing claims and discreet shipping, relying on constant rebranding to outpace domain seizures.
Strategic activity is heating up. Jabil’s February 2025 purchase of Pharmaceutics International added 360,000 sq ft of sterile production capacity, signalling rising appetite for high-potency contract manufacturing among mainstream players. Chinese peptide houses are investing in closed-loop wastewater treatment to meet stricter export-licence renewals, improving environmental compliance without materially lifting costs. Meanwhile, European veterinary firms are piloting blockchain batch-tracking to reassure downstream meat processors of hormone-use transparency.
White-space opportunities lie in Latin America and Southeast Asia where regulatory policies are still forming and cattle herds are expanding. Firms that can balance documentation rigour with region-specific cost requirements stand to gain early-mover advantages. Overall rivalry remains intense, but persistent law-enforcement pressure is likely to squeeze small clandestine operators, gradually nudging market share toward auditable producers with diversified veterinary portfolios.
Trenbolone Enanthate Industry Leaders
-
SP Laboratories
-
Alpha Pharma
-
Dragon Pharmaceuticals
-
Kalpa Pharmaceuticals
-
Elite Pharmaceuticals
- *Disclaimer: Major Players sorted in no particular order
Trenbolone Enanthate Market Companies Covered in this Report
- Globalanabolic
- Dragon Pharmaceuticals
- Elite Pharmaceuticals
- Kalpa Pharmaceuticals
- SP Laboratories
- Alpha Pharma
- Labdhi Pharmaceuticals
- Euro Pharmacies
- Meditech Pharmaceuticals
- Hilma Biocare
- Pharmacom Labs
- Gen-Shi Laboratories
- British Dragon
- Landerlan
- Magnus Pharmaceuticals
- Balkan Pharmaceuticals
- Thaiger Pharma
- Swiss Remedies
- Pharmatec
- Bayer
Market Opportunities and Future Outlook
The clearest whitespace is in expanding compliant, traceable veterinary supply chains that connect feed-efficiency economics to audited sourcing. The April 2024 US FDA supplemental approvals for SYNOVEX Choice and SYNOVEX PRIMER, using labeled efficacy data (2.50 lbs/day treated vs 2.21 lbs/day control in referenced studies), remains a practical anchor for veterinary health companies and distributors to broaden producer adoption programs, particularly where cattle inventory growth and feed-cost pressure increase payback sensitivity.
On the supply side, opportunities concentrate around pharmaceutical-grade API reliability and documentation for research and industrial customers, especially in a market where human-use products lack major-health-authority approval. In March 2026, Superpharma Groupceutical reported new pharmaceutical-grade trenbolone enanthate API production batches and cited stabilized bulk pricing for 100 kg quantities, indicating that consistent batch supply and quality systems are becoming differentiators. In addition, contract manufacturing investment aimed at high-potency and sterile capabilities, including Jabil's February 2025 acquisition of Pharmaceutics International with 360,000 sq ft of aseptic and high-potency handling capacity, aligns with demand for compliant manufacturing infrastructure that can support regulated veterinary portfolios and controlled research procurement, even as enforcement operations constrain informal channels.
Recent Industry Developments in Trenbolone Enanthate Market
- July 2026: Evonik Industries AG announced a US$100 million five-year investment plan to modernize its Tippecanoe API manufacturing facility in Lafayette, Indiana. The investment expands domestic capacity for Trenbolone Enanthate related APIs and strengthens supply chain reliability amid regulatory shifts.
- July 2026: Evonik - Announced a US$100 million five-year investment plan to modernize its Tippecanoe API manufacturing site in Lafayette, Indiana. The decision underscores continued emphasis on domestic API production and supply security for Trenbolone Enanthate.
- March 2026: Superpharma Groupceutical Co., Ltd. launched new pharmaceutical-grade Trenbolone Enanthate API production batches to stabilize global supply and pricing (USD 1,900 - 2,300 per kg for 100 kg quantities). The move affects API availability and pricing dynamics, supporting regulated production segments and research-use procurement.
Trenbolone Enanthate Market Report Scope and Research Methodology
Market Definition and Coverage
For this methodology, the market is defined as the value of trenbolone enanthate sold across legal channels, counted at the manufacturer and distributor level, and converted into USD for a consistent view across countries.
Scope exclusions: We exclude counterfeit or untraceable gray-market volumes, non-enanthate trenbolone forms, and unrelated anabolic compounds even when they are sold through similar channels.
Segments Covered in This Report
- By Drug Type
- Oral
- Injectables
- By Application
- Human Use
- Animal Use
- By End User
- Pharmaceutical Companies
- Veterinary Health Companies
- Hospitals & Clinics
- Other End Users
- By Geography
- North America
- United States
- Canada
- Mexico
- Europe
- Germany
- United Kingdom
- France
- Italy
- Spain
- Rest of Europe
- Asia-Pacific
- China
- Japan
- India
- Australia
- South Korea
- Rest of Asia-Pacific
- Middle East & Africa
- GCC
- South Africa
- Rest of Middle East & Africa
- South America
- Brazil
- Argentina
- Rest of South America
- North America
Data Sources, Market Sizing, and Validation
Desk Research
Desk research was used to map the boundary of this market, so the same molecule is not mixed with broader anabolic steroid baskets. We start by reading official regulatory scheduling and enforcement notes, along with pharmacopoeia and controlled-substance lists that clarify what is permitted and how products are labeled.
We then built the base structure using public sources such as FDA safety communications and drug information pages, DEA scheduling references, CDC context on steroid misuse where relevant, and WHO publications on medicines and substance control. We also reviewed import and export statistics where accessible, peer-reviewed journals on veterinary and anabolic steroid use patterns, plus company filings and investor materials that indicate product focus and geographic presence. In a few places, paid subscriptions were used for company financials and intelligence, a patent database check, and shipment-level trade screening to validate directional signals. This desk research list is not exhaustive, and many other sources were also referenced for data collection, validation, and clarification.
Primary Interviews and Surveys
Primary work focused on converting desk signals into sizing inputs that can be defended, including typical pack sizes, channel markups, and how much demand is tied to animal use versus human use. We spoke with a mix of manufacturers, distributors, veterinary health stakeholders, and downstream buyers across major regions so assumptions on pricing, availability, and compliance intensity could be cross-checked and adjusted.
Distribution of primary research fieldwork respondents
| Company type | Respondent position | Region |
|---|---|---|
| Top tier: 39% | CXOs: 13% | APAC: 39% |
| Mid tier: 40% | Functional/Unit leaders: 37% | EMEA: 37% |
| Smaller Players: 21% | Managers: 50% | Americas: 24% |
Market-Sizing & Forecasting
Sizing starts with a top-down demand pool build using country-level signals that can be checked consistently over time, and then the totals are reconciled using selective bottom-up approximations. In practice, we combine region splits with application and channel assumptions, and then sanity-check the result using sampled price points and volume logic, with adjustments where primary feedback indicates gaps.
Inputs that mattered most include the share of injectable versus oral formats, average pack size and concentration norms, typical selling prices by channel, enforcement intensity that shifts legal availability, and the split between animal use and human use in countries where veterinary demand is observable. Where direct volume visibility is weak, gaps are handled by using proxy consumption signals and distributor feedback, and then keeping assumptions conservative until two independent checks agree.
For forecasting, scenario analysis is used around policy and access shifts, followed by time-series smoothing on pricing and demand progression so the curve does not overreact to one-off spikes. The final outlook is reviewed with primary respondents to confirm that the direction of pricing and channel mix changes is realistic for the next five years.
Data Validation & Update Cycle
Model outputs are validated through triangulation across independent signals, where we compare implied consumption and implied pricing against what is seen in public references and what practitioners report in the field. When a country shows an unusual jump, we recheck drivers, including currency conversion timing, assumed format mix, and whether a regulatory event temporarily distorted availability.
Before sign-off, results go through multi-step analyst reviews, and follow-up outreach is triggered when key assumptions move outside expected ranges. Reports are refreshed annually, and interim updates are made when material events occur, such as scheduling changes, enforcement shifts, or major supply disruptions. Right before delivery, a final pass is done so clients receive the most current view supported by the latest validations.
Mordor Intelligence's Trenbolone Enanthate Market Size Compared With Other Published Estimates
Published numbers for this market can look far apart because the molecule is often bundled into broader steroid categories, and because different studies use different years, currencies, and channel boundaries. Even when the same forecast horizon is used, the starting point can drift based on how price and access assumptions are refreshed.
A key gap driver is how average selling prices are updated, since list prices, street prices, and distributor transfer prices move differently and do not always follow the same currency timing. In addition, some estimates blend human use and animal use without consistent screening, and others do not clearly state whether gray-market volumes are treated as part of demand or excluded, which changes the total quickly.
Benchmark comparison
| Source | Market Size | Gaps in Research Methodology |
|---|---|---|
| Mordor Intelligence | USD 90.6 M (2026) | |
| Trade Journal A | USD 80.8 M (2024) | Uses an earlier base year and is presented as a single-point valuation, with limited visibility on how pricing was converted to USD and whether format mix shifts were refreshed into the base. |
| Industry Publisher B | USD 92.6 M (2024) | Includes a broader priced demand view in the base year, but the publication does not clearly document validation checks on application split and channel-level price logic across regions. |
The spread mainly reflects base-year choice and how quickly price and access assumptions are rechecked, especially in a market where availability can change by country and channel. By refreshing currency timing and price logic with periodic re-validation calls, Mordor Intelligence keeps the estimate tied to observable legal demand signals rather than one-time price snapshots.
Key Questions Answered in the Report
What is the current size of the trenbolone enanthate market?
The trenbolone enanthate market generated USD 90.6 million in 2026.
How fast is the trenbolone enanthate market expected to grow?
It is forecast to post a 3.25% CAGR, reaching USD 106.28 million by 2031.
Which drug type commands the largest revenue share?
Injectable formulations led with 58.92% share in 2025 and are projected to grow at 6.92% CAGR.
Why is animal-use demand rising faster than human-use demand?
FDA-approved implants deliver proven feed-efficiency gains, driving livestock producers to adopt the technology, leading to an 8.75% CAGR in the animal-use segment.
Which region offers the strongest growth outlook?
Asia-Pacific is poised for the fastest expansion at 8.14% CAGR, supported by cost-effective manufacturing and expanding cattle inventories.
How does regulatory enforcement affect market dynamics?
Global crackdowns such as INTERPOL’s Operation Pangea and DEA’s Cyber Juice raise compliance costs for illicit suppliers, moderating short-term growth but also shifting demand toward regulated veterinary channels.