
Market Overview
| Study Period | 2020 - 2031 |
|---|---|
| Forecast Data Period | 2026 - 2031 |
| Base Year Market Size (2025) | USD 12.76 Billion |
| Market Size (2026) | USD 13.24 Billion |
| Market Size (2031) | USD 15.95 Billion |
| Growth Rate (2026 - 2031) | 3.79 % |
| Market Concentration | Medium |
Major Players *Disclaimer: Major Players sorted in no particular order Image © Mordor Intelligence. Reuse requires attribution under CC BY 4.0. | |
North America Travel Retail Market Analysis by Mordor Intelligence
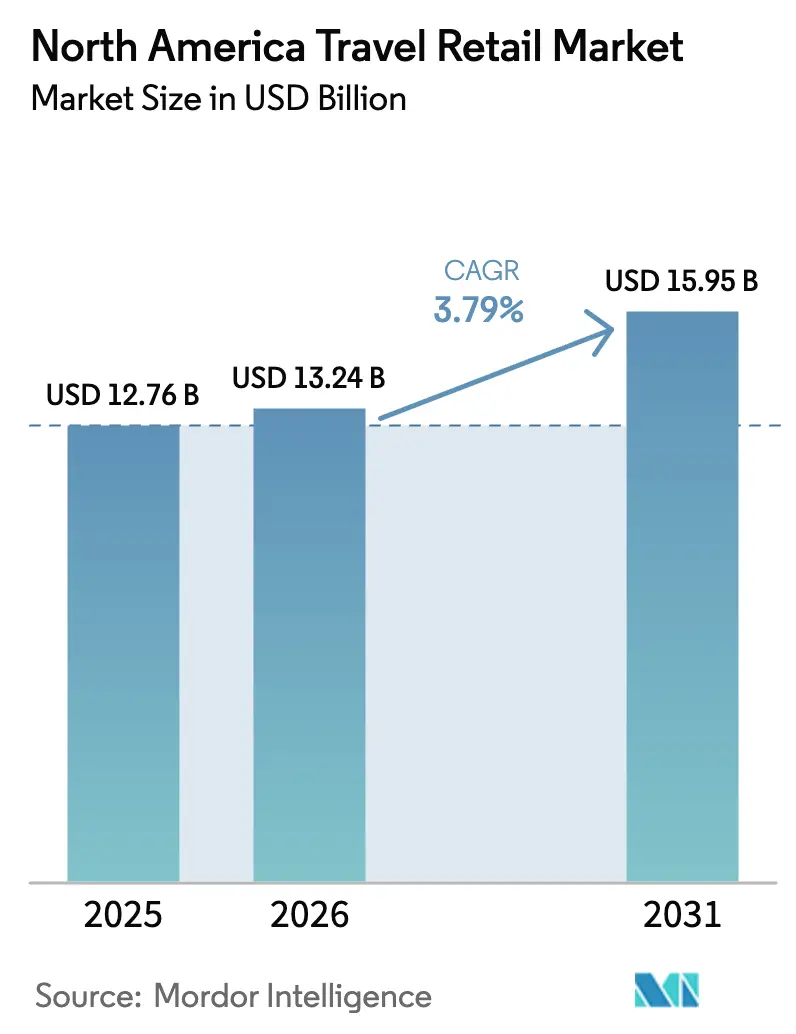
The North America travel retail market size was valued at USD 12.76 billion in 2025 and estimated to grow from USD 13.24 billion in 2026 to reach USD 15.95 billion by 2031, at a CAGR of 3.79% during the forecast period (2026-2031). Operators are transitioning from simple post-pandemic volume recovery to experience-led differentiation that persuades travellers to spend more on each trip, a strategic pivot validated by the finding that four out of five passengers will boost their spending when airports enhance the overall journey. International enplanements climbed to 23.234 million in December 2024, 7% above the prior year, providing a solid traffic base that underpins steady retail receipts [1]. This resilient demand enables concessionaires to test higher-margin assortments, deploy cashier-less technologies, and negotiate longer-term space rights in redeveloped terminals. As a result, the North America travel retail market continues to mature into a data-driven, passenger-centric ecosystem where experience quality outweighs simple product availability.
Key Report Takeaways
- By product category, Fragrances & Cosmetics captured 32.05% of the North America travel retail market share in 2025 and is expanding at a 11.92% CAGR through 2031.
- By distribution channel, airports commanded 86.25% of the North America travel retail market size in 2025, while cruise liners are projected to log the fastest 8.96% CAGR toward 2031.
- By traveller demographic, leisure travellers accounted for 56.10% of the North America travel retail market share in 2025, whereas medical & wellness tourists are rising at a 13.04% CAGR to 2031.
- By geography, the United States held 70.88% of the North America travel retail market share in 2025, yet Mexico is forecast to grow at a 9.92% CAGR through 2031.
Note: Market size and forecast figures in this report are generated using Mordor Intelligence’s proprietary estimation framework, updated with the latest available data and insights as of 2026.
Market Trends and Insights
Drivers Impact Analysis of North America Travel Retail Market*
| Driver | (~ ) % Impact on CAGR Forecast | Geographic Relevance | Impact Timeline |
|---|---|---|---|
| Rebound in international air passenger traffic | +1.2% | U.S.–Mexico corridors, pan-regional hubs | Short term (≤ 2 years) |
| Expansion of airport retail footprints & concession upgrades | +0.8% | JFK, DFW, YYZ, YVR | Medium term (2-4 years) |
| Rising spend per passenger via premiumization | +0.9% | Long-haul business routes | Long term (≥ 4 years) |
| Strong performance of fragrances & cosmetics | +0.7% | International departure concourses | Medium term (2-4 years) |
| Growth of private jet & FBO duty-free | +0.3% | U.S. domestic network, selective Canadian bases | Long term (≥ 4 years) |
| Contactless checkout technologies | +0.4% | Major U.S. hubs, pilot rollouts across Canada | Short term (≤ 2 years) |
| Source: Mordor Intelligence | |||
Rebound in International Air Passenger Traffic
North American carriers recorded a 28.3% jump in traffic during 2023 compared with 2022, regaining 84.6% of 2023 volumes and restoring the essential passenger base that drives the North America travel retail market [2]. International travellers typically out-spend domestic flyers by a factor of three to four, so the rebound instantly translates into stronger retail cash flow. Leisure traffic already surpasses pre-pandemic highs, while business travel remains lower; nevertheless, business travellers still generate premium category sales that cushion overall yields. Mexico contributed 4.002 million international passengers in December 2024, underscoring its emergence as a pivotal growth node linked to upgraded tourism infrastructure and new air-service agreements. Looking forward, Boeing’s 20-year outlook for 43,975 aircraft deliveries ensures adequate lift to sustain volume expansion, reinforcing the long-range health of the North America travel retail market [3].
Expansion of Airport Retail Footprints & Concession Redevelopments
Massive infrastructure programs are redefining commercial space inside major hubs. JFK’s USD 19 billion transformation adds a retail boulevard designed to anchor luxury, dining, and experiential activations, redefining shopping from a convenience add-on into a destination in its own right [4]. Research shows that every 10% rise in passenger dwell time boosts non-aeronautical revenues by roughly 5%, validating airport authority priorities that extend seating, power outlets, and entertainment features to keep travellers engaged. Operators with the financial capability to invest in white-box build-outs, leverage integrated digital engagement strategies, and implement rapid assortment rotations are well-positioned to unlock incremental value within the North American travel retail market. These strategic capabilities allow businesses to respond effectively to evolving consumer preferences, optimize operational efficiency, and strengthen their competitive positioning in a highly dynamic and competitive market landscape.
Rising Spend Per Passenger via Premiumization
Travelers have begun to treat the terminal as the opening chapter of their trip rather than a waiting room. In 2024, 64% of passengers chose to dine during dwell time, eclipsing traditional retail for the very first time and signalling a wider pivot toward experience-oriented consumption. Luxury brands capitalize by launching airport-exclusive capsules and concierge-style services: Byredo’s flagship boutique at LAX demonstrates the magnetic power of high-end fragrances in a captive environment. The monetization of lounge access reflects a strategic shift in consumer spending behaviour, with an increasing number of travellers opting to pay for entry. This trend underscores a growing preference for integrated service-product offerings over standalone products, indicating a transformation in value perception within the travel industry. Generation Z and Millennials, who together will make up the majority of flyers beyond 2026, elevate authenticity and share-worthy moments, forcing retailers to embed storytelling, live demonstrations, and social-media backdrops within the physical store footprint. These dynamics sustain a higher average ticket and solidify premiumization as a multi-year driver of the North America travel retail market.
Strong Performance of Fragrances & Cosmetics Category
Fragrances & Cosmetics enjoy unique advantages that e-commerce cannot easily replicate. Estée Lauder continues to champion travel retail despite macro headwinds, while L’Oréal broadened Armani Beauty counters across top North American airports, signalling brand confidence in the channel’s premium positioning capacity. Margins outshine alcohol and tobacco because beauty products face fewer regulatory hurdles, and product spoilage is minimal. Ultra-premium initiatives, such as Dufry’s haute-perfumeries concept featuring USD 800 SKUs, target affluent flyers who equate scarcity with status. By marrying exclusivity with personalized service, beauty counters amplify conversion and strengthen the overall revenue mix within the North America travel retail market.
Restraints Impact Analysis of North America Travel Retail Market*
| Restraint | (~ ) % Impact on CAGR Forecast | Geographic Relevance | Impact Timeline |
|---|---|---|---|
| Stringent customs limits on tobacco & alcohol | -0.6% | U.S.–Canada land crossings, international arrivals | Long term (≥ 4 years) |
| Competition from downtown duty-free & e-commerce | -0.4% | Major metropolitan cores, cross-border shopping districts | Medium term (2-4 years) |
| Slot-constrained U.S. gateway airports | -0.3% | JFK, Newark, LaGuardia | Short term (≤ 2 years) |
| Wellness shift curbing alcohol demand | -0.5% | North America, most acute among younger cohorts | Long term (≥ 4 years) |
| Source: Mordor Intelligence | |||
Stringent Customs Limits on Tobacco & Alcohol Allowances
Regulatory restrictions are limiting growth opportunities in the high-margin liquor and tobacco markets. Canadian regulations impose strict limits on the quantities of alcohol that residents can bring back after trips lasting at least 48 hours. These limits include 1.5 liters of wine, 1.14 liters of spirits, or 8.5 liters of beer. Such constraints significantly restrict consumer purchase volumes, thereby impacting overall market expansion potential. Comparable U.S. restrictions similarly limit duty-free uptake, particularly at land-border outlets. Although USMCA raised Canada’s courier de minimis threshold to CAD 150, the benefit flows mainly to e-commerce rather than bricks-and-mortar travel retail. Retailers respond by reallocating shelf space to beauty, fashion, and local gourmet lines that face lighter regulatory drag but yield comparable margins.
Competition from Downtown Duty-Free & E-Commerce
Online transparency erodes the airport’s historical price advantage. City-centre duty-free stores now mirror airport assortments without the time pressure of final boarding, while digital storefronts deliver tax-advantaged goods directly to consumers’ homes. Only 15% of younger travellers bypass airport digital channels altogether, underscoring the need for seamless online-to-offline engagement strategies. Reserve-and-collect services attempt to bridge convenience gaps yet demand real-time inventory visibility and last-mile logistics that smaller concessionaires find capital-intensive. The incentive, therefore, is to elevate in-store sensory experiences, tastings, product personalization, and interactive demonstrations that cannot be replicated through a smartphone screen.
*Our forecasts treat driver/restraint impacts as directional, not additive. The impact forecasts reflect baseline growth, mix effects, and variable interactions.
North America Travel Retail Market Segment Analysis
By Product Type:
Beauty Leadership Reshapes Category MixFragrances & Cosmetics dominated with 32.05% of the North America travel retail market share in 2025, and the sub-segment will add revenue at a 11.92% CAGR through 2031, underscoring its pivotal role in sustaining premiumization. Wine & Spirits holds strong average receipt value but labours under duty caps and wellness-driven moderation trends. Tobacco’s structural decline continues, but it still drives footfall among committed smokers who also cross-shop high-margin snacks and accessories. Fashion & Accessories capture impulse luxury purchases through limited-edition drops timed with seasonal travel peaks. Food & Confectionery enjoys a stable gifting and souvenir niche, boosted by Mars Wrigley’s refreshed M&M’s and Maltesers lines geared toward premium flavour profiles. Other product types, including electronics, watches, and jewellery, retain relevance via hands-on testing and instant ownership satisfaction that online channels cannot match.
Retailers allocate prime post-security real estate to beauty because conversion spikes when passengers exit screening. Digital testers, augmented-reality mirrors, and expert-led curation speed shopper decision-making, vital when boarding time looms. Liquor brands shrink bottle sizes for compliance and highlight gift sets priced to align with customs allowances. Confectionery labels invest in storytelling around origin and sustainability, targeting ethically minded flyers. The net effect balances the North America travel retail market portfolio, reducing reliance on any single category and insulating revenue from regulatory swings.


By Distribution Channel:
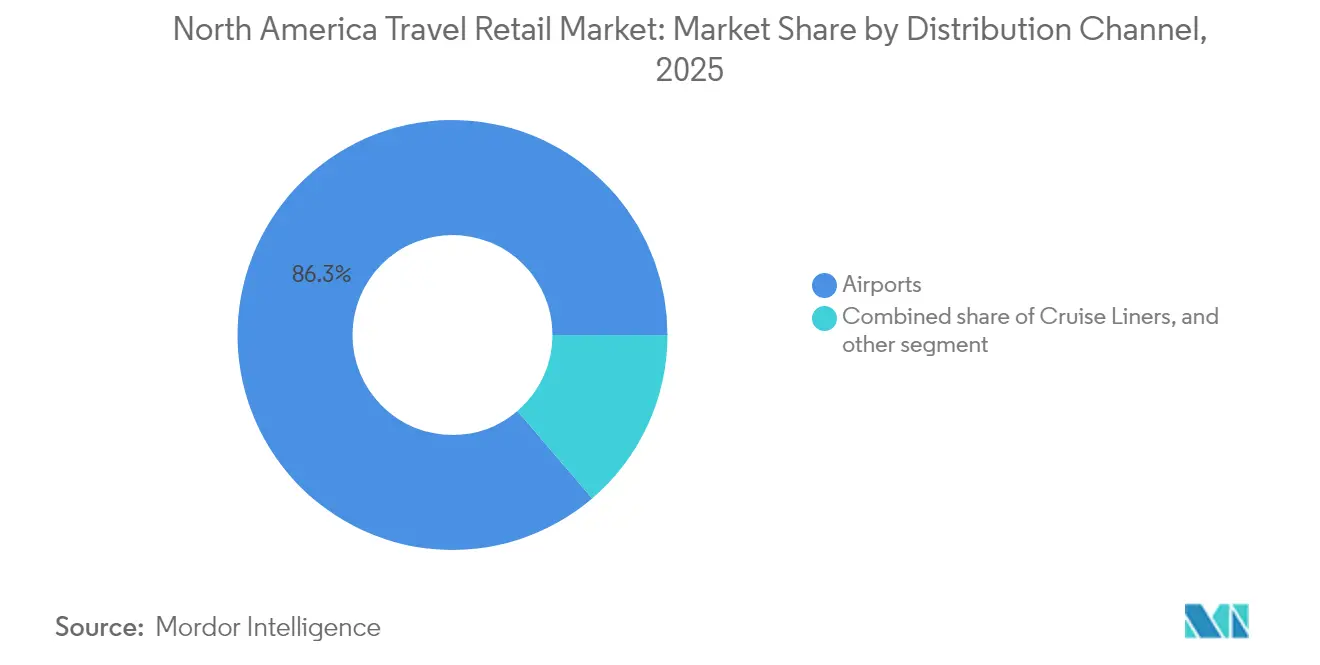
Airport Dominance Meets Efficiency MandateAirports generated 86.25% of the North America travel retail market size in 2025, and while expected growth sits at 8.15% CAGR, physical expansion remains constrained by slot-controlled capacity at legacy hubs. Hudson's implementation of Amazon-powered Just Walk Out technology at JFK and Dulles airports has significantly enhanced operational efficiency by reducing average checkout times to under 30 seconds. This technological advancement enables the company to optimize turnover rates per square foot, demonstrating that operational efficiency, rather than merely increasing physical store size, is a critical driver of revenue growth and profitability.
Cruise liners represent a comparatively small slice but benefit from multi-day dwell periods where relaxed vacationers engage deeply with onboard boutique assortments. Railway stations lag, reflecting North America’s limited intercity rail network relative to Europe or Japan. Border and downtown duty-free stores fight ecommerce headwinds but gain share among cross-border bargain hunters and city tourists. Private terminal duty-free remains nascent yet lucrative, catering to affluent travellers willing to pay premiums for bespoke assortments.
By Traveler Demographics:
Wellness Tourists Outpace Leisure CoreLeisure travellers comprised 56.10% of the North America travel retail market in 2025, powered by pent-up vacation demand and flexible remote-work policies that extend trip lengths. Business travellers, while representing a smaller segment in terms of volume, consistently generate the highest average expenditure per trip. Their spending patterns are heavily skewed towards premium categories such as high-end liquor, advanced tech accessories, and health supplements. This segment's purchasing behaviour reflects a preference for quality and convenience, making them a lucrative target for retailers. In contrast, the visiting friends and relatives (VFR) segment provides a stable and counter-cyclical demand base, driven by strong immigration and diaspora connections. This segment ensures consistent travel flows, even during periods of economic uncertainty, offering retailers a dependable revenue stream.
Additionally, student travellers contribute significantly to travel frequency but exhibit a strong inclination towards cost-effective products, particularly in electronics and fashion categories, highlighting their price-sensitive nature. Retailers strategically align their offerings to cater to the specific needs and preferences of these diverse traveller segments. For wellness-focused visitors, curated "recovery kits" address their health and relaxation needs, while leisure travellers are drawn to sense-of-place memorabilia that enhances their travel experience. For time-constrained business executives, retailers prioritize efficiency by offering time-saving mobile checkout solutions. By tailoring their strategies to the unique demands of each segment, retailers aim to optimize conversion rates and maximize revenue opportunities across the travel retail market.
Geography Analysis
United States Travel Retail Market
In 2025, the United States accounted for 70.88% of the North America travel retail market share. This dominance can be attributed to the presence of the continent's most extensive network of international gateways, coupled with a consistently high monthly volume of foreign passenger traffic. JFK’s USD 19 billion redevelopment alone adds 28,000 sq ft of new retail, illustrating how even mature nodes can unlock incremental value through design overhauls and experiential layering. Yet capacity caps at coastal hubs create scarcity that pushes operators to hone revenue-per-square-foot metrics through AI-driven planograms, dynamic pricing models, and cross-trained staff who fluidly move between categories. Contactless payment adoption hits critical mass, shortening dwell time at the point of sale and improving customer flow.
Canada Travel Retail Market
Canada remains smaller but strategically important, serving as a Pacific and trans-Atlantic bridge. Regulatory friction on alcohol and tobacco compresses category mix, so operators emphasize beauty, fashion, and local artisanal goods with lighter duty constraints. Toronto Pearson and Vancouver International spearhead digital engagement by piloting reserve-and-collect kiosks and biometric payments that reduce queue time. Duty-free stores also benefit from a rebound in Asia-Pacific arrivals, who display a robust appetite for luxury SKUs despite currency volatility.
Mexico Travel Retail Market
Mexico delivers the fastest path at 9.92% CAGR through 2031, propelled by rising middle-class tourism, upgraded airports, and cross-border shopping synergies. Cancun, Mexico City, and Guadalajara airports are rolling out expansions via public-private partnerships that embed modern retail formats from day one. Currency arbitrage against the USD stimulates discretionary spending among U.S. visitors, while Mexican outbound shoppers gravitate toward beauty and fashion categories that still offer price advantages compared to domestic channels. Hybrid cross-border terminals, such as Tijuana–San Diego, pioneer dual-country duty-free models that exploit differing regulatory regimes to widen assortment breadth. The net result is a more diversified North America travel retail market revenue mix, reducing over-reliance on U.S. gateway performance.
Regulatory Landscape
Travel retail in North America runs under customs and bonded-warehouse regimes that determine how duty-free goods are stored, sold, and accounted for, alongside local airport concession and tax requirements. In the United States, duty-free stores operate within the bonded warehouse framework in Title 19 (19 CFR 19.35-19.39), with approvals and ongoing compliance overseen at the port level, which reinforces strict inventory controls and export documentation for duty-free releases.
In Canada, duty-free shops are governed under the Customs Act and Duty Free Shop Regulations (SOR/86-1072), with the regulations last amended in October 2024, and licensing and account management increasingly routed through the CBSA Assessment and Revenue Management (CARM) Client Portal. At the sub-national level, Washington State House Bill 2061 takes effect January 1, 2026 and establishes a concession fee formula for duty-free enterprises operating in the state, adding another commercial term to assess alongside the federal duty-free rules.
Value Chain Analysis
The value chain begins with brand owners and manufacturers (beauty, spirits, tobacco, confectionery, and luxury accessories) supplying travel retail-exclusive and core SKUs to operators through regional distributors and specialist logistics providers. Inventory is staged through bonded warehouses and U.S. Foreign Trade Zones to maintain duty suspension until qualifying export, while compliance controls influence assortment decisions and pack sizing, particularly for regulated categories such as alcohol and tobacco.
Retailers and concessionaires (for example, Avolta, HMSHost, Paradies Lagardere, WHSmith North America, and 3Sixty Duty Free) then operate airport, cruise, and border-store formats under long-term concession agreements with airport authorities and landlords such as Unibail-Rodamco-Westfield Airports. Fulfillment increasingly includes reserve-and-collect and other pre-order workflows, which raises the need for real-time inventory visibility and dependable replenishment cycles, while cross-border logistics can also shape supply planning. Lead times in key corridors for high-value beauty and spirits are influenced by both infrastructure and border throughput.
Competitive Landscape
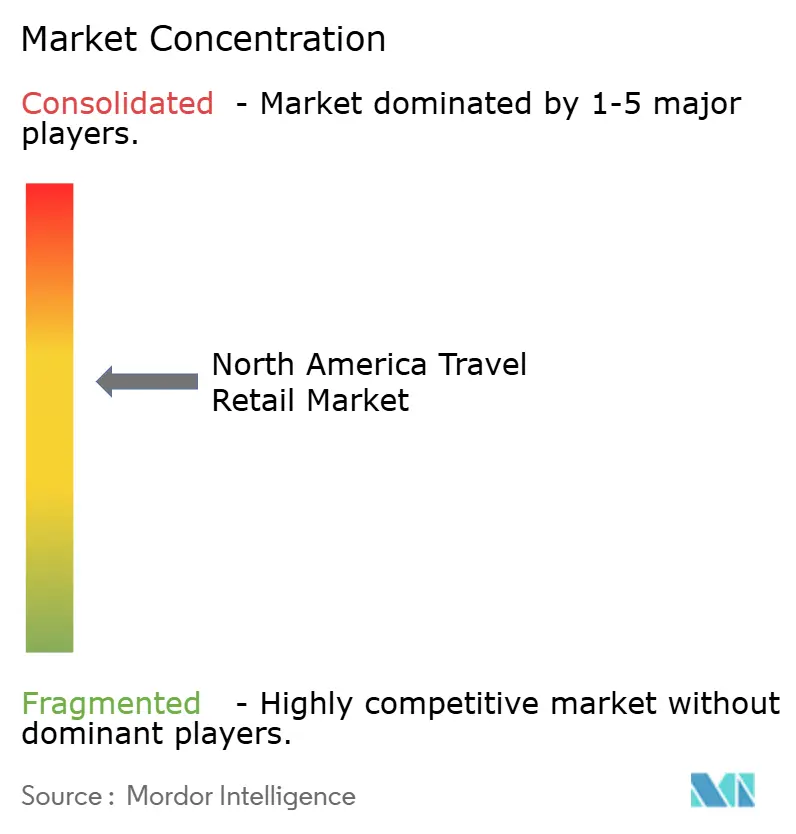
The North America travel retail market exhibits a moderately concentrated structure, with a significant portion of the market controlled by leading operators such as Avolta (a merger of Hudson and Dufry), HMSHost, Paradies Lagardère, WHSmith North America, and 3Sixty Duty Free. These dominant players collectively hold a substantial market share, yet the market dynamics continue to present opportunities for niche players to enter and establish a foothold. Technology is the decisive competitive lever: Hudson’s cashier-less outlets powered by Amazon’s Just Walk Out algorithms cut transaction times and raise conversion, while Paradies Lagardère pilots Scan-Pay-Go mobile checkout lines that shorten queuing without sacrificing basket size.
WHSmith’s 2025 migration to a cloud-native retail platform enables unified inventory and CRM analytics across what will be 500 U.S. stores by 2028. Avolta pushes premium beauty environments and exclusive boutique collaborations, while HMSHost combines food & beverage with curated retail to extend dwell-time monetization. Emerging white-space includes private-jet duty-free, wellness-centric concepts, and omnichannel tie-ins that merge downtown flagship stores with airport collection points. Smaller regional specialists exploit local-culture storytelling to secure ACDBE-compliant contracts, keeping competitive pressure high despite the scale advantages of incumbents.
North America Travel Retail Industry Leaders
-
Dufry (Hudson)
-
Duty Free Americas
-
Paradies Lagardère
-
WH Smith (InMotion)
-
WH Smith (InMotion)
- *Disclaimer: Major Players sorted in no particular order
North America Travel Retail Market Companies Covered in this Report
- Dufry (Hudson)
- Duty Free Americas
- Paradies Lagardère
- WH Smith (InMotion)
- DFS Group
- 3Sixty Duty Free and More
- OTG Management
- Heinemann Americas
- SSP America
- Areas USA
- Unibail-Rodamco-Westfield Airports
- Sterling Duty Free
- Aer Rianta International NA
- Delaware North Travel Hospitality
- HMSHost
- InMotion Entertainment Group
- Hudson Nonstop
- Relay
- Valora Retail USA
- Lotte Duty Free (US)
Market Opportunities and Future Outlook
Large airport capital programs are a major whitespace for concessionaires and brand partners because they reset terminal layouts, lease structures, and the mix of retail and food space. For example, the $125 million commercial program inaugurated at JFK Terminal 8 includes over 60 new dining, retail, and duty-free concepts, and Hudsons 12-year contract extension at Miami International Airport supports renovations for nearly 40 retail stores tied to the airports $9 billion modernization program. Together, these projects expand the addressable footprint for premiumization, experiential concepts, and faster checkout formats.
A second opportunity is experience-led localization that helps airports differentiate and lift conversion without relying only on passenger growth. Paradies Lagardere opened three retail concepts at Hartsfield-Jackson Atlanta International Airport under a Made in Atlanta at ATL, illustrating how sense-of-place assortments and local storytelling are being incorporated into concession strategies. Operators are also rebalancing channel exposure as land-border duty-free in Canada faces demand pressure, reflected in the Frontier Duty Free Association reporting a year-on-year decline of over 40% in cross-border travel by Canadians in June 2026. That shift supports a focus on airport hubs, cruise-linked logistics, and omnichannel pre-order, which better monetizes dwell time.
Recent Industry Developments in North America Travel Retail Market
- June 2026: Hudson (Avolta) secured an 8-year contract extension at Phoenix Sky Harbor International Airport to redevelop and modernize its terminal retail footprint. The renewal supports longer-dated investment in store reconfigurations and higher-throughput formats that improve revenue per square foot in a capacity-constrained hub.
- February 2026: Hudson (Avolta) signed a 12-year contract extension at Miami International Airport to reimagine nearly 40 retail stores as part of the airports $9 billion modernization program. Locking in a multi-year runway at a major international gateway strengthens tenant stability and creates room for phased remodels, new concepts, and digital enablement across a large store base.
- November 2025: Hudson (Avolta) was awarded a 10-year contract at Washington Dulles International Airport to open five new retail stores in Concourse E, with openings scheduled for late 2026. The win expands coverage in a key international concourse and reinforces the role of long-term concessions in shaping competitive access to premium passenger flows.
North America Travel Retail Market Report Scope and Research Methodology
Market Definition and Coverage
For this study, the North America travel retail market includes retail sales of consumer goods made to travelers inside travel-linked locations, such as airports and other transit points, across the United States, Canada, and Mexico.
Scope exclusions: Sales from ordinary city retail that are not tied to a travel location, plus non-retail services (such as ticketing, food service, and parking), are excluded.
Segments Covered in This Report
- By Product Type
- Fashion and Accessories
- Wine and Spirits
- Tobacco
- Food and Confectionery
- Fragrances and Cosmetics
- Other Product Types (Stationery, Electronics, Watches, Jewelry, etc.)
- By Distribution Channel
- Airports
- Cruise Liners
- Railway Stations
- Other Distribution Channels
- By Traveler Demographics
- Business Travelers
- Leisure Travelers
- Visiting Friends and Relatives (VFR)
- Medical and Wellness Tourists
- Student Travelers
- By Geography
- Canada
- United States
- Mexico
Data Sources, Market Sizing, and Validation
Desk Research
Desk research began by mapping the travel volumes that create demand for travel retail and the places where purchases happen. We used public transportation and tourism statistics, along with airport and border flow releases, to understand how passenger mix and trip purpose typically affect conversion and basket size.
The key public sources we leaned on included data and releases such as those from the US Bureau of Transportation Statistics, US Customs and Border Protection border-crossing and travel statistics, the US Department of Commerce travel and tourism indicators, Statistics Canada travel and international arrivals series, Mexico INEGI transport and tourism tables, and airport authority websites and annual reports. We also reviewed retailer and brand filings, investor presentations, and updates from trade associations to track store openings, concession awards, and category emphasis. Where needed, paid subscriptions for company financials and intelligence, news and financials, and global contracts and tenders were used to validate timelines and scale assumptions. The desk sources listed here are illustrative, and many other public and paid references were also used for data collection, validation, and clarification.
Primary Interviews and Surveys
Primary work used expert interviews and surveys with airport retail operators, travel retail store managers, brand-side commercial teams, and logistics and distribution partners. This helped confirm what desk sources cannot show consistently, particularly for assumptions around traveler mix, category performance, and pricing behavior.
Because the market is regional, coverage included major hubs and secondary airports across the United States, Canada, and Mexico, so the interview input could be used to test and adjust country and airport-level patterns.
Distribution of primary research fieldwork respondents
| Company type | Respondent position |
|---|---|
| Top tier: 28% | CXOs: 12% |
| Mid tier: 52% | Functional/Unit leaders: 34% |
| Smaller Players: 20% | Managers: 54% |
Market-Sizing & Forecasting
Market sizing used the top-down and bottom-up approach, where passenger flows and travel-hub retail intensity were first used to rebuild the demand pool by country, and then checked against operator and supplier signals. In the top-down build, airport passenger throughput, international versus domestic mix, and traveler spend propensity were converted into an addressable retail value, which was then split using observed category and channel shares.
To keep inputs grounded, we tracked a short list of travel retail fingerprints that can be validated: passenger throughput by airport group, international passenger share, duty-free eligibility and allowance rules, concession space changes tied to tender cycles, and average spend per traveler by category (as indicated by operator feedback and public disclosures). Pricing was handled through practical average selling price progression that reflects inflation and product mix shifts, and volumes were adjusted for conversion rate changes at key hubs. Bottom-up checks were then applied using sampled store productivity benchmarks, channel checks on tendered concession footprints, and selective roll-ups from public revenue cues. Where a hub or sub-channel did not disclose retail details, gaps were handled through ratio-based interpolation.
For forecasting, we relied on scenario analysis supported by primary inputs on route capacity outlook, travel recovery shape, and expected category normalization, and then we stress-tested results against macro travel indicators. The final forecast path was kept stable by limiting assumptions to variables that can be refreshed each year without needing hard-to-access internal transaction data.
Data Validation & Update Cycle
Validation was done in layers so the outputs remain explainable and repeatable. We compared model totals against independent signals such as airport non-aeronautical revenue disclosures, concession award announcements, and observed shifts in passenger traffic, and then investigated any large variances before sign-off.
Checks were also run for outliers in implied spend per traveler, category mix swings, and country-level splits to make sure the story matches what industry participants described. When a mismatch appeared, follow-up calls were triggered to re-test the assumption, and the model was adjusted only after the reason was clear and consistent. Reports are refreshed annually, with interim updates added when material events occur, such as major airport concession resets or sharp travel demand changes. Before delivery, we do a fresh final pass so clients receive the most current view of the market.
Mordor Intelligence's North America Travel Retail Market Size Compared Against Other Published Estimates
Published market values for North America travel retail can look far apart, even when the topic name sounds the same, because the underlying market scope is not consistent across publishers. Differences usually come from what locations are counted, how duty-free versus duty-paid sales are treated, and whether sizing is anchored to passenger traffic or to broader retail categories.
The main gap comes from channel coverage, where Mordor Intelligence only counts sales that occur inside travel-linked retail points (most often airport terminals and similar controlled transit locations) and keeps downtown tourist shopping outside the market total, even if the same brands are purchased. Another common reason is how spend per traveler is projected, since some estimates assume a faster mix shift into premium categories than what operators report in typical traffic months. Timing differences also matter, because base-year selection and currency conversion choices can change the regional total even when growth rates look similar.
Benchmark comparison
| Source | Market Size | Gaps in Research Methodology |
|---|---|---|
| Mordor Intelligence | USD 13.24 B (2026) | |
| Trade Journal B | USD 16.39 B (2025) | May blend airport travel retail with wider travel-related retail sales, and it anchors the series to an earlier year that changes the implied recovery ramp and spend per traveler. |
| Regional Consultancy A | USD 9.00 B (2024) | Likely uses narrower channel coverage and more conservative conversion assumptions, and it may exclude selected duty-paid travel retail formats or parts of Mexico from the regional total. |
The comparison shows that scope around where the sale happens, plus how spend per traveler is built over time, drives most of the spread. Our sizing steps keep the number tied to observable passenger and concession signals, which makes updates straightforward when travel volumes and airport retail footprints change.
Key Questions Answered in the Report
How large is the North America travel retail in 2026?
Sales reached USD 13.24 billion in 2026.
Which product category leads duty-free sales in the region?
Fragrances & Cosmetics command 32.05% share and post the quickest 11.92% CAGR through 2031.
What is the projected CAGR for the sector between 2026 and 2031?
Spending is forecast to rise at a 3.79% CAGR over the period.
Which traveler demographic is expanding the fastest?
Medical & wellness tourists are advancing at a 13.04% CAGR to 2031.
Why do airports remain the dominant retail channel?
Airports hold 86.25% share thanks to captive footfall, duty-free pricing and sustained infrastructure investment.
Which country shows the fastest growth through 2031?
Mexico is projected to progress at a 9.92% CAGR as tourism infrastructure and cross-border travel expand.