
Transplant Box Market Size and Share
Market Overview
| Study Period | 2020 - 2031 |
|---|---|
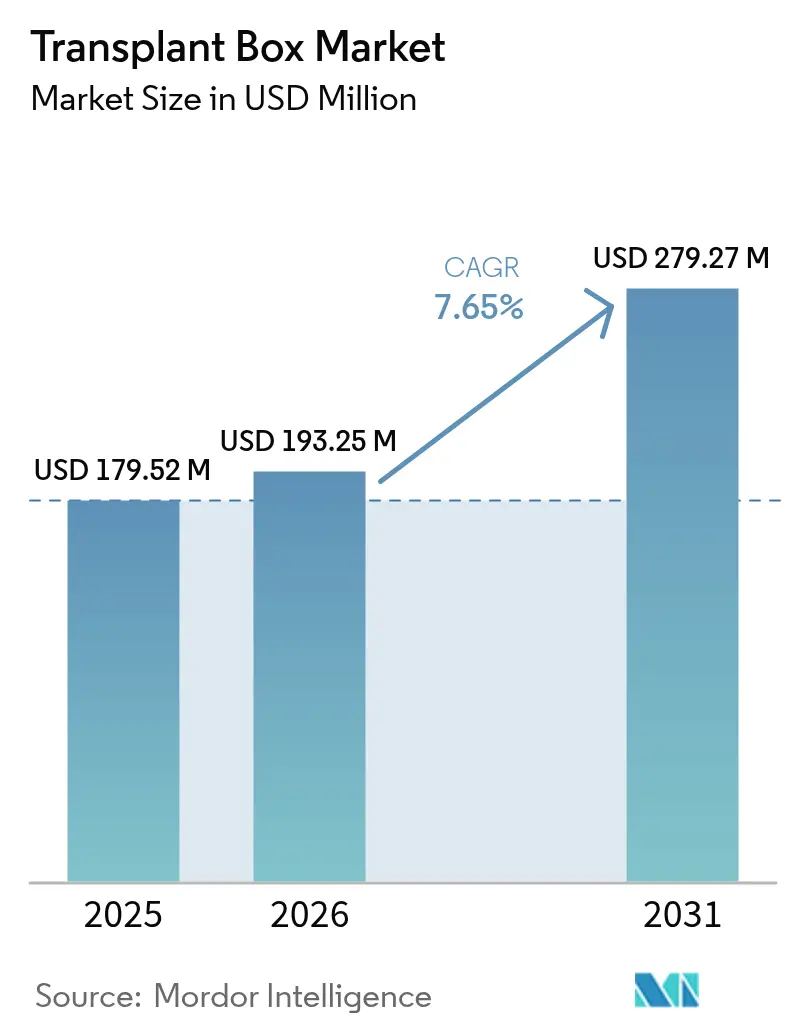
| Market Size (2026) | USD 193.25 Million |
| Market Size (2031) | USD 279.27 Million |
| Growth Rate (2026 - 2031) | 7.65 % |
| Fastest Growing Market | Asia Pacific |
| Largest Market | North America |
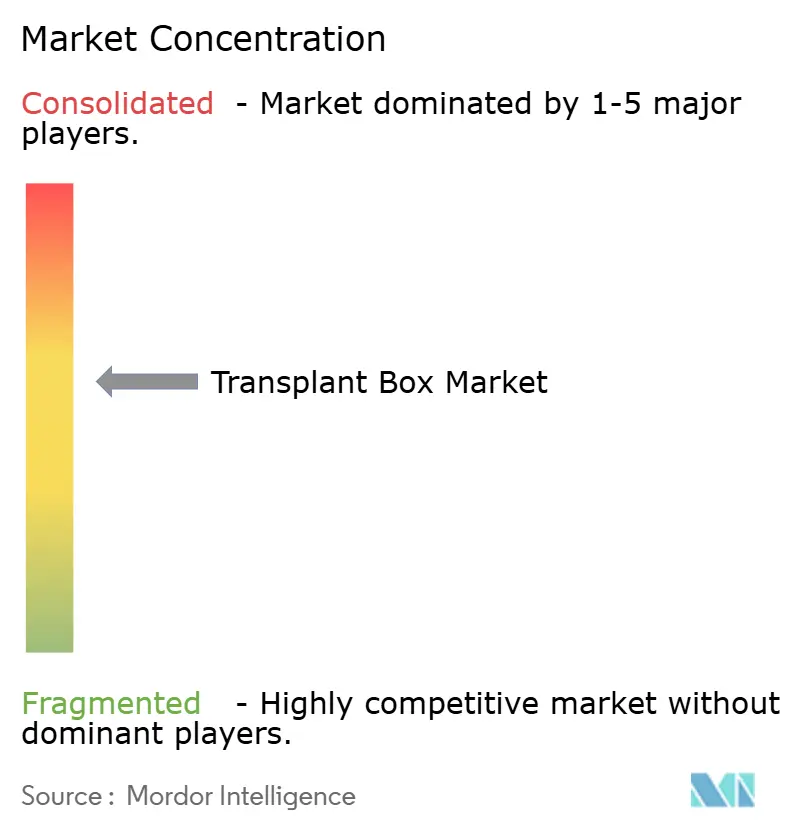
| Market Concentration | Medium |
Major Players *Disclaimer: Major Players sorted in no particular order Image © Mordor Intelligence. Reuse requires attribution under CC BY 4.0. | |
Transplant Box Market Analysis by Mordor Intelligence
Transplant box market size in 2026 is estimated at USD 193.25 million, growing from 2025 value of USD 179.52 million with 2031 projections showing USD 279.27 million, growing at 7.65% CAGR over 2026-2031. Demand scales with global efforts to relieve the persistent organ-shortage gap, where only 10% of transplant requirements are currently met. Rapid substitution of static ice boxes with portable normothermic perfusion devices extends organ viability during transport and allows continuous physiological monitoring, factors that directly underpin volume growth. Military research programs are catalyzing a parallel wave of battlefield-ready solutions with 48-hour resuscitation targets. At the same time, opt-out donor laws, national registry expansions, and rising comorbidities in ageing and diabetic populations create a reliable, long-term demand pipeline. Regulatory multiplicity and shortages of certified cold-chain personnel remain material headwinds, yet ongoing product standardization and automation investments are expected to mitigate these constraints.
Key Report Takeaways
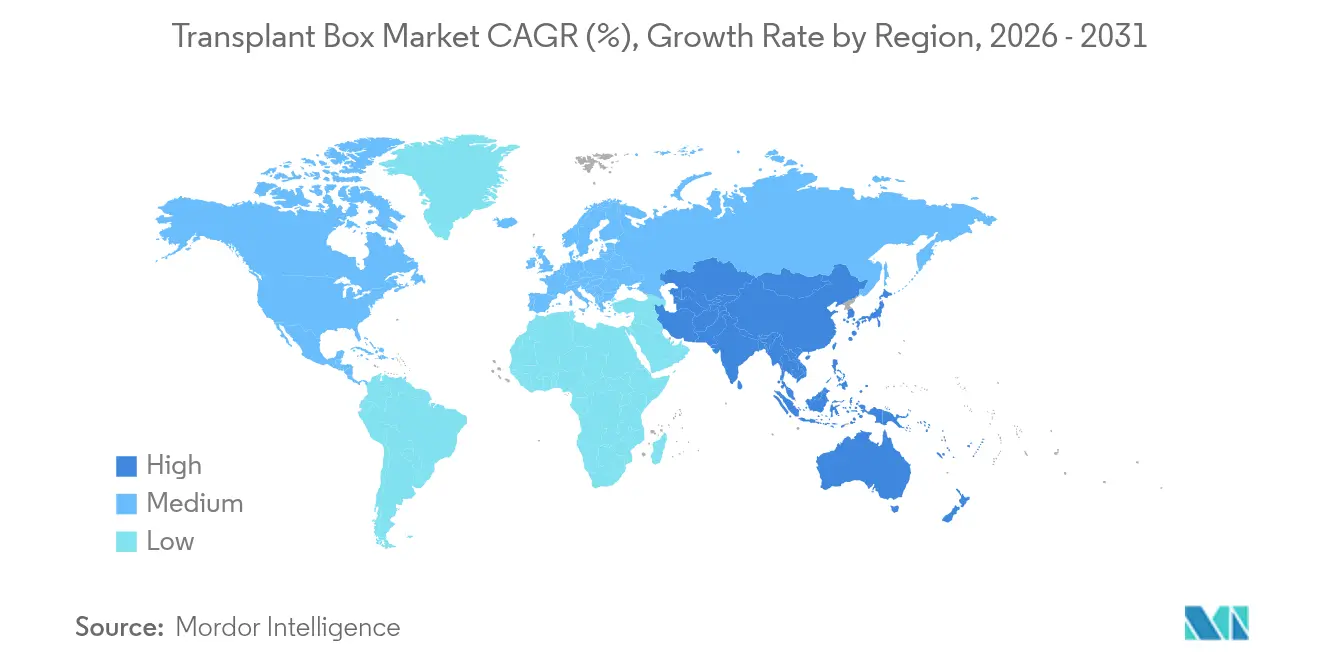
- By geography, North America led with 37.20% of the transplant box market share in 2025 while Asia-Pacific is projected to expand at a 10.42% CAGR through 2031.
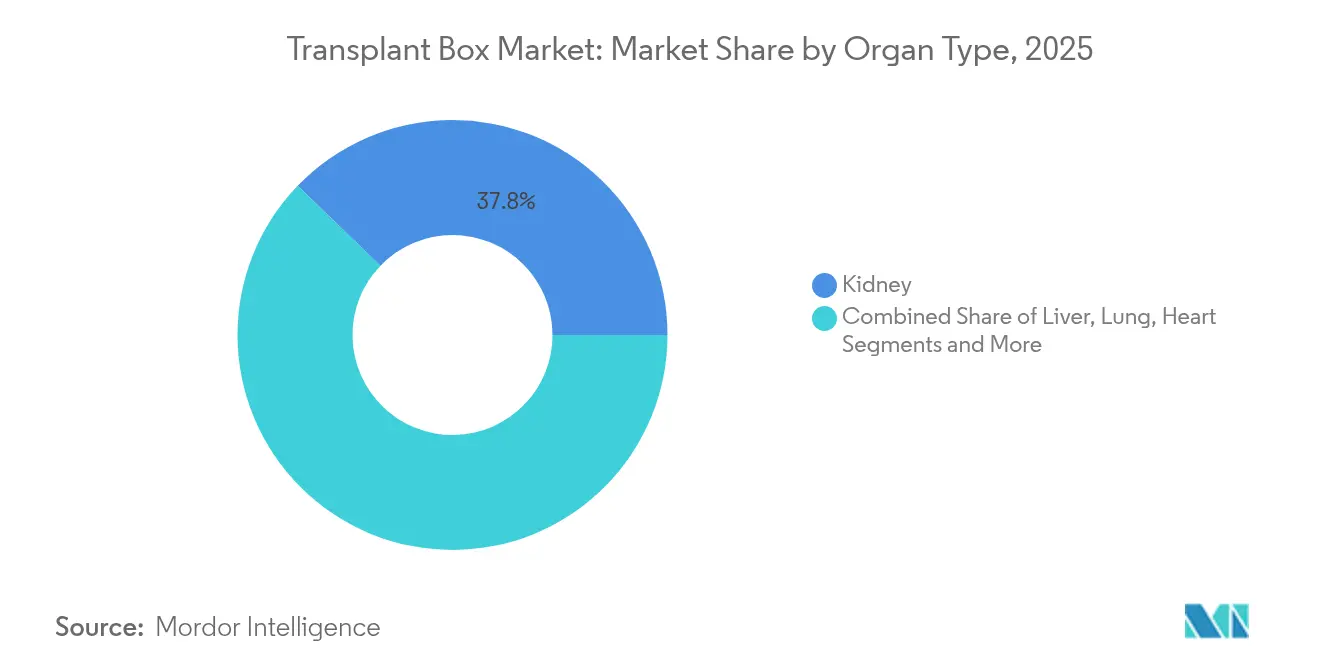
- By organ type, kidney preservation held 37.80% revenue share of the transplant box market in 2025 whereas lung systems are on track for the fastest 11.88% CAGR to 2031.
- By preservation technology, static cold storage retained 53.85% share of the transplant box market in 2025 but normothermic perfusion systems are forecast to register a 16.10% CAGR.
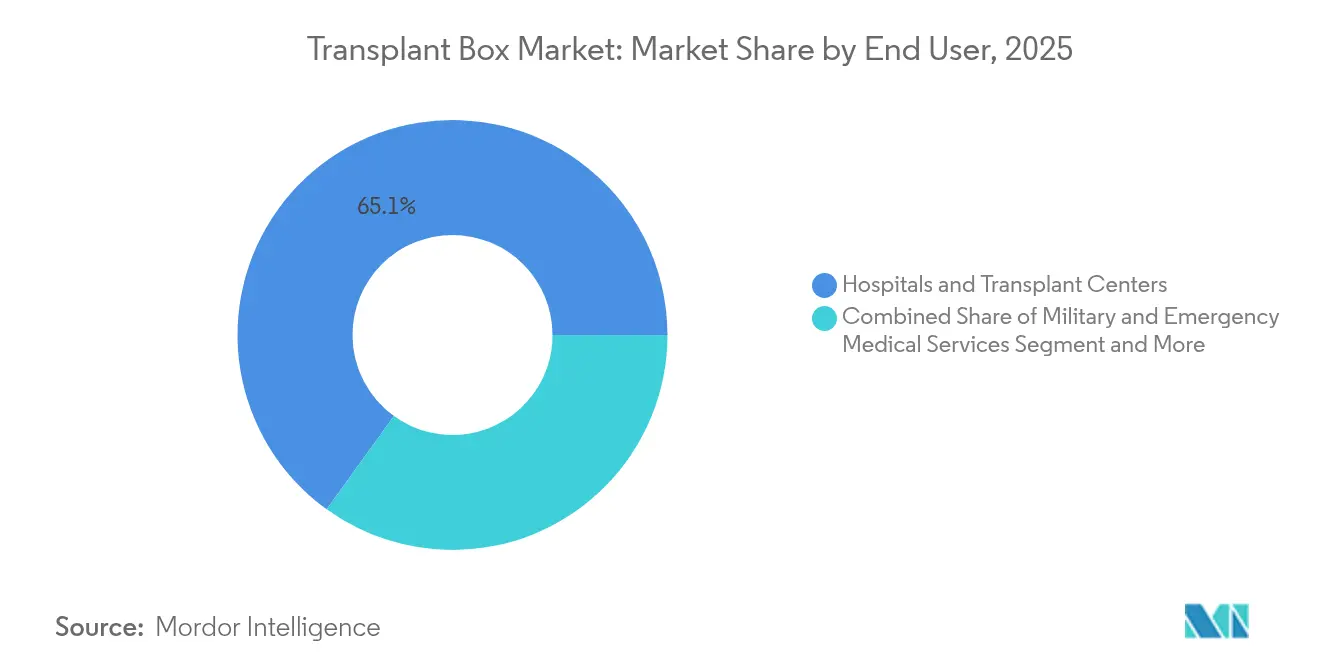
- By end user, hospitals and transplant centers accounted for 65.05% of the transplant box market size in 2025, while military and emergency medical services are poised for a 13.05% CAGR.
Note: Market size and forecast figures in this report are generated using Mordor Intelligence’s proprietary estimation framework, updated with the latest available data and insights as of 2026.
Market Trends and Insights
Drivers Impact Analysis of Transplant Box Market*
| Driver | (~) % Impact on CAGR Forecast | Geographic Relevance | Impact Timeline |
|---|---|---|---|
| Growing multi-organ transplant volumes in ageing and diabetic populations | +2.1% | North America and Europe anchored, global reach | Long term (≥ 4 years) |
| Government and NGO programs enlarging donor registries | +1.8% | Asia-Pacific and Europe early gains, global scope | Medium term (2-4 years) |
| Shift to portable normothermic perfusion systems | +2.3% | North America and European Union, ripple to Asia-Pacific | Short term (≤ 2 years) |
| Hospital demand for real-time organ analytics | +1.4% | Developed markets worldwide | Medium term (2-4 years) |
| Military-funded R&D for battlefield organ transport | +0.9% | United States primary, NATO allies secondary | Long term (≥ 4 years) |
| Source: Mordor Intelligence | |||
Increasing Volume of Multi-Organ Transplants in Ageing and Diabetic Populations
Record organ recovery volumes in 2024 confirm that older and diabetic cohorts are driving sustained procedure growth[3]Association of Organ Procurement Organizations, “U.S. Organ Procurement Organizations Achieve Record Organs Recovered and Transplanted in 2024 Amid Policy Challenges,” aopo.org. Higher prevalence of end-stage renal disease and cardiometabolic complications requires longer preservation windows that static cold storage cannot guarantee. Emerging economies mirrored this rise, highlighting untapped regional demand. Allocation systems now prioritize sicker patients, which often adds inter-state or cross-border travel to procurement logistics. These factors collectively elevate the clinical necessity for advanced devices across the transplant box market.
Government & NGO Programs Expanding Donor Registries
Legislative changes such as Ireland’s opt-out Human Tissue Act 2024, in effect from June 2025, instantly enlarge donor pools. Japan’s coordinator certification framework and India’s expanded brain-death criteria similarly shorten consent cycles and raise utilization rates. The WHO strategy that calls for every member state to meet transplant demand by 2035 institutionalizes this momentum. Expanding donor availability directly lifts shipment volumes and places fresh emphasis on reliable, data-rich preservation hardware.
Shift from Static Cold Storage to Portable Normothermic Perfusion Systems
Clinical evidence proves that normothermic perfusion lowers primary graft dysfunction from 28% to 11% in heart cases, enabling longer journey times without outcome penalties. TransMedics’ Organ Care System illustrated this demand by more than doubling quarterly revenue in 2024. Innovations such as HOPE for lungs allow 20-hour ex-vivo windows, opening donation from distant locations. Early adoption confers measurable competitive advantages and reshapes purchasing criteria across the transplant box market.
Hospital Demand for Real-Time Organ-Condition Analytics
Hospitals increasingly integrate sensor-equipped boxes that deliver continuous pH, lactate, and impedance data, aligning with quality-improvement mandates and malpractice-risk mitigation. The FDA’s qualification plan for the iBox predictive scoring system signals regulatory support for data-driven evaluation. Institutions justify premium pricing when analytics translate into lower readmission and graft-loss rates, reinforcing a technology-led differentiation cycle in the transplant box industry.
Restraints Impact Analysis of Transplant Box Market*
| Restraint | (~) % Impact on CAGR Forecast | Geographic Relevance | Impact Timeline |
|---|---|---|---|
| High capital and per-use cost of advanced transplant boxes | -1.7% | Most acute in emerging markets | Short term (≤ 2 years) |
| Complex multi-jurisdictional regulatory clearances | -1.2% | EU–US–Asia corridors | Medium term (2-4 years) |
| Global shortage of qualified cold-chain logistics personnel | -0.8% | Rural and remote regions globally | Long term (≥ 4 years) |
| Source: Mordor Intelligence | |||
High Capital & Per-Use Cost of Advanced Transplant Boxes
Liver transplant expenses rose 10.9% after allocation policy revisions, underscoring the sensitivity of overall costs to logistics inputs. Incremental cost-effectiveness analyses frequently exceed USD 100,000 per quality-adjusted life year, stretching reimbursement thresholds. Consumable kits and single-use cartridges add recurring cost layers that impede broad deployment in mid-tier centers.
Complex Multi-Jurisdictional Regulatory Clearances
The EU SoHO Regulation 2024/1938 introduces new standards while the United States maintains FDA pathways that can span 5,000-plus review days for innovative systems[1]Federal Register, “Determination of Regulatory Review Period for Purposes of Patent Extension; ORGAN CARE SYSTEM HEART,” federalregister.gov. Parallel compliance workstreams inflate development budgets and delay time-to-market, especially for small and mid-size vendors.
*Our forecasts treat driver/restraint impacts as directional, not additive. The impact forecasts reflect baseline growth, mix effects, and variable interactions.
Transplant Box Market Segment Analysis
By Organ Type:
Kidney Dominance Coupled with Lung-Segment MomentumKidney devices contributed 37.80% of the transplant box market in 2025, benefiting from both deceased and living donor programs. Wider acceptance of ABO-incompatible procedures and record 8,200 kidney transplants performed by a single network in 2024 demonstrate deep installed demand. Conversely, lung preservation shows the fastest 11.88% CAGR as ex-vivo perfusion revives marginal grafts, a development that could lift the transplant box market size for pulmonary applications by mid-decade. Heart, liver, and pancreas boxes continue steady uptake, and early-stage work in intestinal and vascular-composite preservation hints at future expansion vectors.
The second growth driver is the widening perimeter of acceptable donor-recipient travel times. Normothermic lung and heart solutions allow 6-20 hour windows without raising ischemia-reperfusion risks, letting clinicians consider intercontinental matches and thereby stimulating regional volume. As transplant registries diversify, organ-specific demand patterns will continue to recalibrate production and R&D allocations across vendors operating in the transplant box market.


By Preservation Technology:
Dynamic Platforms Lead Performance ShiftStatic cold storage still dominates with 53.85% share owing to simplicity and low price. Nonetheless, clinical data showing a 54% relative decline in four-year cardiac mortality with SherpaPak versus ice drives a decisive perception shift toward dynamic systems. Normothermic platforms post a 16.10% CAGR, propelled by hospital demand for real-time metabolic data and by reimbursement pilots rewarding improved outcomes. Hypothermic perfusion occupies a viable mid-price niche, particularly in liver and kidney procedures where oxygenated perfusion has shown 20-hour preservation capability.
Future technologies such as cryopreservation and vitrification remain at proof-of-concept stage due to toxicity challenges yet represent plausible long-term disruptors. Over the forecast window, however, iterative upgrades that blend closed-loop temperature control, IoT connectivity, and cloud analytics are expected to set the competitive standard in the transplant box market.
By End User:
Military Applications Drive Fastest GrowthHospitals and transplant centers commanded 65.05% of the transplant box market share in 2025, benefiting from mature surgical infrastructure and established reimbursement pathways. More than 20% of U.S. liver transplant centers have adopted advanced containers such as Paragonix’s LIVERguard, underscoring rising clinical confidence in dynamic preservation technology. The spread of donor-care units illustrates a parallel strategy shift; these specialized wards cut organ‐recovery costs by 51% while lifting yields 27.5%. Together, these developments reinforce hospitals as the core customer group even as budgets tighten.
Military and emergency medical services form the fastest-growing end-user category, set to expand at a 13.05% CAGR through 2031. Defense projects prioritize rugged, portable systems capable of sustaining organs alongside blood substitutes, exemplified by DARPA’s USD 46 million ErythroMer program. Field trials with TRV-150 drones show how autonomous delivery can integrate preservation hardware into forward logistics chains. Organ-procurement organizations and research institutes round out demand by validating new platforms and protocols, creating a feedback loop that migrates battlefield innovations into civilian practice and keeps procurement momentum high for the transplant box market.
Geography Analysis
North America Transplant Box Market
North America retains leadership with 37.20% of global revenue in 2025 owing to robust healthcare infrastructure and rigorous yet navigable regulatory pathways. The United States accounts for the majority of regional sales, supported by sustained double-digit revenue growth reported by leading vendors. Cross-border agreements with Canada and Mexico facilitate broader organ sharing and strengthen procurement logistics, thereby maintaining high device utilization.
Europe Transplant Box Market
Europe follows with sophisticated transplant networks and progressive regulations. The new SoHO rules harmonize technical standards, positioning the bloc for accelerated adoption of dynamic perfusion devices. Countries such as Germany, France, and Spain show notable investment in donor-care units, which increase yields and reduce total costs, thus enhancing device ROI.
APAC, MEA and South America Transplant Box Market
Asia-Pacific is the fastest-growing territory, recording a 10.42% CAGR through to 2031. China’s voluntary donation system, Japan’s coordinator certifications, and India’s record transplant volumes collectively generate an expanding customer base. Governments are also funding new transplant centers and procurement hubs, prerequisites for large-scale device deployment. South America, the Middle East, and Africa hold significant latent demand, but limited reimbursement and logistical challenges constrain immediate scale. Gradual infrastructure improvements are likely to unlock incremental opportunities over the second half of the forecast period, incrementally lifting overall transplant box market growth.

Regulatory Landscape
Transplant boxes and transportable perfusion systems sit at the intersection of organ-handling rules and medical device regulation. In the United States, systems used for organ flushing, transport, storage, and perfusion are regulated by the FDA under medical device pathways (including Class II categories such as isolated kidney perfusion and transport systems under 21 CFR 876.5880), while operational controls for organ packaging, labeling, and handling are also imposed on organ procurement organizations under 42 CFR 486.346. For higher-risk active perfusion platforms, FDA oversight can extend beyond 510(k) clearance into PMA and associated clinical evidence requirements, which affects time-to-market and the cadence of product iteration.
In Europe, products are governed primarily by EU Medical Device Regulation 2017/745 (MDR), requiring conformity to General Safety and Performance Requirements (GSPR), ISO 13485-aligned quality systems, and Notified Body certification for applicable classes (often Class IIb for transportable perfusion systems). In parallel, the EU SoHO Regulation 2024/1938 raises the bar on standardized practices around substances of human origin, shaping end-to-end handling expectations that manufacturers need to design for. In the UK, NHS Blood and Transplant procedures specify that organ transport boxes must be fit for purpose, maintain required preservation temperatures, and minimize contamination risk, commonly enforced through service level agreements with transport providers and tightening compliance needs for both device makers and logistics partners.
Competitive Landscape
The transplant box market is moderately concentrated. TransMedics leads normothermic perfusion with the Organ Care System, more than doubling revenue year-on-year in 2024 and targeting 10,000 annual procedures by 2028 transmedics.com. Getinge’s USD 477 million acquisition of Paragonix adds a diversified portfolio and global distribution muscle getinge.com. Bridge to Life builds a differentiated liver franchise through HOPE perfusion, while XVIVO guards its IP position with an expanding patent estate xvivogroup.com.
Emerging players focus on low-cost, sensor-rich devices tailored to developing markets and on AI-based allocation platforms that integrate seamlessly with perfusion boxes. Military partnerships introduce a parallel commercialization track, moving battlefield-ready prototypes toward civilian trauma and emergency deployment. Early-stage xenotransplantation trials may eventually recast demand fundamentals, yet over the current horizon they primarily reinforce the premium on preservation versatility.
Transplant Box Industry Leaders
Transmedics, Inc
Organ Recovery Systems Inc.
Institut Georges Lopez (IGL)
OrganOx Ltd.
Getinge (Paragonix Technologies, Inc.)
- *Disclaimer: Major Players sorted in no particular order
Transplant Box Market Companies Covered in this Report
- TransMedics Inc.
- Organ Recovery Systems
- Getinge (Paragonix Technologies, Inc.)
- Institut Georges Lopez (IGL)
- OrganOx Ltd.
- Xvivo Perfusion
- Bridge to Life Ltd.
- Hibernicor
- Northwestern Medicine
- Waters Medical Systems
- Preservation Solutions Inc.
- Ebers Medical Technology SL
- CryoLife
- Lifeline Scientific
- Medtronic
- W. L. Gore & Associates
- Terumo
- Shenzhen Lifotronic Technology Co.
- Avive Biomedical
- OCS Logistics LLC

Market Opportunities and Future Outlook
The most visible whitespace is in scaling dynamic preservation beyond early-adopter centers, particularly for lung and multi-organ pathways where extended transport windows and objective viability assessment change utilization economics. In July 2026, Traferox Technologies received FDA PMA for the TorEx Lung Perfusion System, adding another regulated EVLP option and supporting protocol standardization for normothermic platforms in pulmonary transplantation. In the same month, UCLA Health reported performing a lung transplant using the newest TransMedics OCS warm perfusion device with updated monitoring and fluid-management capabilities, reinforcing hospital pull for transport solutions that combine preservation with real-time organ-condition analytics.
A second opportunity area is logistics integration and digital traceability across the transport chain, as device performance increasingly depends on coordinated air and ground networks, temperature-control assurance, and data capture from retrieval through implant. TransMedics' actions to replicate its National OCS Program logistics model in Europe through investment in PAD Aviation service GmbH (announced April 2026 and completed July 2026) show active movement toward vertically integrated service-plus-device offerings that can reduce handoff risk. Alongside this, 2026 research validation work on intelligent organ transport architectures with active thermal management and biochemical monitoring, and clinical experience with phase change material-based cold-chain containers maintaining 2-8C without ice, point to near-term product differentiation paths for suppliers competing in both premium perfusion devices and advanced static cold storage boxes.
Recent Industry Developments in Transplant Box Market
- July 2026: TransMedics Group, Inc. completed a strategic investment in Germany-based PAD Aviation service GmbH to help build a dedicated European organ transplant air logistics network. The investment extends TransMedics National OCS Program-style logistics beyond the United States and strengthens control over time-critical transport for its Organ Care System deployments. It also increases competitive pressure on device-only vendors as service-enabled platforms gain procurement influence at transplant centers.
- March 2026: The French medicines regulator ANSM lifted the earlier suspension affecting Institut Georges Lopez (IGL) after remediation and compliance measures were completed. The decision reopened the pathway for normalized operations around affected product lines and restored continuity for customers relying on IGL-related preservation solutions. It also underscores how quality-system nonconformities can translate into supply disruption risk for transplant preservation workflows.
- March 2025: OrganOx signed a partnership with ProCure On-Demand to broaden organ recovery services coverage in the United States. The collaboration tied device-supported preservation approaches more closely to recovery and logistics execution, addressing operational bottlenecks that can limit throughput. It also reinforces the trend toward integrated offerings that combine preservation technology with coordinated recovery and transport capabilities.


Transplant Box Market Report Scope and Research Methodology
Market Definition and Coverage
For this study, the transplant box market covers revenue from purpose-built containers and systems used to transport and preserve transplant organs from retrieval to implantation. This includes passive temperature-controlled boxes and active systems that add monitoring during transport.
Scope exclusions: We exclude generic insulated coolers, stand-alone preservation solutions sold without a box or device, and third-party transport services such as courier, charter, or air ambulance.
Segments Covered in This Report
- By Organ Type
- Heart
- Liver
- Lung
- Kidney
- Pancreas
- Others
- By Preservation Technology
- Static Cold Storage Boxes
- Normothermic Machine Perfusion Devices
- Hypothermic Machine Perfusion Devices
- Others
- By End User
- Hospitals & Transplant Centers
- Organ Procurement Organisations (OPOs)
- Military & Emergency Medical Services
- Research Institutes
- Geography
- North America
- United States
- Canada
- Mexico
- Europe
- Germany
- United Kingdom
- France
- Italy
- Spain
- Rest of Europe
- Asia-Pacific
- China
- Japan
- India
- South Korea
- Australia
- Rest of Asia-Pacific
- Middle East and Africa
- GCC
- South Africa
- Rest of Middle East and Africa
- South America
- Brazil
- Argentina
- Rest of South America
- North America
Data Sources, Market Sizing, and Validation
Desk Research
Desk research was used to set the market boundaries and to build the first pass of demand and price assumptions. We mainly leaned on public transplant activity and donation indicators, along with device regulation signals, because these help explain how many preservation and transport events can occur in a year.
Typical sources reviewed include national transplant activity dashboards and annual reports (for example, from organ-sharing networks), World Health Organization health statistics, US FDA device databases for cleared organ transport and perfusion systems, peer-reviewed transplant journals for preservation time windows and adoption trends, and customs or trade statistics where available for medical devices. We also reviewed company filings and investor presentations, plus reputable news coverage, and we used a paid subscription for company financials and news screening to cross-check revenue exposure and timing. These sources are illustrative, and we used additional public references to collect data, validate assumptions, and clarify gaps.
Primary Interviews and Surveys
Primary work focused on clarifying what is actually purchased with a transplant box, including one-time devices, reusable containers, disposable sets, sensors, and any service bundle elements, and how pricing changes by organ type and geography. We spoke with stakeholders across hospitals and transplant centers, organ procurement organizations, distributors, and manufacturing-side roles, then used follow-ups to confirm adoption rates for active systems versus passive containers and typical replacement cycles.
Distribution of primary research fieldwork respondents
| Company type | Respondent position | Region |
|---|---|---|
| Top tier: 29% | CXOs: 12% | APAC: 39% |
| Mid tier: 50% | Functional/Unit leaders: 36% | EMEA: 36% |
| Smaller Players: 21% | Managers: 52% | Americas: 25% |
Market-Sizing & Forecasting
Sizing starts with a top-down reconstruction of the annual transplant logistics demand pool. Transplant procedure volumes and organ retrieval activity are translated into expected preservation and transport events by organ type and region. Those events are then mapped to the mix of passive containers versus active perfusion systems and to the typical commercial model (capital device plus reusable box and any recurring consumables where applicable), which is where revenue is formed.
To keep the model grounded, we used practical inputs such as transplant procedure counts, organ procurement and shipment patterns, average container or system utilization per year, replacement and refurbishment cycles, and average selling prices by system type, including consumable attach rates for active systems. When supplier-level data was incomplete, we used channel checks and sampled ASP times volume builds to form selective bottom-up approximations, which were then used to confirm direction and adjust totals rather than to fully build the market from scratch.
For forecasting, scenario analysis was applied so growth can flex with transplant activity growth, adoption curves for active preservation, and pricing movement for disposables. We then sanity-checked the output against expert expectations gathered in interviews. Where data points varied by country, we applied regional proxies first, and narrowed assumptions through follow-up calls until they matched real procurement behavior.
Data Validation & Update Cycle
Outputs were checked using several passes, starting with internal consistency tests across volumes, utilization, and implied revenue per transplant event. We also compared results with independent signals such as transplant activity growth, device clearance and adoption commentary, and publicly visible expansion moves to flag unusual jumps before sign-off.
If a variance could not be explained by a documented driver, the assumptions were revisited and relevant interviewees were re-contacted to confirm the practical range. Reports are refreshed annually, with interim updates when a material event changes pricing, availability, or adoption, and a final pre-delivery review is completed so clients receive the latest updated view.
Mordor Intelligence's Transplant Box Market Size Versus Other Published Estimates
It is normal to see different market values for transplant boxes. Publishers can apply different product boundaries, and they also handle pricing and currency timing in their own way. Differences can also come from whether recurring consumables and bundled service elements are included, and from how quickly assumptions are refreshed when adoption shifts.
In our checks, the biggest spread typically traces back to whether monitoring-enabled active perfusion systems are counted alongside passive boxes, and whether revenue is modeled as device-only or as a device plus disposable set stream tied to usage. The refresh cadence matters too, because exchange rates, list price updates, and hospital purchasing cycles change realized ASP in a given year, which is why the model is re-validated and re-priced close to publication in Mordor Intelligence.
Benchmark comparison
| Source | Market Size | Gaps in Research Methodology |
|---|---|---|
| Mordor Intelligence | USD 193.25 M (2026) | |
| Industry Data Publisher A | USD 163.60 M (2024) | Uses an earlier base year and can reflect pre-refresh pricing and currency conversion, and it is not always clear if monitoring-enabled active systems are consistently included across regions. |
| Regional Research Group B | USD 171.50 M (2024) | Appears to narrow the counted revenue to passive coolers and limited accessories, and it may not fully account for consumable attach rates and utilization-driven revenue in active preservation setups. |
Overall, the comparison shows that the largest gaps are created by scope edges (active systems and recurring disposables) and by how prices are updated to the latest procurement reality. By tying revenue to transplant event volumes and then pressure-testing the implied price per event, the final number remains traceable to clear inputs that a buyer can re-check.


Key Questions Answered in the Report
What is the current size of the transplant box market in 2026?
The transplant box market stands at USD 193.25 million in 2026.
How fast will the transplant box market grow by 2031?
Revenue is projected to reach USD 279.27 million by 2031, reflecting a 7.65% CAGR.
Which organ segment leads demand for transplant boxes?
Kidney preservation systems hold the largest 37.80% share because kidneys remain the most transplanted solid organ.
What technology trend is reshaping the transplant box industry?
Portable normothermic perfusion devices are displacing static ice boxes, registering a 16.10% CAGR on superior clinical outcomes.
Which region offers the highest growth opportunity?
Asia-Pacific is forecast to grow at a 10.42% CAGR, propelled by expanding donor programs and new transplant centers.
Page last updated on:


 Your data is secure and never sold or shared.


