
Transformer Oil Market Size and Share
Market Overview
| Study Period | 2021 - 2031 |
|---|---|
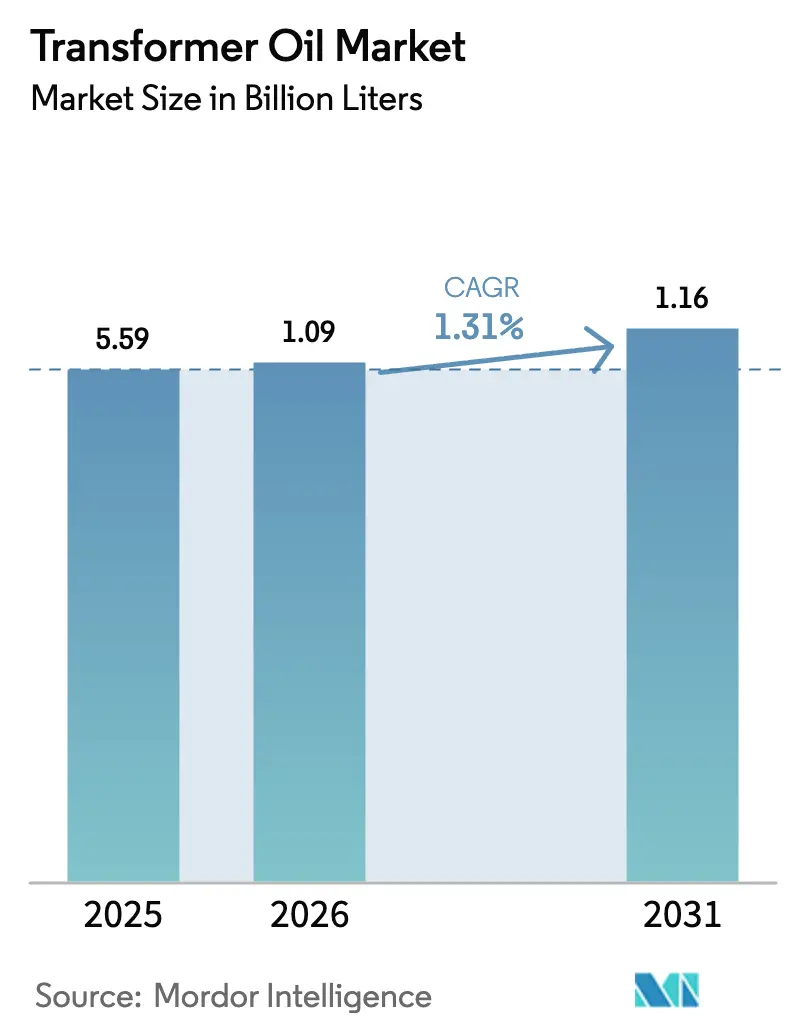
| Market Volume (2026) | 1.09 Billion liters |
| Market Volume (2031) | 1.16 Billion liters |
| Growth Rate (2026 - 2031) | 1.31 % |
| Fastest Growing Market | Asia Pacific |
| Largest Market | Asia Pacific |
| Market Concentration | Medium |
Major Players *Disclaimer: Major Players sorted in no particular order Image © Mordor Intelligence. Reuse requires attribution under CC BY 4.0. | |
Transformer Oil Market Analysis by Mordor Intelligence
The Transformer Oil Market size is expected to grow from 5.59 Billion liters in 2025 to 1.09 Billion liters in 2026 and is forecast to reach 1.16 Billion liters by 2031 at 1.31% CAGR over 2026-2031. Grid-reinforcement programs in Asia–Pacific, mandated replacement of aging units in the United States and Europe, and the rise of offshore-wind converter platforms are sustaining steady, volume-driven growth. Mineral-based formulations still dominate global demand, yet their cost advantage is narrowing as Group-I base-oil supplies tighten and disposal liabilities escalate. Bio-based esters, supported by fire-safety codes and biodegradability rules, are gaining traction in urban substations, data centers, and environmentally sensitive zones. Competitive dynamics hinge on supply-chain resilience, portfolio breadth, and the ability to offer lifecycle-cost models rather than commodity pricing.
Key Report Takeaways
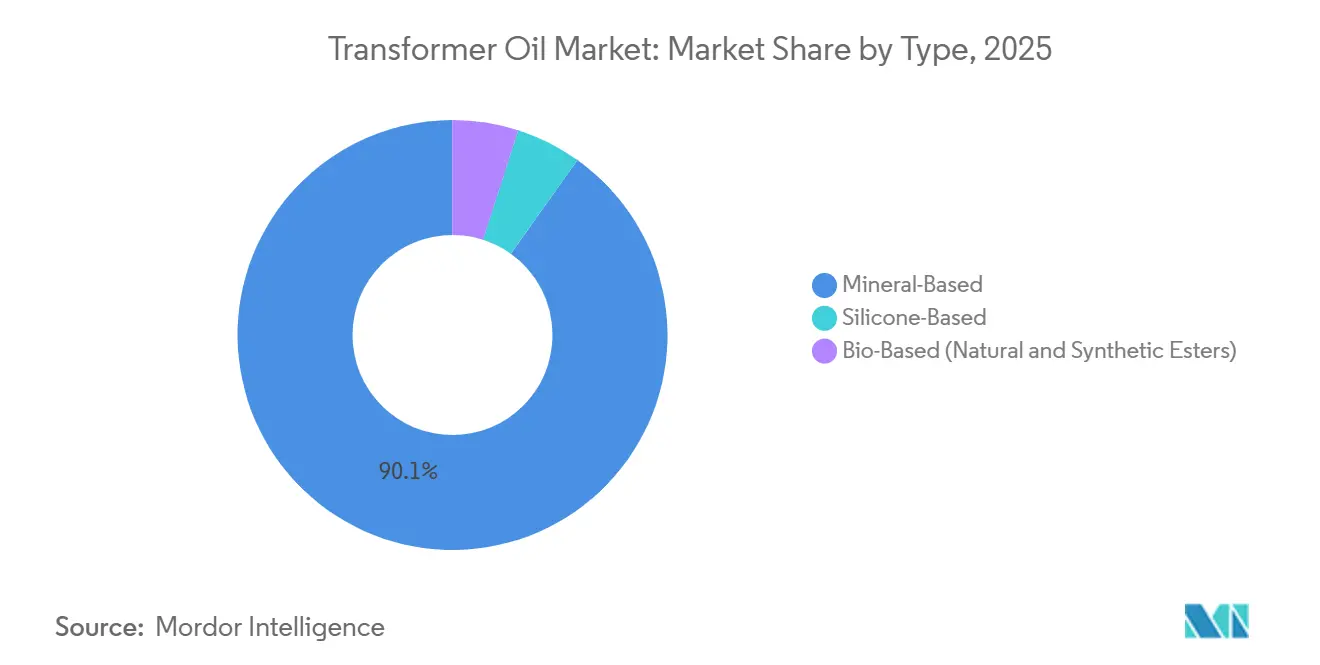
- By type, mineral-based held the largest share of 90.12% in 2025, whereas bio-based esters are expected to grow at a CAGR of 7.92% during the forecast period (2026-2031).
- By application, transformers held the largest market share of 73.83% in 2025 and are expected to grow at a CAGR of 1.86% during the forecast period (2026-2031).
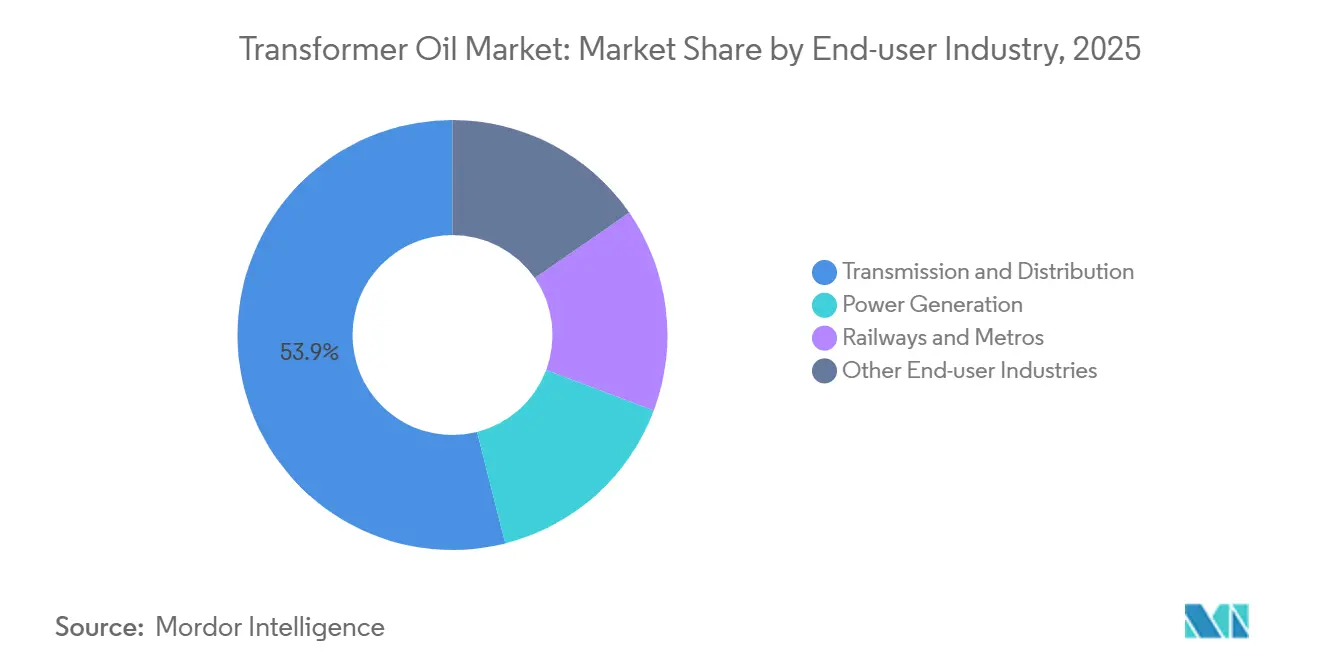
- By end-user industry, transmission and distribution held the market share of 53.94% in 2025 and are expected to grow at a CAGR of 1.75% during the forecast period (2026-2031).
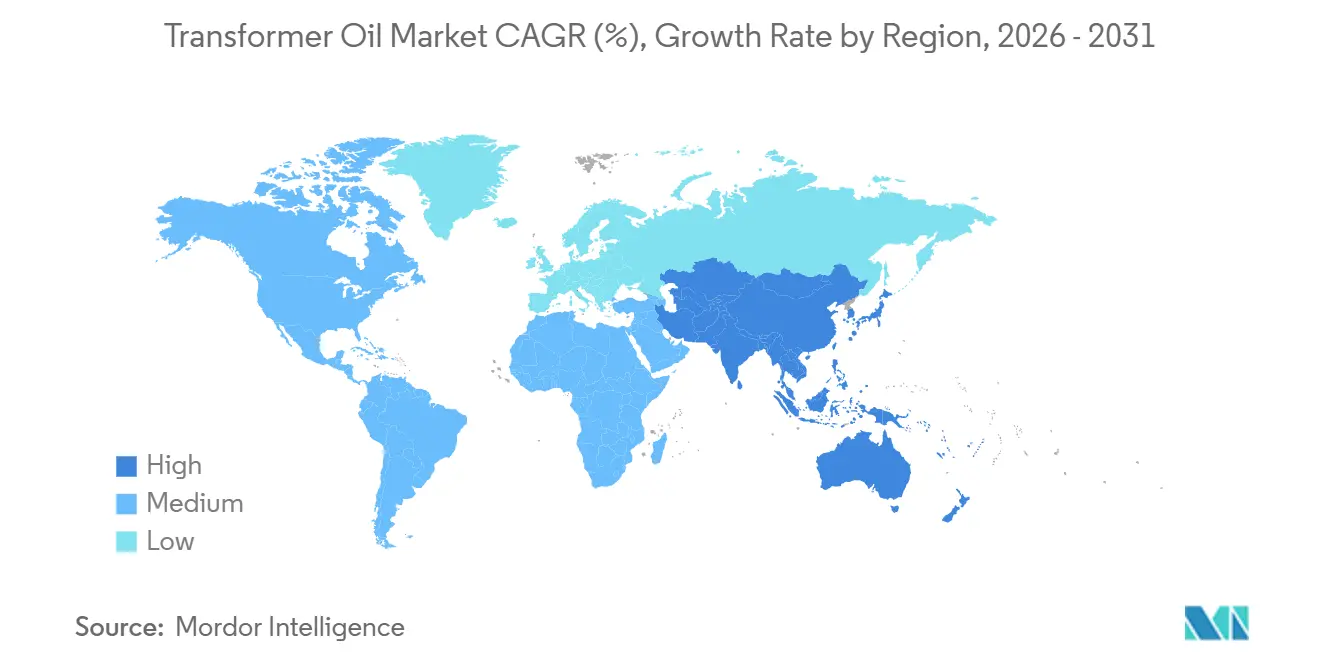
- By geography, the Asia-Pacific region had the largest share of 47.77% in 2025, and this share is expected to grow at the fastest CAGR of 1.82% during the forecast period (2026-2031).
Note: Market size and forecast figures in this report are generated using Mordor Intelligence’s proprietary estimation framework, updated with the latest available data and insights as of January 2026.
Market Trends and Insights
Drivers Impact Analysis of Transformer Oil Market*
| Driver | (~) % Impact on CAGR Forecast | Geographic Relevance | Impact Timeline |
|---|---|---|---|
| Growing electric grids in Asia-Pacific | +0.6% | Asia-Pacific core, spillover to Middle East & Africa | Medium term (2-4 years) |
| Upgradation of aging transformers in OECD markets | +0.4% | North America & Europe | Long term (≥4 years) |
| DOE-mandated efficiency standards for distribution transformers | +0.3% | United States, with influence on Canada and Mexico | Short term (≤2 years) |
| Offshore-wind converter platforms demanding high-flash-point oils | +0.2% | Europe (North Sea), United States (East Coast), Asia (Taiwan Strait) | Medium term (2-4 years) |
| Utility-scale battery storage build-out | +0.2% | Global, with early concentration in California, Texas, Australia | Medium term (2-4 years) |
| Source: Mordor Intelligence | |||
Growing Electric Grids in Asia-Pacific
Asia-Pacific utilities are building redundancy into networks, driving step-change transformer oil demand. China’s State Grid invested USD 89 billion in 2025 to extend ultra-high-voltage corridors, and each 1,000 kV unit requires 10,000 to 20,000 liters of oil[1]. India has earmarked Rs 9.16 trillion (USD 109 billion) for 1,274 GVA of new transformation capacity by 2032. ASEAN projects will add up to 13,780 MW of cross-border links that rely on synthetic-ester or silicone fluids resilient to tropical humidity. Investment is driven less by electrification and more by network reliability, creating a stable base for the transformer oil market.
Upgradation of Aging Transformers in OECD Markets
North American and European utilities are confronting end-of-life fleets installed during the 1970s-1980s. US lead times have lengthened to 24 months for replacement units, partly due to shortages of electrical steel. Europe anticipates 34,000 tonnes of annual oil demand by 2030 as 400/100 kV substations are modernized to integrate offshore wind. Australia is retrofitting rural assets with fire-resistant esters at insurers’ insistence. Replacement schedules remain uneven; Japan and South Korea are delaying upgrades for budgetary reasons, preserving long-tail mineral demand.
DOE-Mandated Efficiency Standards for Distribution Transformers
The 2024 U.S. rule obliges manufacturers to adopt amorphous-metal cores that increase oil volume per unit by up to 15%. Compliance costs of USD 300 to 500 per transformer weigh most on small cooperatives. Canada and Mexico are aligning designs to avoid cross-border supply-chain friction. OEMs and oil producers are co-engineering antioxidant packages capable of withstanding higher core temperatures without sludge formation. Near-term US procurement is, therefore, a demand accelerator for the transformer oil market.
Offshore-Wind Converter Platforms Demanding High-Flash-Point Oils
Europe’s offshore wind fleet reached 30 GW in 2025, each gigawatt requiring up to 300 tonnes of oil across converter stations[2]. US Atlantic leases total 8 GW with first projects due in 2027. Synthetic esters dominate because they meet K-class fire ratings and marine environmental standards. Taiwan aims for 15 GW by 2035, spurring local blending of high-flash-point fluids. Suppliers able to certify formulations to IEC 61039 gain premium pricing and long-term contracts.
Restraints Impact Analysis of Transformer Oil Market*
| Restraint | (~) % Impact on CAGR Forecast | Geographic Relevance | Impact Timeline |
|---|---|---|---|
| Tight Group-I base-oil supply after European refinery closures | -0.2% | Europe, with spillover to North America and Asia-Pacific | Short term (≤2 years) |
| Mineral-oil environmental liabilities and disposal costs | -0.1% | North America & Europe, with emerging pressure in Asia-Pacific | Long term (≥4 years) |
| Ester-fluid price premium in cost-sensitive Asia-Pacific utilities | -0.1% | Asia-Pacific, particularly India, Indonesia, Vietnam | Medium term (2-4 years) |
| Source: Mordor Intelligence | |||
Tight Group-I Base-Oil Supply After European Refinery Closures
European shutdowns have removed 2 million tonnes of Group-I capacity since 2024, forcing blenders to import higher-priced feedstock. Freight premiums of 15-20% and six-month delivery lags undermine pricing visibility. North American formulators are migrating to Group-II base oils, necessitating reformulation to match dielectric performance. Asian suppliers in South Korea and Singapore are scaling exports, but their logistics chains add cost and quality variability. Supply tightness, therefore, subtracts about 0.2 percentage points from the transformer oil market CAGR.
Mineral-Oil Environmental Liabilities and Disposal Costs
The U.S. EPA classifies oil containing >50 ppm PCBs as hazardous, raising disposal costs to USD 1,500-3,000 per tonne. European insurers are lifting premiums for mineral-filled urban substations. Utilities, internalizing these liabilities, now apply lifecycle cost models that favor biodegradable esters despite a 20-30% price premium. China and India are drafting soil-contamination rules that mirror Western standards, signaling wider adoption of bio-based fluids. Long-term compliance pressure erodes mineral-oil demand in mature grids and shapes future transformer oil market dynamics.
*Our forecasts treat driver/restraint impacts as directional, not additive. The impact forecasts reflect baseline growth, mix effects, and variable interactions.
Transformer Oil Market Segment Analysis
By Type:
Bio-Based Esters Gain Ground on Fire SafetyMineral-based products accounted for 90.12% of the 2025 volume, reflecting entrenched procurement habits and lower unit cost. Bio-based esters are advancing at a 7.92% CAGR to 2031, anchored in K-class fire-safety performance and rapid biodegradability. Natural esters find favor in data centers and hospitals where fire risks and environmental liabilities are highest. Synthetic esters, engineered from polyol bases, outperform under high thermal cycling, making them the preferred choice for offshore wind platforms and rail traction transformers. The transformer oil market size for bio-based esters is therefore expanding faster than the legacy mineral segment.
Europe specifies natural esters in roughly one-third of new installations, spurred by insurer incentives and carbon-disclosure mandates. North American adoption remains at 15-20% as utilities validate long-term performance. Asia–Pacific remains price-driven, yet China’s draft law requiring biodegradable fluids near water bodies could shift 10-15% of its installed base to esters by 2030. Silicone oils occupy a niche for temperatures above 200°C, notable in furnace transformers, but face cost hurdles. Collectively, these trends reshape the product mix within the transformer oil market.

By Application:
Transformers Dominate Amid Grid ModernizationTransformers consumed 73.83% of global volume in 2025 and are forecast to expand at a 1.86% CAGR, supported by US efficiency rules and Asia’s ultra-high-voltage projects. Distribution units, operating at 11-33 kV, anchor replacement demand in OECD grids. Power transformers above 132 kV drive greenfield volumes in China and India, where single units can require up to 20,000 liters of fluid. The transformer oil market size for these high-rating assets is therefore rising in tandem with renewable integration targets.
Switchgear accounts for 12-15% of demand, growing with substation automation. Circuit breakers and capacitors together make up under 10%, but an increasing share shifts to synthetic esters for extended service life. Niche uses, including reactors and voltage regulators, round out the balance. Every kilowatt of electricity passes through at least one transformer, making this application an enduring pillar of the transformer oil market.
By End-User Industry:
Transmission and Distribution Lead InvestmentTransmission and distribution utilities absorbed 53.94% of 2025 volume and are projected to grow at a 5.75% CAGR through 2031 on the back of multi-billion-dollar grid programs in China, India, and the United States. Power generation sites are led by coal retrofits in India and renewable-plant step-ups worldwide. Railways and metros are also growing as electrified corridors expand across Asia and Europe. The transformer oil market size linked to rail projects rises in line with rolling-stock electrification.
Other industrial end-users, including mining and data centers, account for the residual share, with project-specific specifications dictating fluid choice. The strategic importance of uninterrupted supply in transmission grids ensures that transformer oil procurement remains a non-discretionary expense, buffering the market from short-term economic cycles.
Geography Analysis
APAC Transformer Oil Market
Asia–Pacific held 47.77% of global volume in 2025 and is expected to grow at 1.82% annually to 2031. China’s USD 89 billion grid program and India’s USD 109 billion transmission plan underpin the region’s leadership. ASEAN interconnection projects call for high-performance esters able to operate in humid, salt-spray environments. Mature markets such as Japan and South Korea generate steady replacement demand for higher-efficiency units.
North America Transformer Oil Market
North America contributed just over some of the 2025 volume. US DOE rules, offshore-wind investments, and 12 GW of new battery storage underpin growth. Canada’s export-oriented transmission upgrades and Mexico’s substation modernizations add incremental demand.
Europe Transformer Oil Market
Europe’s market share is driven by 30 GW of offshore wind and urban-substation retrofits that specify fire-resistant fluids. Replacement of 400/100 kV transformers adds 34,000 tonnes of annual oil demand by 2030.
MEA and South America Transformer Oil Market
South America and the Middle East & Africa together represent a significantly lower market share. Brazil is extending transmission lines into the Amazon to integrate hydro assets, while Saudi Arabia’s Vision 2030 allocates USD 50 billion for grid upgrades. South Africa and Nigeria focus on urban reliability and rural electrification respectively, favoring lower-cost mineral oils but gradually trialing esters in donor-funded projects.
Regulatory Landscape
Transformer oils are shaped by performance standards and environmental rules that increasingly affect fluid selection, maintenance, and end-of-life handling. Key technical baselines include IEC 60296:2020 for mineral insulating oils, IEC 62770:2024 for unused natural esters, and ASTM D3487 (latest 2025 revision) for mineral insulating liquids used in electrical apparatus, alongside OEM and utility qualification requirements.
China tightened its standards framework in 2026 through State Administration for Market Regulation (SAMR) implementation of GB/T 46134-2025 (effective March 1, 2026), covering maintenance and use guidance for natural esters in electrical equipment, and GB 2536-2025 (effective July 1, 2026) for unused mineral insulating oils for transformers and switchgear, replacing the 2011 edition. In Europe, the Council of the European Union adoption of a revised Water Framework Directive in February 2026 added PFAS-related environmental quality standards, which increases practical focus on substation drainage and contamination monitoring near electrical assets and lifts the operational value of biodegradable and fire-safe fluid options in sensitive locations.
Value Chain Analysis
The value chain runs from feedstock sourcing (naphthenic crudes and refined base oils) to dielectric-fluid formulation, blending and quality assurance, distribution, and downstream qualification and lifecycle services. Transformer OEMs and utilities typically require extensive testing and approval before an insulating liquid is added to approved vendor lists, with qualification cycles commonly spanning 12 to 24 months. That timing increases switching costs and tends to favor suppliers with established test data, references, and lab support.
Recent supply-chain actions show a shift toward regionalized capacity and portfolio expansion. In March 2026, Cargill opened a new FR3 natural ester production plant in Gouda, the Netherlands, aimed at increasing regional availability of bio-based dielectric fluid. In June 2026, Apar Industries signed a strategic supply agreement with Saudi Aramco Base Oil Company (Luberef) at the Yanbu Lubehub Value Park to secure base oils and localize specialty oil manufacturing in Saudi Arabia. The broader consolidation trend also supports tighter ownership of specialty dielectric brands and technical documentation, as Eastman Chemical acquired Arkema France's Jarylec dielectric fluids business in June 2026.
Competitive Landscape
The transformer oil market is moderately consolidated. The balance is fragmented among small blenders serving niche or geographically isolated markets. Innovation centers on bio-based formulations; Cargill’s FR3 natural ester now competes head-to-head on cost in select markets after securing K-class approvals. Strategic moves include TotalEnergies partnering with Siemens Energy on synthetic esters for offshore converters and ExxonMobil launching Mobil Transformer Oil 500E for rail traction.
Transformer Oil Industry Leaders
-
Shell plc
-
NYNAS AB
-
China Petrochemical Corporation
-
CNPC
-
Ergon, Inc.
- *Disclaimer: Major Players sorted in no particular order

Transformer Oil Market Companies Covered in this Report
- APAR Industries Ltd.
- Calumet, Inc.
- Cargill, Incorporated
- Chevron Corporation
- China Petrochemical Corporation
- Ergon, Inc.
- Exxon Mobil Corporation
- Gulf Oil International Ltd
- Lukoil
- NYNAS AB
- Petro‐Canada Lubricants Inc.
- Phillips 66 Company
- Raj Petro
- Repsol
- San Joaquin Refining Co. Inc.
- Saudi Arabian Oil Co.
- SAVITA OIL TECHNOLOGIES LIMITED
- Shell plc
- TotalEnergies
Market Opportunities and Future Outlook
Bio-based ester penetration continues to create whitespace where fire safety and environmental constraints are most restrictive, including urban substations, coastal and offshore assets, and sensitive water or soil zones. Standards and national guidance are building operational confidence for ester adoption, supported by IEC 62770:2024 for natural esters and China SAMR implementation of GB/T 46134-2025 in March 2026, which formalizes maintenance and usage practices for natural esters in electrical equipment.
Capacity and localization moves provide tangible pathways for suppliers to convert that whitespace into regional volumes. Cargill expanded European FR3 supply by opening a new production plant in Gouda in March 2026, while Savita Oil Technologies commissioned Phase 2 of its synthetic ester manufacturing plant at Mahad, Maharashtra in March 2026 to support local availability for cost-sensitive buyers. Utility pilots are also translating specifications into field demand, including Karnataka Power Transmission Corporation Limited (KPTCL) starting a June 2026 pilot to replace mineral oil with natural ester oil in 45 high-voltage transformers. OEM capacity investments further lift the installed base that needs qualified dielectric fluids and after-fill service support, including Hitachi Energy breaking ground on a USD 457 million expansion in South Boston, Virginia in June 2026 alongside an approximately INR 2,000 crore large power transformer factory investment in Vadodara, India (announced June 2026).
Recent Industry Developments in Transformer Oil Market
- June 2026: Shell plc launched the Shell MIDEL brand worldwide within its transformer liquids portfolio, integrating the MIDEL and MIVOLT assets acquired from M&I Materials. The launch expands Shell's reach in ester-based transformer fluids where fire safety and environmental performance influence specifications.
- November 2025: KONCAR's 630 kVA distribution transformer in Zagreb was filled with NYTRO BIO 300X, a bio-based transformer fluid from Nynas AB, marking the first use of this fully renewable insulating liquid. The project, delivered with KONCAR - D&ST and HEP ODS, provides a utility-grade reference point for bio-based fluids in distribution assets.
- January 2024: Shell plc completed the acquisition of MIDEL and MIVOLT from UK-based M&I Materials Ltd, adding ester-based transformer fluids to its lubricants portfolio. This acquisition strengthened Shell's product breadth beyond mineral-based oils and positioned it for higher-specification transformer liquid tenders tied to fire-safety and sustainability requirements.
Transformer Oil Market Report Scope and Research Methodology
Market Definition and Coverage
The transformer oil market is defined as the annual demand value of liquid insulating and cooling fluids used inside oil-filled electrical equipment, mainly power and distribution transformers, and selected oil-filled switchgear where dielectric fluid is required.
Scope exclusions: Excludes dry-type transformers and other equipment that uses solid, air, or gas insulation instead of insulating oils.
Segments Covered in This Report
- By Type
- Mineral-Based
- Silicone-Based
- Bio-Based (Natural and Synthetic Esters)
- By Application
- Transformer
- Switchgear
- Circuit Breakers
- Capacitors
- Other Applications (reactor, etc.)
- By End-User Industry
- Power Generation
- Transmission and Distribution
- Railways and Metros
- Other End-user Industries
- By Geography
- Asia-Pacific
- China
- India
- Japan
- South Korea
- Indonesia
- Malaysia
- Thailand
- Vietnam
- Rest of Asia-Pacific
- North America
- United States
- Canada
- Mexico
- Europe
- Germany
- United Kingdom
- France
- Italy
- Spain
- Nordic Countries
- Russia
- Turkey
- Rest of Europe
- South America
- Brazil
- Argentina
- Rest of South America
- Middle-East and Africa
- Saudi Arabia
- United Arab Emirates
- Qatar
- South Africa
- Nigeria
- Egypt
- Rest of Middle-East and Africa
- Asia-Pacific
Data Sources, Market Sizing, and Validation
Desk Research
Desk research was used to map how transformer oil demand forms across grid expansion, replacement cycles, and the shift toward safer fluids. We reviewed public energy and grid statistics, trade flows, and technical standards to keep the model grounded in measurable signals rather than only company commentary.
Common public sources we referred to include, for example, the International Energy Agency (IEA), the US Energy Information Administration (EIA), Eurostat, UN Comtrade, and standards bodies such as IEC and IEEE for definitions tied to insulating liquids. We also used annual reports, investor presentations, and credible press coverage for capacity additions, plant utilization cues, and product mix direction, then cross-checked specific points with paid subscriptions for company financials and intelligence, plus shipment-level import and export data. These sources are not exhaustive, and other public documents were also used for data collection, validation, and research clarification.
Primary Interviews and Surveys
Primary work focused on validating what is actually consumed in service, not just what is produced, because replacement and top-up volumes can move differently by region and transformer fleet age. We spoke with oil producers, distributors, utilities, transformer service firms, and equipment-focused engineers across major demand regions to confirm pricing logic, the pace of ester adoption, and how procurement is split between new builds and maintenance.
Distribution of primary research fieldwork respondents
| Company type | Respondent position | Region |
|---|---|---|
| Top tier: 37% | CXOs: 13% | APAC: 46% |
| Mid tier: 46% | Functional/Unit leaders: 31% | EMEA: 33% |
| Smaller Players: 17% | Managers: 56% | Americas: 21% |
Market-Sizing & Forecasting
Sizing starts with a top-down build where transformer fleet additions and replacements are translated into oil demand using typical fill volumes, drain and refill practices, and average service intervals by equipment class. Once that demand pool is built by region, it is converted to value using a simple but defensible price ladder that reflects oil type mix and regional differentials.
To keep the totals realistic, we corroborated the result with selective bottom-up checks, mainly supplier revenue context, channel conversations, and sampled ASP times volume tests by oil type. Key inputs used in the model include new transformer commissioning activity, grid refurbishment and replacement timing, ester and silicone penetration (especially in fire-safety locations), average oil fill volume per transformer class, and observed price movements tied to base oil and additive costs. Where direct observations were thin, gaps were handled by using conservative ranges that were then narrowed through interviews and cross-region comparisons.
For forecasting, scenario analysis was used because demand is shaped by grid capex cycles, refurbishment timing, and policy-driven adoption of natural ester fluids, which do not move in a straight line. The scenarios were anchored to consensus views from interviewees on replacement rates, the pace of renewable integration, and practical constraints such as service capacity and lead times, then averaged into a central case.
Data Validation & Update Cycle
Validation is handled through a set of cross-checks before final numbers are signed off. We compare modeled demand with independent signals such as trade flows, announced grid projects, and regional transformer activity indicators, and then investigate outliers that do not reconcile with those signals.
If large variances appear, assumptions are revisited, and targeted re-contacts are triggered with the most relevant respondents, for example service contractors when refill cycles look off, or distributors when price ladders do not match market reality. Reports are refreshed annually, and interim updates are made when material events occur, such as sharp feedstock price shifts or policy changes affecting ester adoption. Before delivery, an analyst completes a final pass so clients receive the most current view available.
Mordor Intelligence's Transformer Oil Market Size Measured Against Other Published Estimates
Published market values for transformer oil often differ because some studies size physical consumption in liters, while others report only revenue, and the switch from mineral oil to ester-based fluids changes the average price per liter over time. Differences also come from whether in-service maintenance demand is counted, since refills and retrofills can be meaningful in regions with older transformer fleets.
The main gap drivers usually sit in scope and conversion steps, such as whether switchgear and capacitor insulating fluids are included, how ester pricing is escalated versus mineral oil, and whether currency timing is averaged across the year or taken at a point in time. When the market is tracked through liters first and then translated into dollars using region-specific price ladders that are refreshed with channel checks, the spread narrows, which is the approach used here and applied by Mordor Intelligence.
Benchmark comparison
| Source | Market Size | Gaps in Research Methodology |
|---|---|---|
| Mordor Intelligence | USD 3.03 B (2024) | |
| Trade Journal A | USD 2.52 B (2025) | Uses a broad average price and treats bio-based oil as a small add-on, which can understate value when ester adoption is rising in safety-critical installations. |
| Industry Brief B | USD 2.25 B (2025) | Focuses on new transformer production demand and does not fully account for maintenance-driven drain, refill, and top-up volumes, which can shift the total in mature grids. |
Taken together, the differences largely come from price conversion choices and whether ongoing service consumption is included. By tying the size to a clear demand pool and then validating the value conversion with interview-led price checks, the final figure stays traceable to inputs that can be re-tested as market conditions change.
Key Questions Answered in the Report
How large is the transformer oil market in 2026?
The transformer oil market size reached 1.09 billion liters in 2026 and is set to grow at a 1.31% CAGR to 2031.
Which product type is growing the fastest?
Bio-based esters are growing at a 7.92% CAGR, driven by fire-safety and biodegradability mandates.
Why are utilities shifting toward ester-based fluids?
Utilities face rising environmental liabilities and insurance premiums on mineral oils, making esters more attractive over the lifecycle despite higher upfront cost.
Which region contributes the most volume?
Asia–Pacific accounts for 47.77% of global volume in 2025, propelled by large-scale grid investments in China, India, and ASEAN countries.
How will U.S. efficiency rules affect demand?
The 2024 DOE standards increase oil volume per distribution transformer by up to 15%, boosting near-term demand in North America.