
Transdermal Skin Patches Market Size and Share
Market Overview
| Study Period | 2020 - 2031 |
|---|---|
| Market Size (2026) | USD 9.80 Billion |
| Market Size (2031) | USD 12.40 Billion |
| Growth Rate (2026 - 2031) | 4.82 % |
| Fastest Growing Market | Asia-Pacific |
| Largest Market | North America |
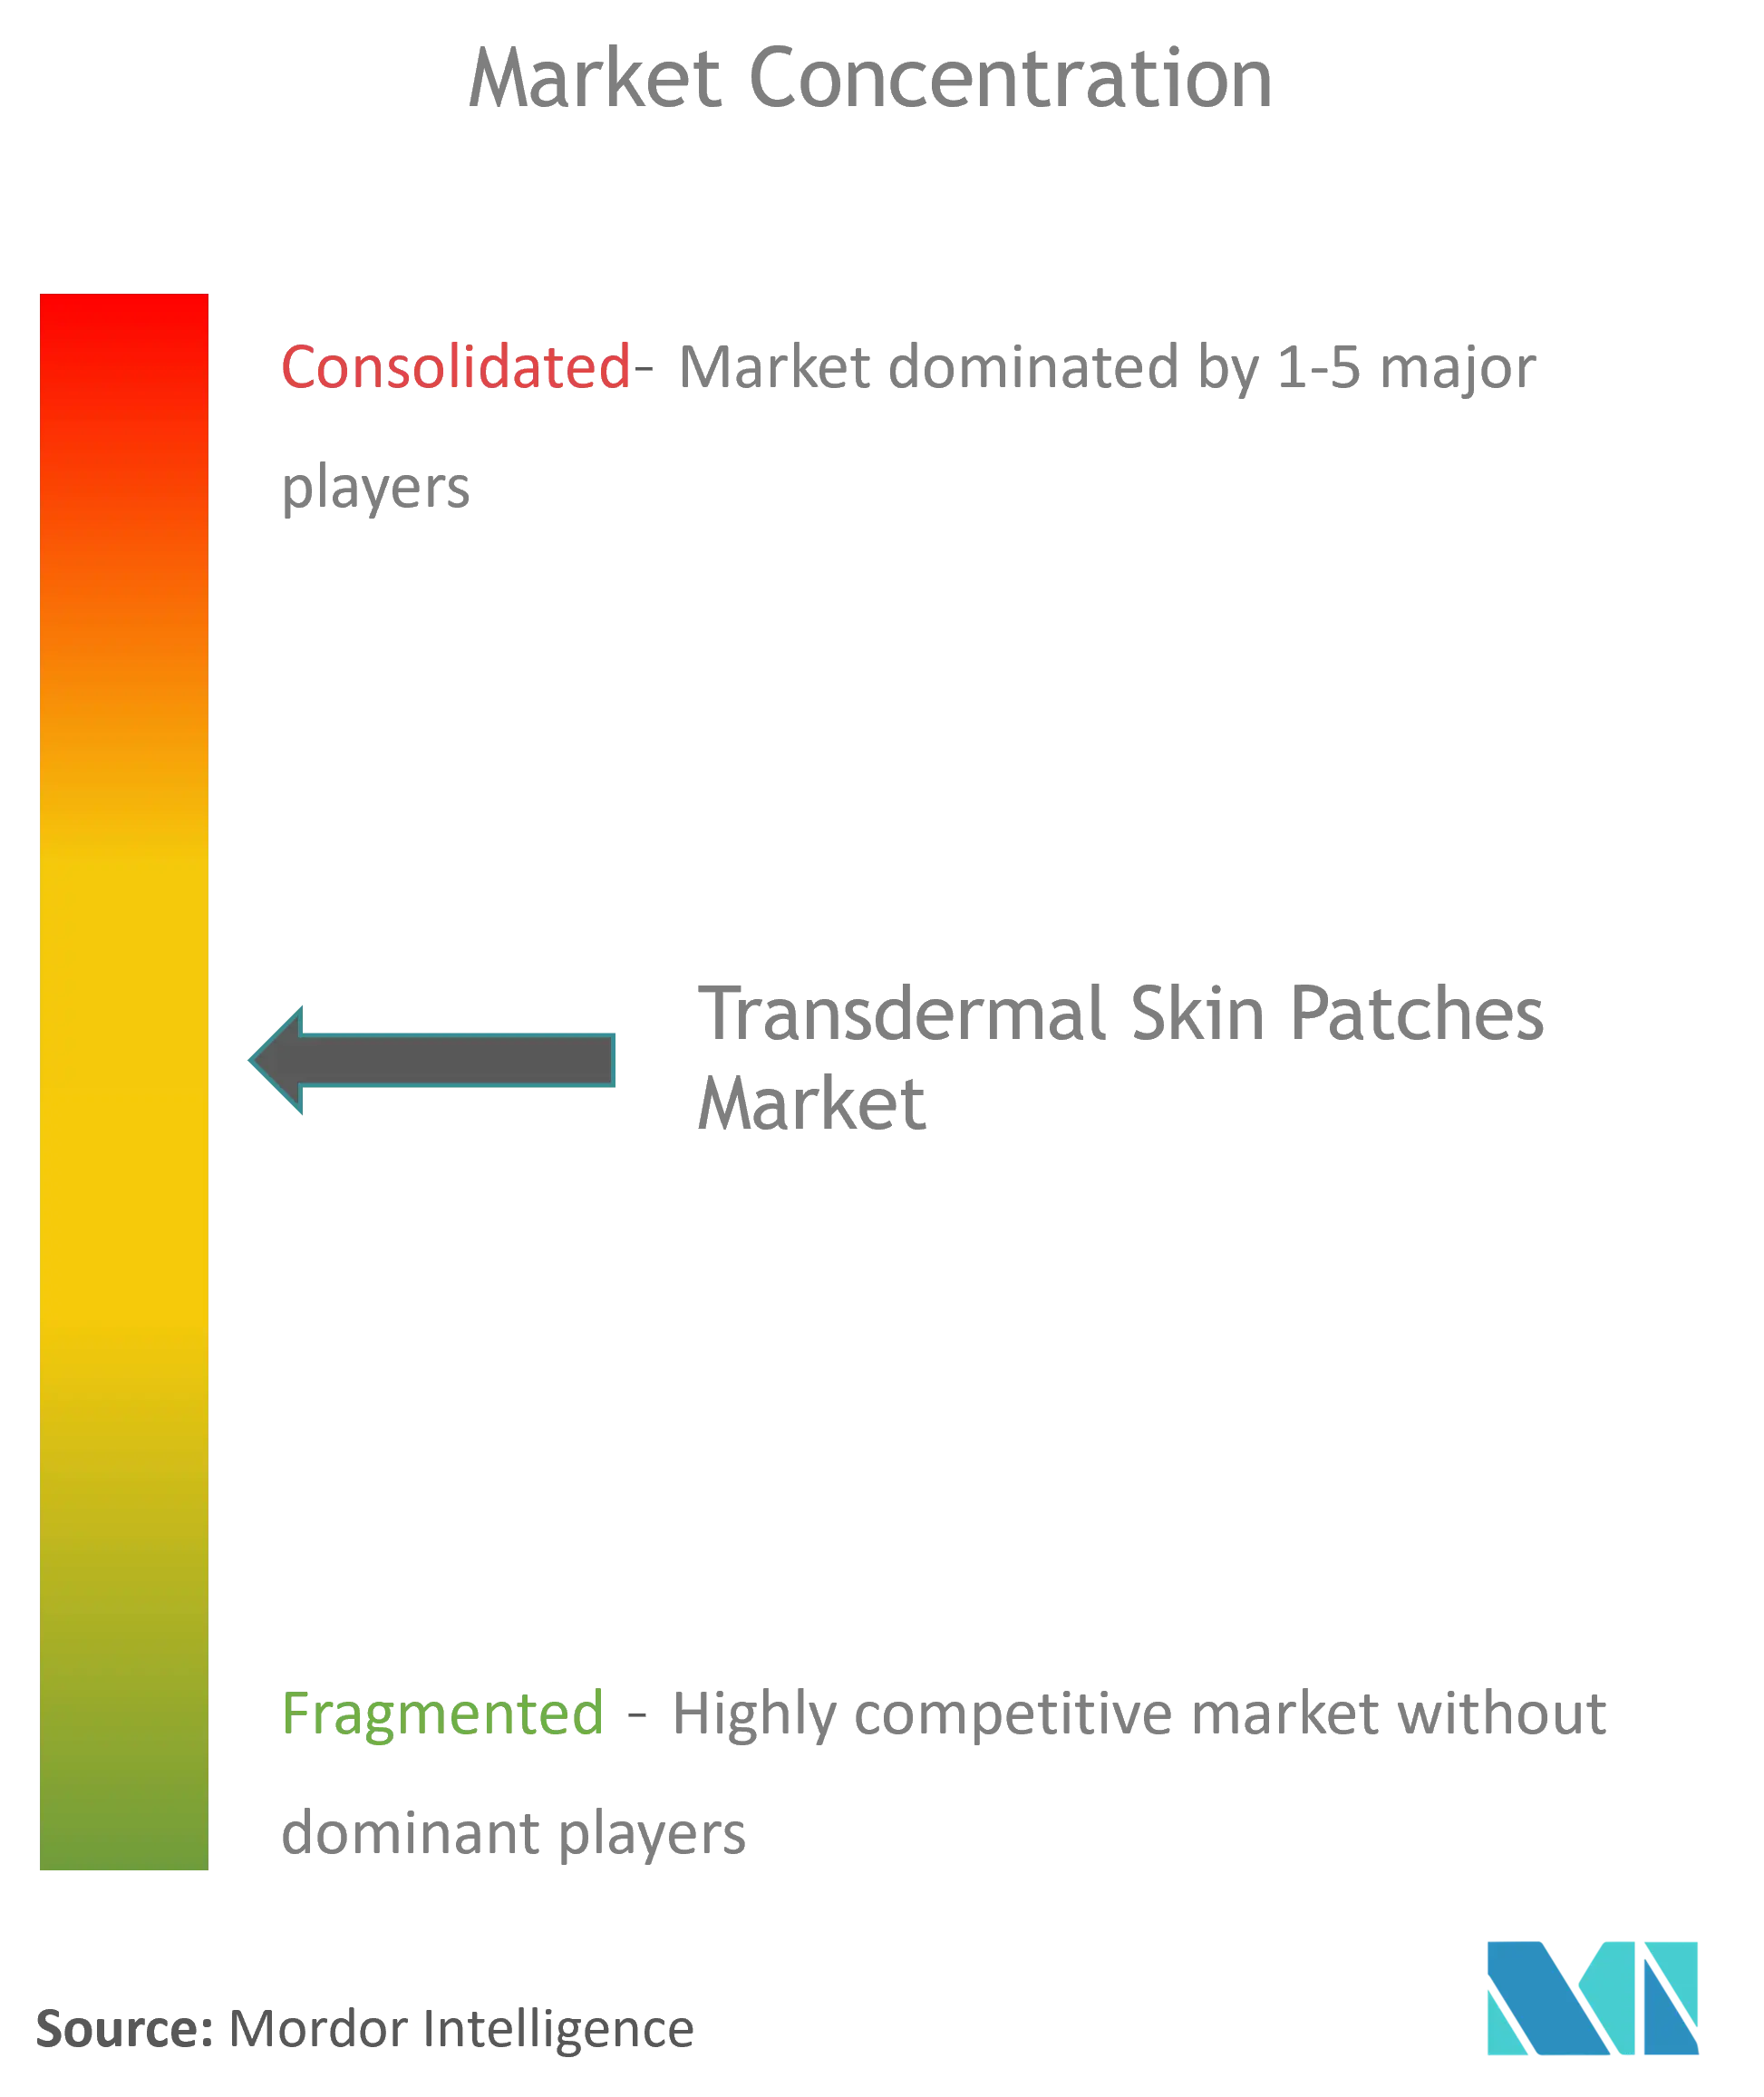
| Market Concentration | Medium |
Major Players *Disclaimer: Major Players sorted in no particular order Image © Mordor Intelligence. Reuse requires attribution under CC BY 4.0. | |
Transdermal Skin Patches Market Analysis by Mordor Intelligence
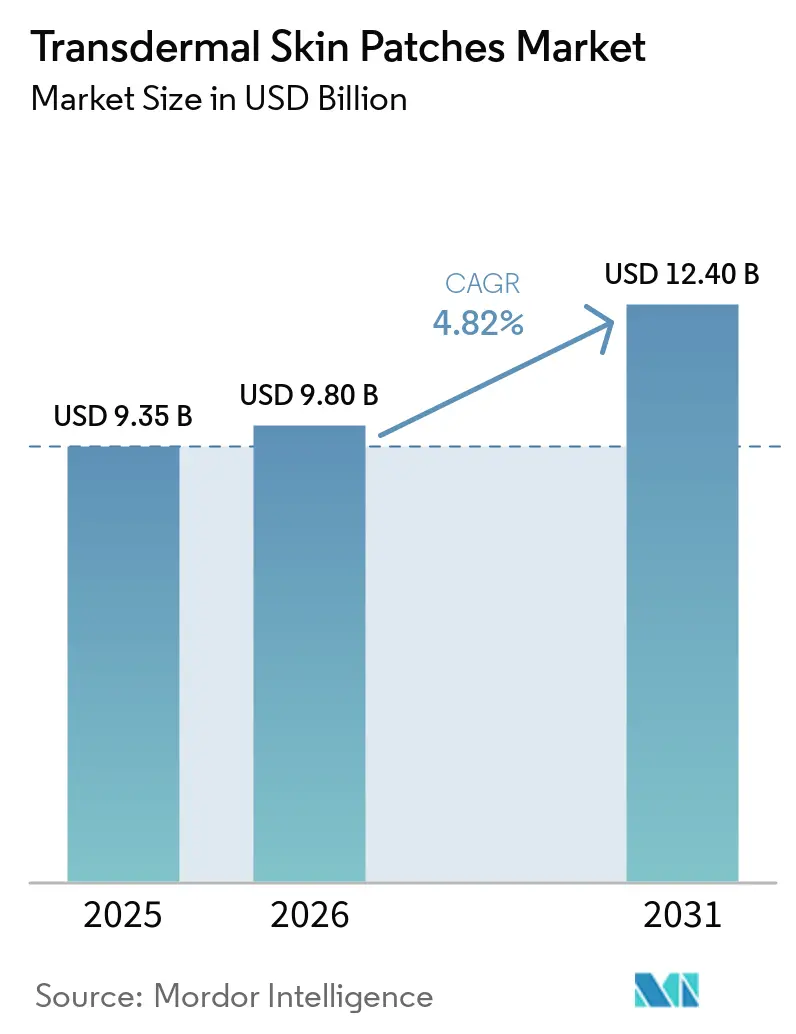
The Transdermal Skin Patches Market size was valued at USD 9.35 billion in 2025 and estimated to grow from USD 9.8 billion in 2026 to reach USD 12.4 billion by 2031, at a CAGR of 4.82% during the forecast period (2026-2031). Sustained growth is underpinned by patent-cliff pressures that push pharmaceutical companies toward reformulating blockbuster drugs into patches, the expanding pool of self-administered chronic-care therapies, and rapid progress in microneedle technology that widens the range of molecules suitable for dermal delivery. Manufacturers also benefit from clearer U.S. FDA combination-product guidance, accelerating development timelines and spurring investment in next-generation systems. Meanwhile, online pharmacies gain traction as patients gravitate toward discreet, subscription-based purchasing models that align with the modality’s convenience advantages.
Key Report Takeaways
- By therapeutic area, smoking cessation led with 64.01% of the transdermal skin patches market share in 2025, whereas neurological disorders are advancing at a 5.14% CAGR through 2031.
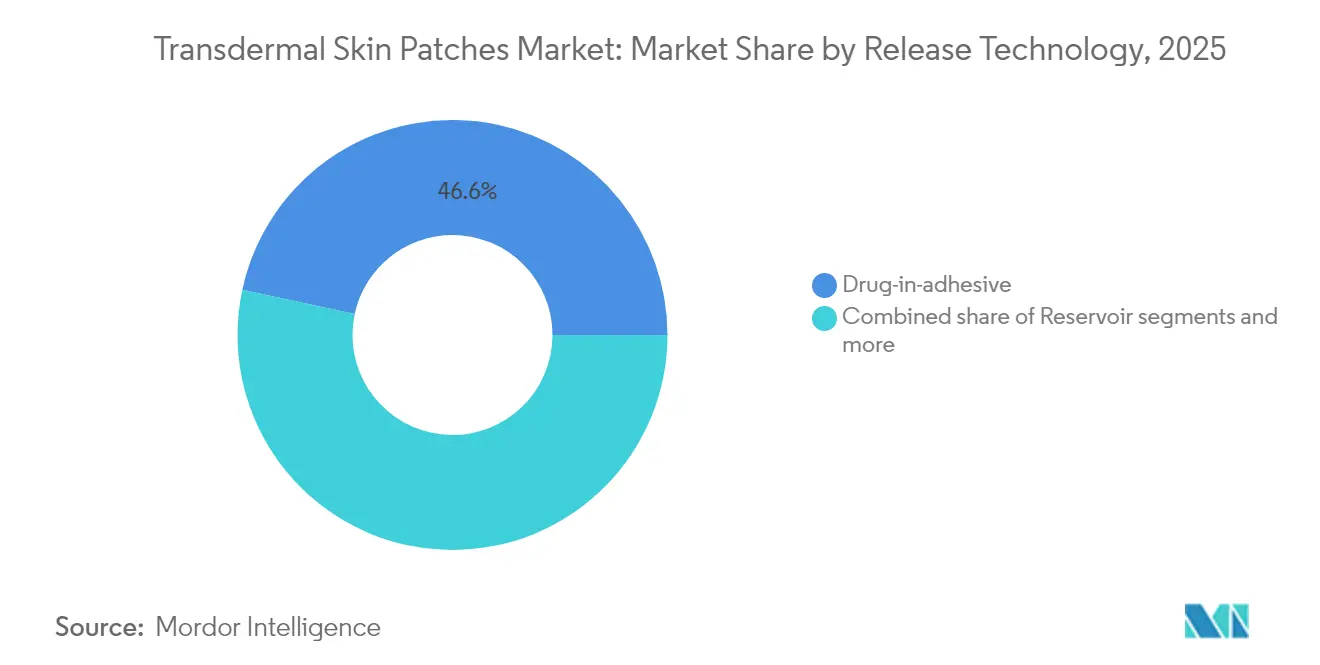
- By release technology, drug-in-adhesive systems captured 46.62% of the transdermal skin patches market size in 2025, while microneedle-assisted formats are expanding at 4.88% CAGR between 2026 and 2031.
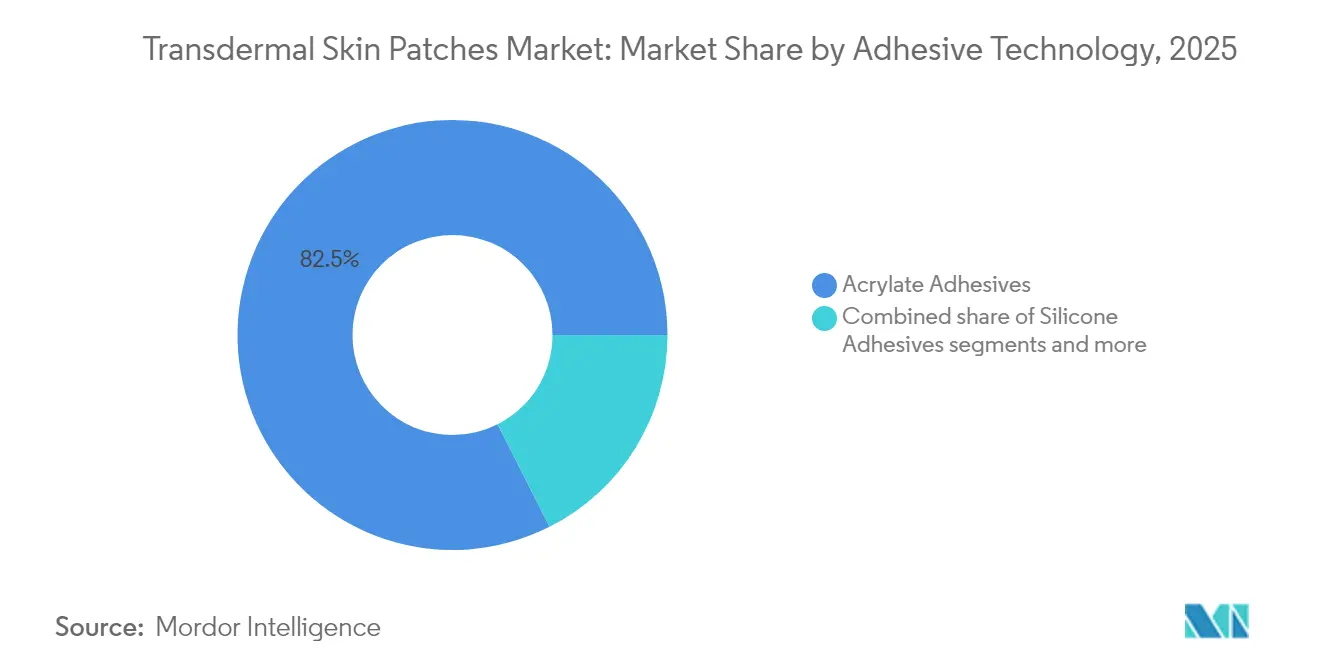
- By adhesive technology, acrylate platforms dominated with 82.45% revenue share in 2025; hydrogel formulations are projected to grow at 5.46% CAGR to 2031.
- By distribution channel, retail pharmacies held 70.55% share of the transdermal skin patches market in 2025, yet online pharmacies exhibit the fastest growth at 5.62% CAGR during the forecast horizon.
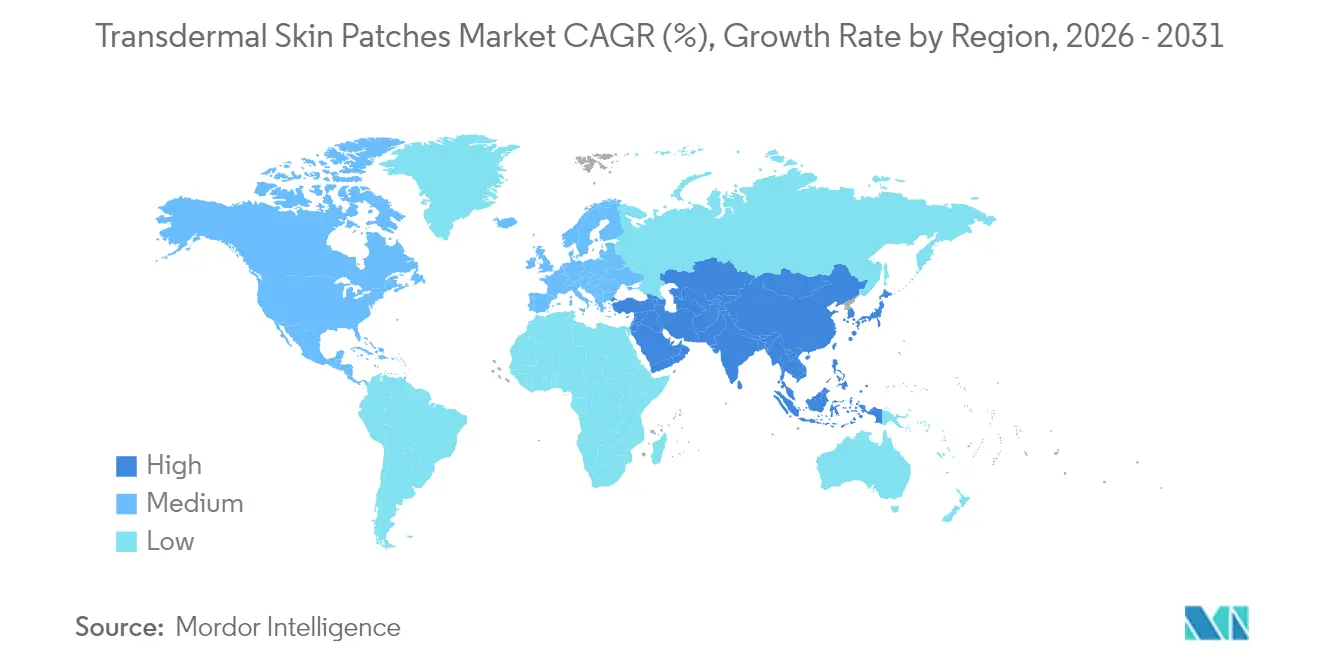
- North America commanded 38.77% of the transdermal skin patches market in 2025, whereas Asia-Pacific represents the fastest-growing region with a 5.06% CAGR to 2031.
Note: Market size and forecast figures in this report are generated using Mordor Intelligence’s proprietary estimation framework, updated with the latest available data and insights as of 2026.
Market Trends and Insights
Drivers Impact Analysis of Transdermal Skin Patches Market*
| Driver | (~) % Impact on CAGR Forecast | Geographic Relevance | Impact Timeline |
|---|---|---|---|
| Patent cliff–driven switch to novel delivery formats | +1.2% | North America & Europe | Medium term (2-4 years) |
| Rapid rise of self-administered chronic-care therapies | +0.9% | APAC & North America | Long term (≥ 4 years) |
| Reimbursement expansion for smoking-cessation aids | +0.7% | North America & EU | Short term (≤ 2 years) |
| Microneedle/ionic-poration hybrids entering Phase III | +0.6% | United States & Japan | Long term (≥ 4 years) |
| AI-enabled adhesive design lowering skin-irritation rates | +0.4% | Developed markets | Medium term (2-4 years) |
| Source: Mordor Intelligence | |||
Patent Cliff–Driven Switch to Novel Delivery Formats
Pharmaceutical companies face USD 200 billion worth of patent expirations between 2025-2030, prompting reformulations that extend exclusivity while improving patient adherence. This pivot is pronounced in chronic pain and neurological therapies where patches circumvent hepatic first-pass metabolism, enabling lower dosing with steadier plasma levels. FDA guidance released in June 2024 clarified “Essential Drug Delivery Outputs,” reducing regulatory uncertainty and cutting pre-approval timelines by up to 12 months. Companies therefore treat transdermal delivery as both a life-cycle management tool and a compliance-boosting strategy for lifestyle medications.
Rapid Rise of Self-Administered Chronic-Care Therapies
Rising global prevalence of diabetes, hypertension, and hormone-related conditions elevates demand for home-based treatment that minimizes clinic visits. Transdermal insulin systems achieved 35% higher patient-satisfaction scores than subcutaneous injections in recent trials. APAC markets adopt patches quickly due to aging populations and rural care gaps, while elderly cohorts worldwide value the simple “apply-and-go” format that aids cognitive decline-related adherence issues.
Rapid Rise of Self-Administered Chronic-Care Therapies
Rising global prevalence of diabetes, hypertension, and hormone-related conditions elevates demand for home-based treatment that minimizes clinic visits. Transdermal insulin systems achieved 35% higher patient-satisfaction scores than subcutaneous injections in recent trials. APAC markets adopt patches quickly due to aging populations and rural care gaps, while elderly cohorts worldwide value the simple “apply-and-go” format that aids cognitive decline-related adherence issues.
Reimbursement Expansion for Smoking-Cessation Aids
Twenty U.S. states now provide comprehensive insurance coverage for nicotine patches. North Dakota Medicaid dropped prior authorization in 2025, mirroring private-insurer trends that see a 40% rise in patient completion of cessation programs when costs are fully covered. Because smoking cessation already holds the largest therapeutic share, broader reimbursement materially lifts revenue visibility for patch suppliers.
Restraints Impact Analysis of Transdermal Skin Patches Market*
| Restraint | (~) % Impact on CAGR Forecast | Geographic Relevance | Impact Timeline |
|---|---|---|---|
| High development cost vs. oral generics | -0.8% | Global, particularly impacting emerging markets | Medium term (2-4 years) |
| Skin-sensitivity litigation risks | -0.5% | North America & EU, with regulatory scrutiny | Long term (≥ 4 years) |
| Regulatory ambiguity on combination-device pathway (U.S. & EU) | -0.4% | North America & EU, affecting global development | Short term (≤ 2 years) |
| Source: Mordor Intelligence | |||
High Development Cost vs. Oral Generics
Novel transdermal patches, including anti acne dermal patch products, can cost USD 50 million to bring to market compared with USD 5-10 million for oral generics, largely due to specialized manufacturing and bioequivalence studies. In low-income settings, payers emphasize volume over innovation, challenging patch adoption despite clinical benefits. Combination-product regulations further raise costs with added device-testing requirements, squeezing smaller entrants.
Skin-Sensitivity Litigation Risks
Medical adhesive-related skin injury affects around 1.5% of users and has triggered multimillion-dollar settlements in the United States. Heightened FDA scrutiny now mandates extensive dermatology datasets, elongating approval and inflating insurance premiums. As a result, some firms restrict innovation to known acrylate systems, slowing the shift toward more biocompatible platforms.
*Our forecasts treat driver/restraint impacts as directional, not additive. The impact forecasts reflect baseline growth, mix effects, and variable interactions.
Transdermal Skin Patches Market Segment Analysis
By Release Technology:
Microneedles Challenge Traditional DominanceDrug-in-adhesive systems held 46.62% of the transdermal skin patches market share in 2025, reflecting process maturity, proven safety, and cost efficiency. Yet microneedle-assisted formats show the highest forecast CAGR at 4.88%, propelled by their ability to deliver peptides, vaccines, and even GLP-1 agonists with bioavailability above 50%. Reservoir and matrix patches maintain niche roles in controlled-release analgesia and generic pain management, respectively.
Microneedle advances resonate with pharmaceutical pipelines that now feature larger biologic molecules. Start-ups such as Anodyne Nanotech report room-temperature-stable patches that bypass cold-chain costs, opening emerging-market opportunities. As clinical data accumulate, the technology is expected to reallocate a portion of the transdermal skin patches market size away from injections, particularly in chronic metabolic and autoimmune care.

By Therapeutic Area:
Neurological Applications Drive Growth Beyond Smoking CessationSmoking-cessation patches continue to dominate with 64.01% share in 2025, anchored by public-health funding and strong clinical evidence. However, neurological disorders register the fastest growth at 5.14% CAGR on the back of steady-state drug delivery advantages for Parkinson’s and ADHD therapies. Hormone-replacement and pain-management segments remain stable, while cardiovascular and contraception patches serve targeted populations.
Continuous dermal release mitigates peak-trough fluctuations critical in central-nervous-system treatment. Rotigotine and methylphenidate patches exemplify the model, demonstrating improved motor control and attentional stability, respectively. Payers increasingly recognize reduced hospitalization and enhanced quality-of-life outcomes, bolstering formulary inclusion.
By Adhesive Technology:
Hydrogel Innovation Challenges Acrylate DominanceAcrylate adhesives comprised 82.45% of 2025 revenues, valued for robust stickiness and established safety profiles. Hydrogel variants, though only a minor slice of the transdermal skin patches market size today, are forecast to grow at 5.46% CAGR as bio-friendly polymers ease skin stress and enable moisture-regulated drug dispersion. Silicone options cater to geriatric and pediatric skin sensitivity, while eco-based adhesives remain nascent.
Hydrogels’ ability to host nanoparticles and buffer pH positions them for high-dose biologic patches. Alpha-tocopherol-infused liposomal hydrogels, for instance, deliver retinaldehyde without irritation over 24 hours, proving promise for long-wear dermatological therapies. As manufacturing costs decline, the technology is expected to erode acrylate’s lead, especially in premium therapy areas.
By Distribution Channel:
Digital Transformation Accelerates Online GrowthRetail pharmacies accounted for 70.55% of sales in 2025, buoyed by pharmacist counseling and immediate pick-up convenience. Yet the online segment is expanding fastest at 5.62% CAGR, powered by telehealth integration, discrete delivery, and subscription models that synchronize refills. Hospital pharmacies dominate complex, multi-patch regimens, while direct-to-consumer channels serve cosmetic and lifestyle products.
Regulators now allow remote verification for prescription patches following 2024 FDA digital-health guidance, fostering app-linked adherence platforms and automated shipping. For chronic smokers and menopausal women, e-commerce mitigates stigma and encourages sustained therapy, further lifting the overall transdermal skin patches market.
Geography Analysis
North America Transdermal Skin Patches Market
North America led the transdermal skin patches market with 38.77% share in 2025, lifted by broad reimbursement for nicotine therapy, favorable IP protection, and streamlined FDA combination-product pathways. Medicare’s inclusion of patches for vasomotor symptom management in 2025 further widens uptake, while domestic manufacturing expansions, such as LGM Pharma’s USD 6 million facility upgrade, bolster supply resilience. U.S. demographic aging also raises demand for patch-based pain and hormone therapies requiring minimal dexterity.
Europe Transdermal Skin Patches Market
Europe follows with mature yet regulation-dense adoption. Implementation of MDR raises compliance costs, yet the European Medicines Agency’s 2024 Q&A clarifies device-drug integration requirements, reducing ambiguity. Hormone-replacement patches enjoy strong traction, though recent estradiol shortages underline the need for regional manufacturing redundancy. Additionally, smoking-cessation reimbursement across leading EU economies sustains steady volume despite fierce generic competition.
APAC Transdermal Skin Patches Market
Asia-Pacific represents the fastest-growing region, advancing at 5.06% CAGR through 2031. Aging populations in China and Japan, coupled with rising diabetes prevalence, create fertile ground for patch adoption. Regulatory harmonization across ASEAN, alongside local production investments, lowers market-entry barriers. China’s menopausal-therapy market illustrates the opportunity; clinicians increasingly recommend patches over oral estrogen due to lower thrombotic risk. Expanding e-commerce ecosystems also address rural accessibility challenges, propelling online patch sales.
Regulatory Landscape
Transdermal skin patches are typically regulated as drug-device combination products, so development and commercialization depend on alignment between drug CGMP expectations and device quality requirements. In the United States, FDA combination-product requirements under 21 CFR Part 4 drive integrated quality approaches across drug manufacturing and device controls, while FDA guidance for transdermal/topical delivery systems has tightened expectations around product development, performance, and quality attributes that shape approval packages for both innovators and generics.
In Europe, the pathway is determined by the principal mode of action, with medicinal-product rules applying to integral drug-device combinations and device conformity requirements also applying under the EU MDR. Article 117 of the MDR has become a practical gating point, requiring either a CE certificate for the device part or a Notified Body opinion to support the medicinal product dossier. Biocompatibility and skin-contact safety evidence increasingly relies on recognized standards, including ISO 10993-1:2025 for biological evaluation of surface-contact devices, which raises documentation and testing rigor for adhesives, backings, and other patient-contacting materials.
Value Chain Analysis
The value chain begins with upstream suppliers of APIs and specialty materials, including acrylic and silicone adhesive systems, backing films, release liners, and pouching materials that protect stability. Typical patch construction combines multiple integrated components (often 4 to 6 elements), where material selection affects adhesion, drug flux, and skin tolerability, and where single-source dependencies for medical-grade adhesives and liners can introduce procurement risk. Regulatory quality requirements from FDA and EMA influence supplier qualification, incoming-material testing, and change-control practices throughout the chain.
Midstream activities cover formulation, coating/lamination, cutting, pouching, and packaging, with a significant portion of scaling handled by specialist CDMOs that provide development-to-commercial services and validated manufacturing lines. Recent partnering activity shows how innovators and brands use CDMOs to accelerate differentiated formats and manage controlled-substance complexity, including the February 2025 exclusive development partnership between Nutriband and Kindeva Drug Delivery for the Aversa abuse-deterrent fentanyl patch. Downstream, retail pharmacies remain the dominant distribution channel, while online pharmacy models and subscription refill programs expand access for self-administered chronic therapies; final-stage stakeholders include wholesalers, pharmacies, providers, and payers that affect formulary positioning and patient adherence.
Competitive Landscape
The transdermal skin patches market shows moderate concentration. Legacy firms such as Johnson & Johnson and Novartis leverage scale and regulatory expertise, but growth hinges on innovation rather than portfolio breadth. Emerging players—Anodyne Nanotech with HeroPatch and Medherant’s TEPI Patch—attract capital by targeting biologic delivery gaps. CordenPharma’s USD 980 million GLP-1 capacity expansion underscores industry belief in peptide-patch potential.
Partnerships dominate strategy. Big pharma pairs with specialist CMOs for microneedle fabrication, while consumer-health brands collaborate with AI adhesive developers to differentiate on comfort. Competitive intensity increases as FDA approves the first generic lidocaine 1.8% patch in 2025, signaling an emerging off-patent wave. Nevertheless, experience navigating device-drug regulations provides incumbents an edge, balancing disruptive threats with collaboration prospects.
Transdermal Skin Patches Industry Leaders
-
Teva Pharmaceuticals USA Inc.
-
Novartis AG
-
Teikoku Pharma USA, Inc.
-
Viatris, Inc.
-
Johnson & Johnson
- *Disclaimer: Major Players sorted in no particular order
Transdermal Skin Patches Market Companies Covered in this Report
- 3M
- Abbott Laboratories
- Johnson & Johnson
- Novartis
- Teva Pharmaceutical Industries
- Hisamitsu Pharmaceutical
- GlaxoSmithKline
- Bayer
- Viatris
- LTS Lohmann Therapie-Systeme
- Nitto Denko
- Corium LLC
- Agile Therapeutics Inc.
- UCB
- Luye Pharma Group Ltd.
- Zydus Lifesciences Ltd.
- Sparsha Pharma International Pvt Ltd
- Tapemark Inc.
- AdhexPharma
Market Opportunities and Future Outlook
Innovation whitespace is moving beyond passive diffusion toward active and intelligent transdermal platforms that can broaden the addressable molecule set and improve adherence. In 2026, Medicsensors S.L initiated the SOUNDD clinical study for its non-invasive ultrasound-based Medicsen Smartpatch, highlighting continuing clinical translation of device-enabled delivery concepts at the intersection of drug delivery and digital health. Parallel research progress, including 2026 work in npj Flexible Electronics on a self-powered, eco-degradable iontophoretic patch with dose indication, supports opportunities for multifunctional patches that pair delivery with user-facing feedback and monitoring.
Manufacturing modernization and compliance upgrades also create near-term opportunities for suppliers and CDMOs that help sponsors meet tightening device-quality expectations within combination products. The February 2026 effective date linked to FDA updates for quality system requirements (21 CFR part 820 alignment) increases the operational premium on harmonized design controls, validation, and supplier management for the device constituent. Separately, sustainability-driven material substitution, such as biodegradable polymers (for example cellulose, chitosan, and hyaluronic acid), is becoming a practical development pathway for differentiation in skin tolerability and environmental footprint, while keeping documentation aligned with established FDA and EMA quality frameworks for transdermal patch programs.
Recent Industry Developments in Transdermal Skin Patches Market
- May 2026: Viatris announced multiple data presentations on its investigational once-weekly combined hormonal contraceptive patch (MR-100A-01) at the 2026 American College of Obstetricians and Gynecologists Annual Clinical and Scientific Meeting. The updates reinforced competitive momentum in weekly-wear hormone patches and supported clinical and regulatory positioning for a differentiated transdermal option in contraception.
- April 2026: FDA classified Teva Pharmaceuticals USA Inc.'s voluntary recall (initiated March 19, 2026) of 300,133 cartons of Clonidine Transdermal System, USP (0.1, 0.2, and 0.3 mg/day) as Class II due to use of an unapproved raw material. The action underscored quality-system sensitivity in combination-like transdermal products and increased scrutiny on supplier qualification and material change controls across patch manufacturing.
- March 2025: LGM Pharma invested USD 6 million to expand US-based semi-solid and transdermal manufacturing capabilities. The upgrade strengthened domestic supply resilience for transdermal formats and supported sponsors seeking closer-to-market production under FDA quality expectations.
Transdermal Skin Patches Market Report Scope and Research Methodology
Market Definition and Coverage
The transdermal skin patches market is defined as revenues generated from medicated patches designed to deliver an active drug through the skin into systemic circulation, across major therapeutic uses and regions, measured in current USD.
Scope exclusions: Wound dressings, cosmetic patches with no systemic drug delivery intent, and standalone drug delivery devices that are not sold as patches are excluded.
Segments Covered in This Report
- By Release Technology (Value)
- Drug-in-adhesive
- Reservoir
- Matrix
- Microneedle-assisted
- Others
- By Therapeutic Area (Value)
- Smoking Cessation
- Hormone Replacement Therapy
- Pain Management
- Neurological Disorders
- Cardiovascular Disorders
- Contraception
- Others
- By Adhesive Technology (Value)
- Acrylate Adhesives
- Silicone Adhesives
- Hydrogel Adhesives
- Other Adhesives
- By Distribution Channel (Value)
- Hospital Pharmacies
- Retail Pharmacies
- Online Pharmacies
- Others
- By Geography (Value)
- North America
- United States
- Canada
- Mexico
- Europe
- Germany
- United Kingdom
- France
- Italy
- Spain
- Rest of Europe
- Asia-Pacific
- China
- India
- Japan
- South Korea
- Australia
- Rest of Asia-Pacific
- South America
- Brazil
- Argentina
- Rest of South America
- Middle East and Africa
- GCC
- South Africa
- Rest of Middle East and Africa
- North America
Data Sources, Market Sizing, and Validation
Desk Research
Desk research starts by fixing the definition for medicated transdermal patches and then matching that definition to how sales are reported across countries and channels. We rely on public and official sources such as FDA drug labeling databases and safety communications, CDC and NIH publications for disease burden and treatment patterns, and OECD and World Bank indicators for macro health and income context.
To turn that context into model inputs, we also review customs and trade statistics portals for import export signals, peer reviewed pharmaceutics journals for patch technology trends (for example, drug in adhesive vs matrix designs), and company filings and investor presentations for portfolio exposure and geographic mix. Where needed, paid subscriptions are used in a limited way for company financials and patent landscaping, so assumptions can be checked against observable signals. The sources listed here are illustrative, and other public materials were used as well to collect data, validate assumptions, and clarify open questions.
Primary Interviews and Surveys
Primary work is used to pressure test desk assumptions on pricing, adoption, and channel mix, because these drivers vary by therapy area and region. We spoke with manufacturers, distributors, pharmacists, clinicians, and formulation experts across the Americas, EMEA, and APAC, so gaps in public data could be addressed and then reconciled into one consistent view.
Distribution of primary research fieldwork respondents
| Company type | Respondent position | Region |
|---|---|---|
| Top tier: 31% | CXOs: 12% | APAC: 38% |
| Mid tier: 47% | Functional/Unit leaders: 33% | EMEA: 35% |
| Smaller Players: 22% | Managers: 55% | Americas: 27% |
Market-Sizing & Forecasting
The sizing model uses a top-down and bottom-up blend. Treatment demand is first reconstructed from therapy area prevalence, likely treated populations, and typical patch utilization, and then converted into value using region specific price ranges and channel mix. Those totals are corroborated with selective bottom-up approximations, such as rolling up sampled product revenues where disclosures exist, validating average selling price bands with pharmacy and distributor feedback, and checking reasonableness by comparing implied volumes to prescription and therapy usage patterns.
Key inputs used in the model include the share of patients on transdermal therapy in pain relief, smoking cessation, hormonal therapy, and overactive bladder, average wear duration and replacement frequency per indication, list price versus realized price ranges by channel, genericization impacts on price progression, and regional access factors such as reimbursement and formulary placement. When product level information is missing, gaps are handled using therapy level benchmarks and then adjusted with expert feedback until the implied adoption curve stays realistic.
For forecasting, scenario analysis is used so changes such as approval timing, generic entry, and reimbursement shifts can be reflected without forcing one straight line growth path. Assumptions are reviewed with interviewees and then applied consistently year by year, so growth remains tied to observable drivers.
Data Validation & Update Cycle
Validation is done through repeated cross checks that compare model outputs with independent signals, including therapy level demand indicators, country level access and pricing patterns, and the implied split across regions and applications. When a value looks out of range, we revisit the driver that created it, re check the supporting source, and then re contact participants if the gap is still material.
Before sign off, the model and assumptions undergo multi step analyst review to catch calculation errors, double counting, and scope creep early. The report is refreshed annually, and interim updates are made when major events happen, such as notable approvals, large recalls, or sharp pricing changes. Right before delivery, a final pass is completed so clients receive the most current view that can reasonably be supported by the evidence.
Mordor Intelligence's Transdermal Skin Patches Market Size Compared With Other Published Estimates
It is normal to see different market sizes published for transdermal patches, even when the topic name looks the same. The differences usually come from how each study draws the product scope, the year used as the anchor, and the pricing logic used to translate demand into revenue.
A few differences show up often in this space, including whether non medicated cosmetic patches are mixed into the total, whether hospital and retail channels are treated with the same price level, and whether growth assumes fast adoption of newer patch formats without checking reimbursement and switching behavior. The spread also widens when older base years are used and then inflated forward without re checking against newer product mix and regional price changes, which is where refresh timing matters.
Benchmark comparison
| Source | Market Size | Gaps in Research Methodology |
|---|---|---|
| Mordor Intelligence | USD 9.35 B (2025) | |
| Industry Research Publisher A | USD 6.19 B (2024) | Anchors on an earlier base year and appears to count a narrower set of patch revenues, with less clarity on how channel level prices and therapy specific usage assumptions were carried into the USD total. |
| Healthcare Research Publisher B | USD 6.80 B (2025) | Uses a higher growth curve through the forecast window and seems to apply more blended channel pricing, which can shift the implied average selling price and the final market value. |
The comparison points to two practical gap drivers: what is counted as a medicated transdermal patch sale and how realized prices differ by channel and country. By keeping cosmetic and non systemic patch products out of scope, and by re checking indication level utilization and channel price bands during annual refreshes, the 2025 total stays closer to an evidence based demand pool, a discipline maintained by Mordor Intelligence.
Key Questions Answered in the Report
How big is the Transdermal Skin Patches Market?
The Transdermal Skin Patches Market size is expected to reach USD 9.8 billion in 2026 and grow at a CAGR of 4.82% to reach USD 12.4 billion by 2031.
What is the current Transdermal Skin Patches Market size?
In 2026, the Transdermal Skin Patches Market size is expected to reach USD 9.8 billion.
Who are the key players in Transdermal Skin Patches Market?
Teva Pharmaceuticals USA Inc., Novartis AG, Teikoku Pharma USA, Inc., Viatris, Inc. and Johnson & Johnson are the major companies operating in the Transdermal Skin Patches Market.
Which is the fastest growing region in Transdermal Skin Patches Market?
Asia-Pacific is estimated to grow at the highest CAGR of 5.06% over the forecast period (2026-2031).
Which region has the biggest share in Transdermal Skin Patches Market?
In 2025, the North America accounts for the largest market share in Transdermal Skin Patches Market.