
Transaction Monitoring Market Size and Share
Market Overview
| Study Period | 2020 - 2031 |
|---|---|
| Market Size (2026) | USD 23.13 Billion |
| Market Size (2031) | USD 48.06 Billion |
| Growth Rate (2026 - 2031) | 15.74 % |
| Fastest Growing Market | Asia Pacific |
| Largest Market | North America |
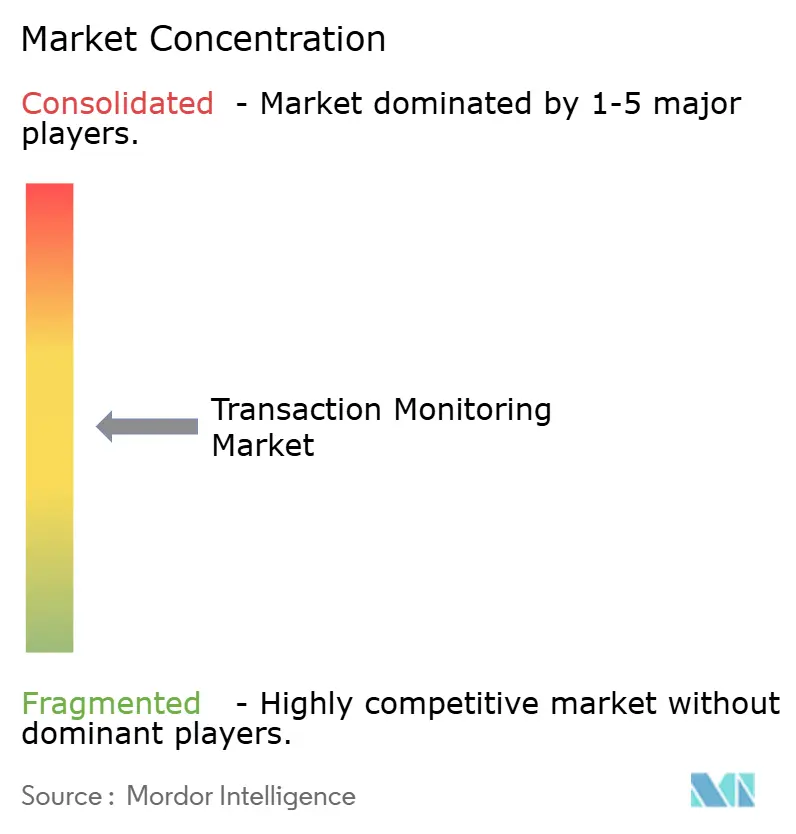
| Market Concentration | Medium |
Major Players *Disclaimer: Major Players sorted in no particular order Image © Mordor Intelligence. Reuse requires attribution under CC BY 4.0. | |
Transaction Monitoring Market Analysis by Mordor Intelligence
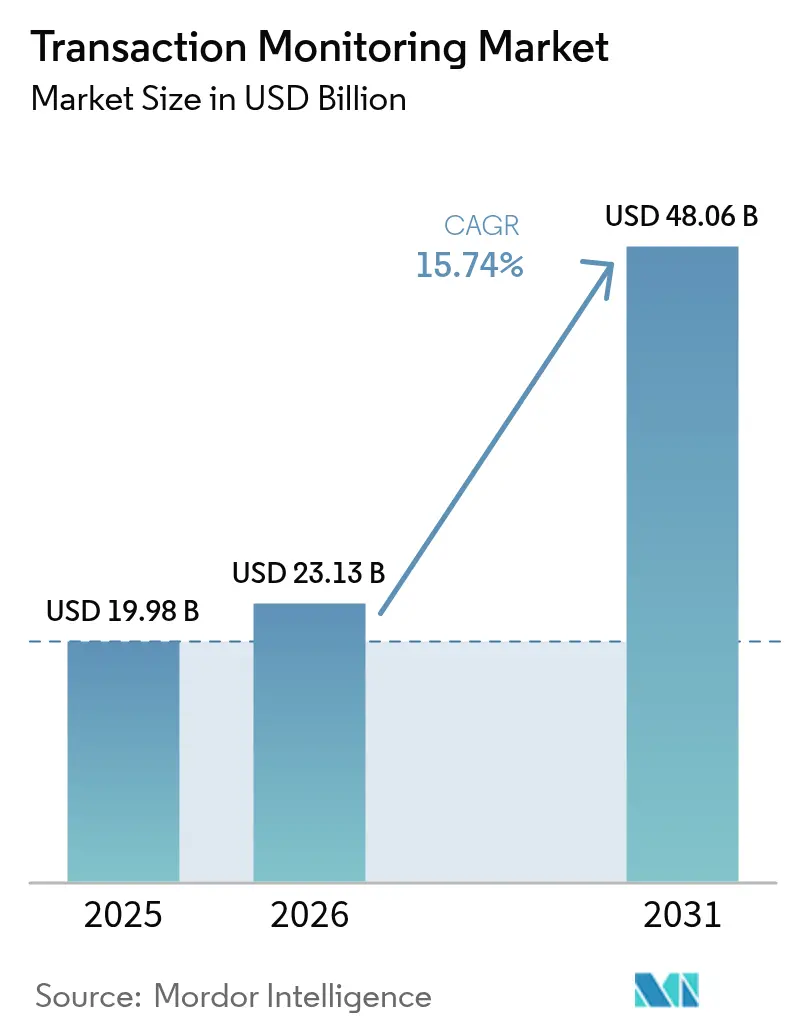
The transaction monitoring market size was valued at USD 19.98 billion in 2025 and estimated to grow from USD 23.13 billion in 2026 to reach USD 48.06 billion by 2031, at a CAGR of 15.74% during the forecast period (2026-2031). Growth stems from rising regulatory expectations, fast-expanding digital payments, and the rapid infusion of AI into compliance workflows. Vendors are sharpening competitive positioning through entity-centric analytics that shrink false positives, while financial institutions pursue cloud migration to modernize surveillance at scale. The transaction monitoring market is also expanding beyond banking as retail, e-commerce, and fintech platforms embed real-time controls to protect high-velocity payment streams. Heightened focus on integrated “FRAML” solutions is pushing providers to unify AML, fraud, and sanctions monitoring in a single stack, creating richer data contexts for risk scoring. Meanwhile, CBDC pilots and open-banking APIs are opening fresh revenue pools for platforms that can address cross-bank and cross-asset visibility requirements.
Key Report Takeaways
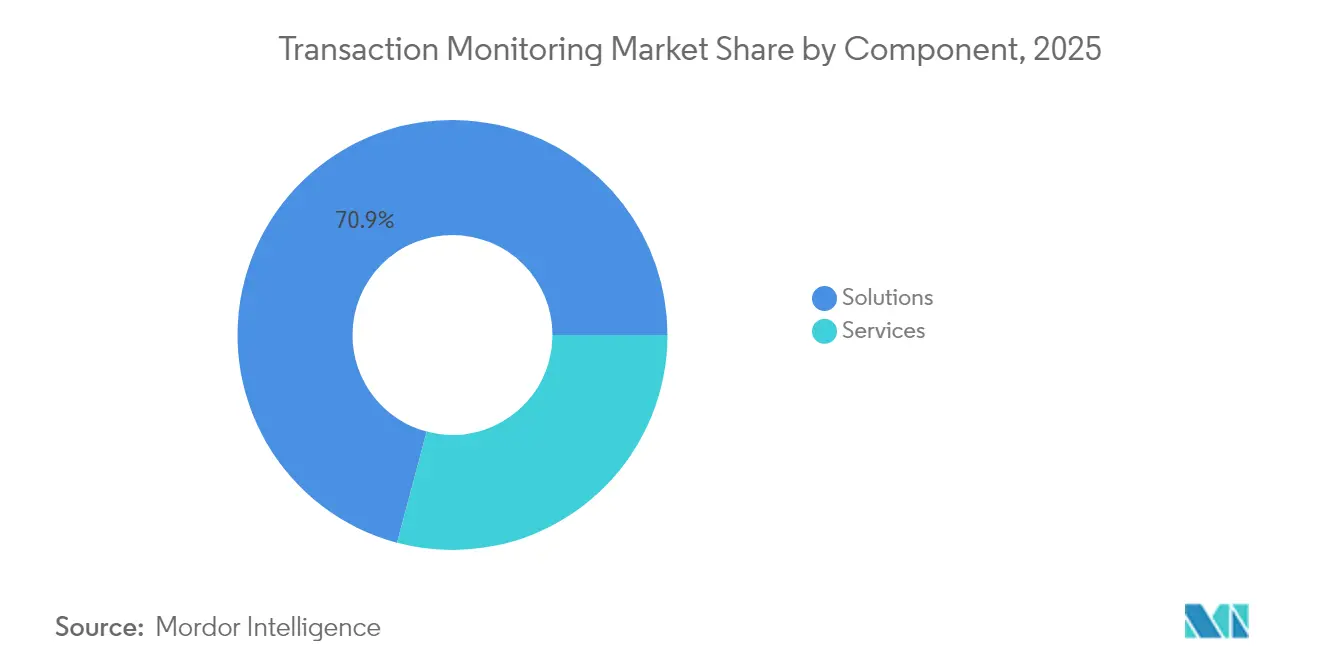
- By component, solutions held 70.85% of the transaction monitoring market share in 2025, while services are projected to grow the fastest at an 18.12% CAGR through 2031.
- By deployment mode, cloud accounted for 63.25% of the transaction monitoring market size in 2025 and is forecast to expand at a 19.28% CAGR between 2026-2031.
- By application, AML captured 41.65% revenue in 2025; fraud detection & prevention is advancing at the highest 20.74% CAGR to 2031.
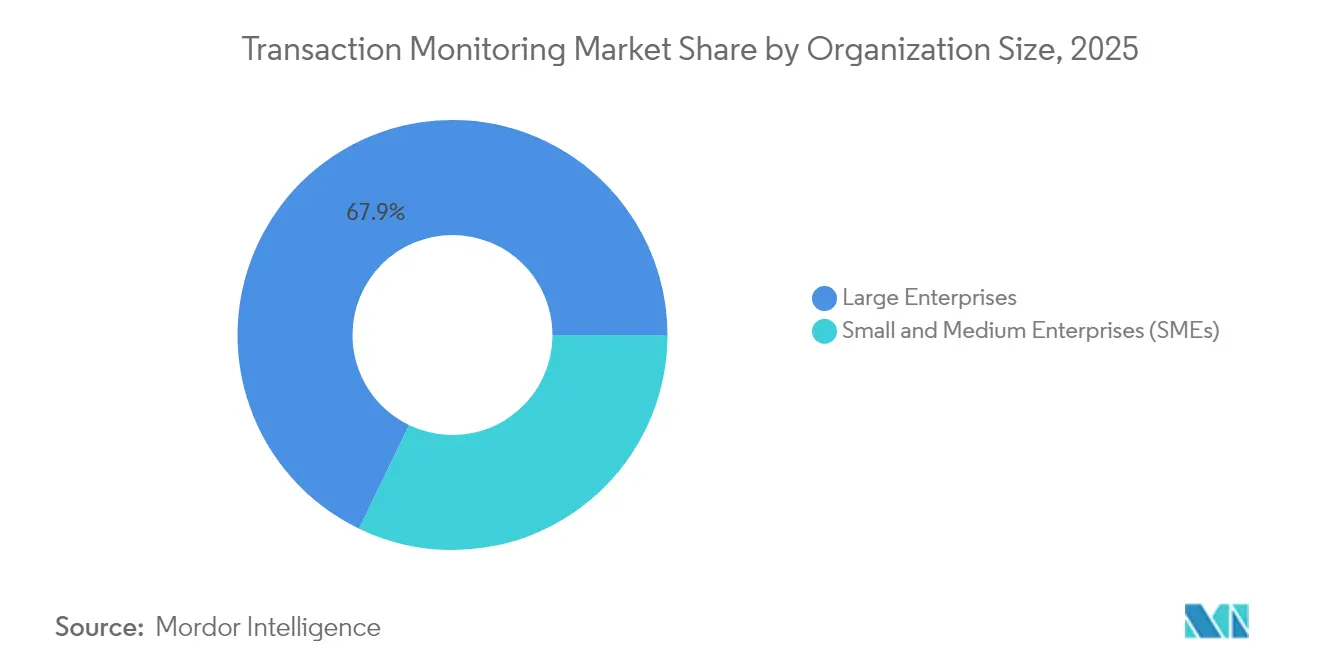
- By organization size, large enterprises held 67.85% share of the transaction monitoring market size in 2025, whereas SMEs post a 20.02% CAGR to 2031.
- By industry vertical, BFSI led with 55.75% share in 2025; retail & e-commerce is projected to post the quickest 21.78% CAGR through 2031.
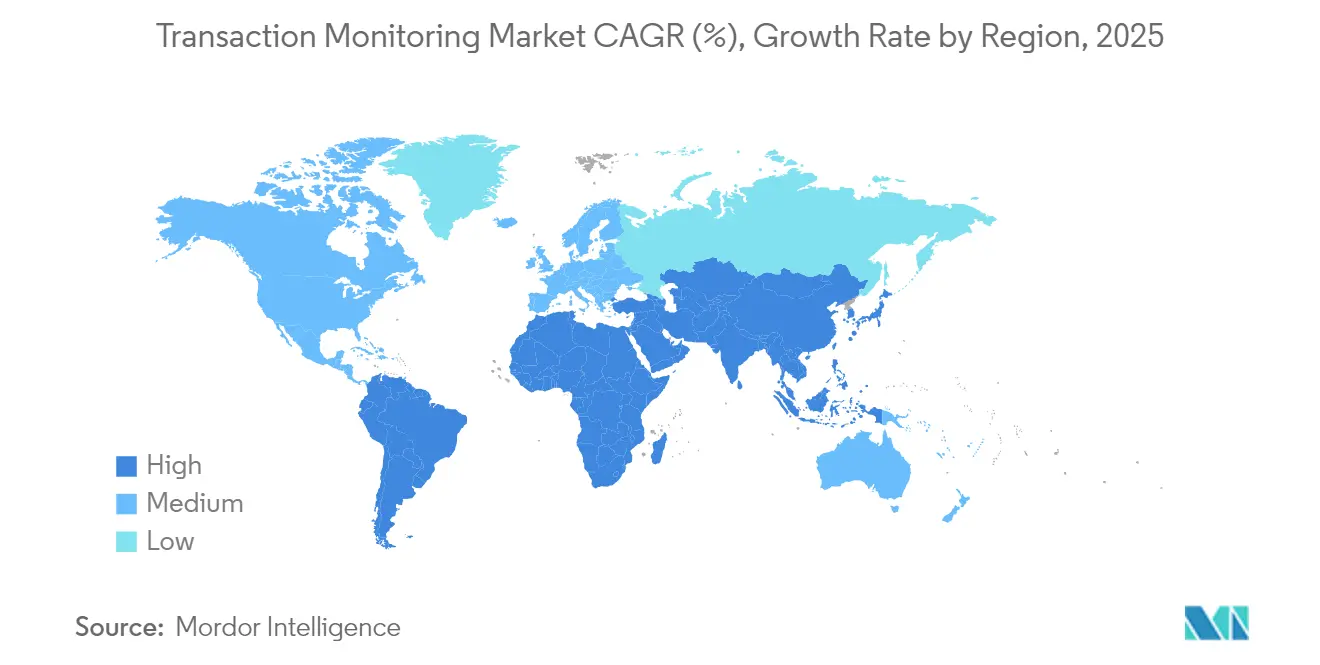
- By geography, North America commanded 32.65% of the transaction monitoring market share in 2025; Asia-Pacific records the strongest 17.14% CAGR to 2031 napier.ai.
Note: Market size and forecast figures in this report are generated using Mordor Intelligence’s proprietary estimation framework, updated with the latest available data and insights as of 2026.
Market Trends and Insights
Drivers Impact Analysis of Transaction Monitoring Market*
| Driver | (~) % Impact on CAGR Forecast | Geographic Relevance | Impact Timeline |
|---|---|---|---|
| Stringent AML & KYC regulations | +4.0% | Global – North America, Europe lead | Medium term (2-4 years) |
| Rising volumes of digital & real-time payments | +3.2% | Global – APAC highest | Short term (≤2 years) |
| Integration of AI & ML to cut false positives | +2.4% | Global – early North America uptake | Medium term (2-4 years) |
| Shift toward cloud-based compliance platforms | +1.9% | Advanced economies worldwide | Short term (≤2 years) |
| Open-banking APIs enabling cross-bank monitoring | +1.6% | Europe, North America, APAC | Medium term (2-4 years) |
| CBDC pilots triggering new surveillance mandates | +1.3% | China, EU, then global | Long term (≥4 years) |
| Source: Mordor Intelligence | |||
Stringent AML & KYC regulations
Global AML penalties climbed 31% year on year to USD 263 million in 2024, prompting banks to retire legacy rule sets in favor of adaptive, AI-enabled engines that address the EU 6AMLD and the US Corporate Transparency Act. Institutions deploying advanced models report 40% fewer false positives and materially stronger examiner confidence, speeding case workflows and reducing compliance backlogs.
Digital payments expansion necessitates real-time monitoring
Real-time payment rails demand sub-second scoring, and firms that upgrade monitoring pipelines see a 49% lift in fraud-prevention effectiveness. Retail and e-commerce adopters leverage the same controls to stem loyalty fraud and card-testing attacks, cutting fraud losses by up to 60% while preserving customer experience.[1]
AI and machine learning transform detection accuracy
Self-learning models discover complex laundering syndicates by linking transactional, behavioral, and adverse-media data, driving a 2-4× increase in risk detection and slashing false positives by more than 60%.[2] Natural-language processing now mines unstructured data to flag entities sooner than transaction-only approaches, yielding early-warning benefits.
CBDC pilots trigger new surveillance mandates
More than 130 jurisdictions are testing CBDCs, each adding telemetry that must be folded into AML. [3]Providers that master privacy-preserving analytics for sovereign digital currencies unlock a long-run growth vector as pilots mature into production.
Restraints Impact Analysis of Transaction Monitoring Market*
| Restraint | (~) % Impact on CAGR Forecast | Geographic Relevance | Impact Timeline |
|---|---|---|---|
| High false-positive alert fatigue | -2.4% | Global | Short term (≤2 years) |
| Shortage of skilled AML data analysts | -1.9% | Emerging markets most acute | Medium term (2-4 years) |
| Data-sovereignty & privacy-law friction | -1.6% | EU, China, Russia | Medium term (2-4 years) |
| Surge in synthetic-ID fraud bypassing rules | -1.3% | North America first | Short term (≤2 years) |
| Source: Mordor Intelligence | |||
High false-positive alert fatigue
Rule-centric systems still generate above-90% noise ratios, forcing banks to hire large analyst teams and risking missed threats amid alert overload. TD Bank’s USD 3 billion penalty underscored the cost of poor triage. AI-powered case managers are cutting false positives by 40%, freeing investigators for high-value reviews.[4]
Synthetic identity fraud evades traditional controls
Synthetic-ID schemes produced USD 23 billion in losses during 2024 as criminals blend fabricated and legitimate attributes to mimic normal customers jackhenry.com. Deepfake accelerators widened the threat by 244% year on year. [5] Financial institutions counter with layered biometrics and behavioral analytics to expose anomalous identity footprints, curbing loss velocity and protecting customer onboarding.
*Our forecasts treat driver/restraint impacts as directional, not additive. The impact forecasts reflect baseline growth, mix effects, and variable interactions.
Transaction Monitoring Market Segment Analysis
By Component:
Services Strengthen Detection OutcomesSolutions held 70.85% share in 2025, growing reliance on external expertise signals a shift toward continuous-improvement outsourcing. Specialized providers build recurring revenue around post-implementation optimization, ensuring the transaction monitoring market maintains resilient demand through economic cycles as compliance requirements tighten.
However, Services revenue within the transaction monitoring market is expected to rise at an 18.12% CAGR from 2026-2031 as institutions recognize that technology alone cannot sustain effective compliance. Engagements covering AI-model validation, scenario tuning, and data-quality remediation now accompany most platform deployments, especially for cross-border banks contending with divergent regulator expectations. These advisory and managed-service layers boost precision, delivering up to 30% better threat capture rates.

By Deployment Mode:
Cloud Scales Compliance EconomicallyCloud platforms accounted for 63.25% of the transaction monitoring market size in 2025 and are projected to grow at 19.28% CAGR through 2031, propelled by elastic throughput and automatic rule updates. Real-time screening across hundreds of millions of transactions has become economically viable for midsize banks and fintechs that previously lacked enterprise-grade infrastructure.
Regulated entities in data-sensitive jurisdictions still blend on-premise cores with cloud analytics, but privacy-enhancing computation is narrowing resistance. As cost-to-serve falls, cloud adoption unlocks adjacent analytics such as customer screening and sanctions testing, reinforcing vendor cross-sell momentum in the transaction monitoring market.
By Application:
Fraud Detection Moves Center StageAML retained 41.65% share in 2025, yet fraud detection & prevention is forecast to outpace at a 20.74% CAGR as instant payment rails expose banks to speed-of-loss risk. Unified FRAML suites bridge historic silos, letting teams correlate transaction anomalies with identity and behavioral red flags in a single casework interface.
Tighter integration shortens investigation cycles and improves recovery odds, positioning fraud-centric feature roadmaps as a prime differentiator. The transaction monitoring market rewards vendors that deliver explainable AI models capable of both regulatory auditability and real-time interdiction.
By Organization Size:
SMEs Join the Compliance MainstreamLarge institutions still contribute 67.85% of 2025 revenue, but SME uptake is accelerating at 20.02% CAGR to 2031 as regulators extend AML obligations to neobanks, PSPs, and credit unions. Cloud-native subscription pricing aligns cost with transaction volumes, allowing smaller firms to adopt enterprise-grade tools without capital outlay.
This democratization expands the overall transaction monitoring market addressable base and fuels a two-tier vendor landscape: incumbents serve complex multinational banks, while challenger platforms tailor simplified rule libraries for SMEs entering regulated payments corridors.
By Industry Vertical:
Retail & E-Commerce Outpaces BFSIBFSI generated 55.75% of transaction monitoring market revenue in 2025; however, the retail & e-commerce segment is projected to advance at 21.78% CAGR as online merchants counter rising card-not-present fraud. High-growth merchant acquirers embed monitoring modules directly within checkout stacks, enabling millisecond-level decisioning that safeguards conversion rates.
Non-financial sectors such as healthcare, telecom, and utilities likewise expand platform usage to guard billing flows and loyalty programs, confirming the broadening relevance of the transaction monitoring market beyond traditional banking confines.
Geography Analysis
North America Transaction Monitoring Market
North America led the transaction monitoring market with a 32.65% share in 2025, supported by FinCEN enforcement activity and sustained technology spending by tier-1 banks. U.S. institutions racing to lower false positives are piloting explainable AI that meets examiner transparency criteria, while Canada’s FinTRAC pushes mid-tier lenders to adopt real-time analytics.
APAC Transaction Monitoring Market
Asia-Pacific is projected to post the highest 17.14% CAGR through 2031 as China, India, and Indonesia digitize payment ecosystems at scale. China’s central-bank mandates drive domestic vendors to embed continuous monitoring into super-app payment infrastructure, whereas India’s UPI ecosystem requires round-the-clock screening to manage micro-transaction volumes. Developed markets such as Japan, South Korea, and Australia focus on AI-based anomaly detection to offset skilled-analyst shortages.
Europe Transaction Monitoring Market
Europe maintains robust growth as 6AMLD harmonizes AML regimes and MiCA extends surveillance to crypto-asset service providers. Germany and France emphasize privacy-preserving analytics to align with GDPR, while the United Kingdom’s FCA levies stiff penalties for tuning lapses, accelerating modern-platform adoption. Pan-European open-banking initiatives simultaneously widen data inputs and complexity, reinforcing demand for API-centric solutions across the transaction monitoring market.
Regulatory Landscape
Transaction monitoring requirements continue to tighten as regulators push risk-based, data-rich controls across traditional finance and newer payment and crypto rails. In the European Union, the 2024 AML package anchored by Regulation (EU) 2024/1624 expands obligations for monitoring systems across services, products, and transactions for a wider set of obliged entities, including crypto-asset service providers and crowdfunding platforms. This reinforces the need for scalable, auditable surveillance across channels.
Supervisory convergence around payments data standards is also shaping technical expectations for monitoring. In December 2024, the Financial Stability Board finalized cross-border payment data alignment recommendations, reinforcing implementation of FATF Recommendation 16 and broader use of ISO 20022 to reduce manual repair and improve information quality for screening and investigation. Separately, FATF updates in 2025 highlighted widening Travel Rule implementation for virtual assets, increasing pressure to connect monitoring, sanctions screening, and beneficiary/originator information across mixed-asset payment flows.
Value Chain Analysis
The transaction monitoring value chain starts with data generation and access: payment processors, banks, fintechs, and merchants create high-volume event streams that must be enriched with customer, account, and counterparty context. Upstream inputs include internal systems (core banking, cards, wallets, case management) and external reference datasets used to lift detection quality, such as OFAC sanctions lists, the GLEIF LEI registry, corporate registries, and trade and shipping data. These external inputs can support trade-based money laundering and sanctions evasion detection. Data integration and quality management sit at the center of value creation, because model performance and alert volumes are heavily determined by completeness of fields, identifiers, and payment-message consistency.
Midstream, vendors provide monitoring engines (rules, typologies, and machine learning), investigation workflows, and reporting, increasingly delivered via cloud platforms for throughput and update velocity. In parallel, SupTech is emerging on the supervisory side as authorities analyze firm submissions and supervisory signals. In August 2025, the European Banking Authority reported that 47% of analyzed AML/CFT technology tools or projects were in production, signaling that supervisory data expectations and structured reporting are becoming more operationalized. Downstream, consultancies and managed service providers tune scenarios, validate models, and operate alert triage, while regulated entities feed SAR/STR outcomes and feedback loops back into the monitoring stack to maintain effectiveness and auditability across jurisdictions.
Competitive Landscape
The transaction monitoring market remains moderately fragmented, featuring legacy enterprise suites from NICE Actimize, Oracle, FICO, SAS, and IBM beside agile RegTech innovators such as Silent Eight, Lucinity, Napier AI, Tookitaki, and Unit21. Competition pivots on model explainability, dynamic scenario updates, and cloud deployment agility.
Strategic M&A is reshaping the field: Fenergo purchased Sentinels to fuse client-lifecycle management with monitoring, while TRM Labs extended coverage to blockchain assets to pre-empt crypto-AML regulation. Large vendors release next-generation engines—NICE Actimize SAM-10 and Google Cloud’s AML AI—showcasing multilayered analytics that map entity networks and automate low-risk case closures.
AI precision is the central battleground. Silent Eight secured regulator sign-off for automated alert closure, highlighting rising trust in black-box models once sufficient validation evidence is provided. Vendors that couple high recall with transparent decision paths are positioned to capture bank budgets as supervisory scrutiny intensifies across the transaction monitoring market.
Transaction Monitoring Industry Leaders
-
Oracle Corporation
-
SAS Institute Inc.
-
Fair Isaac Corporation (FICO)
-
Protiviti Inc.
-
IBM Corporation
- *Disclaimer: Major Players sorted in no particular order
Transaction Monitoring Market Companies Covered in this Report
- NICE Ltd (Actimize)
- Oracle Corp.
- Fair Isaac Corp (FICO)
- SAS Institute Inc.
- IBM Corp.
- Fidelity National Information Services (FIS)
- Fiserv Inc.
- BAE Systems plc
- ACI Worldwide Inc.
- LexisNexis Risk Solutions
- Protiviti Inc.
- Feedzai Inc.
- ComplyAdvantage Ltd
- FeatureSpace Ltd
- Temenos AG
- Napier AI Ltd
- Tookitaki Holding Pte Ltd
- Fenergo Group
- ThetaRay Ltd
- Silent Eight Pte Ltd
Market Opportunities and Future Outlook
A key whitespace is forming around modular AI layers that sit on top of incumbent monitoring engines, targeting lower false positives and faster, regulator-ready investigation output. Experian launched Transaction Forensics in the UK in April 2026 as an AI-powered layer designed to integrate with existing monitoring systems and assess bank-to-bank payment risk. The company cited an 80% false-positive reduction in pilot testing, which points to demand for add-on capabilities that improve signal quality without requiring a full platform replacement.
Regulatory shifts toward effectiveness-focused AML/CFT programs are also pulling spend into governance, documentation, and control testing capabilities that can demonstrate end-to-end monitoring performance. In April 2026, FinCEN and U.S. banking agencies proposed a joint rule to standardize AML/CFT program expectations around risk assessment and oversight of deficiencies, increasing the need for defensible model validation, audit trails, and consistent program controls. Separately, the UK enacted the Money Laundering and Terrorist Financing (Amendment) Regulations 2026, tightening expectations for cryptoasset businesses. This expands opportunity for monitoring providers that can unify fiat and crypto surveillance, incorporate Travel Rule-related data, and strengthen enhanced due diligence workflows within a single compliance stack.
Recent Industry Developments in Transaction Monitoring Market
- April 2026: Oracle added new AI capabilities and agents to its Financial Crime and Compliance Management portfolio, including rights to Lucinity technology to extend agent-driven workflows. Oracle expanded the ability to automate investigative steps and casework within enterprise monitoring programs. This aligns with the market shift toward AI-assisted triage and explainable decisioning.
- May 2025: IBM and Oracle expanded their partnership to advance agentic AI and hybrid cloud, including plans for IBM watsonx Orchestrate AI agent offerings to be available on Oracle Cloud Infrastructure. The expanded interoperability supports transaction monitoring deployments that combine cloud-scale analytics with enterprise data residency and integration needs across large financial institutions.
- September 2024: Oracle launched the Financial Crime and Compliance Management (FCCM) Monitor Cloud Service to provide banks with a centralized dashboard for monitoring and AML reporting. This release reinforced the migration of monitoring workloads to cloud-native services, improving update cadence and scalability for high-velocity payment streams.
Transaction Monitoring Market Report Scope and Research Methodology
Market Definition and Coverage
This market covers annual spending on software and related services that monitor financial transactions and flag suspicious activity for AML, fraud, and compliance needs, across real time and near-real time use cases.
Scope exclusions: We exclude pure-play log management tools, standalone KYC utilities, and general data visualization products that are not used for transaction monitoring decisions.
Segments Covered in This Report
- By Component
- Solutions
- Services
- By Deployment Mode
- Cloud
- On-Premises
- By Application
- Anti-Money Laundering (AML)
- Fraud Detection and Prevention
- Customer Identity Management
- Compliance Management
- Other Niche Use-Cases
- By Organization Size
- Large Enterprises
- Small and Medium Enterprises (SMEs)
- By Industry Vertical
- Banking, Financial Services and Insurance (BFSI)
- Government and Defence
- IT and Telecom
- Retail and E-commerce
- Healthcare
- Energy and Utilities
- Manufacturing
- Others
- By Geography
- North America
- United States
- Canada
- Mexico
- South America
- Brazil
- Argentina
- Rest of South America
- Europe
- United Kingdom
- Germany
- France
- Italy
- Spain
- Russia
- Rest of Europe
- APAC
- China
- Japan
- India
- South Korea
- Australia and New Zealand
- Rest of APAC
- Middle East and Africa
- Middle East
- GCC
- Turkey
- Rest of Middle East
- Africa
- South Africa
- Nigeria
- Rest of Africa
- Middle East
- North America
Data Sources, Market Sizing, and Validation
Desk Research
Desk research was used to set the boundary of what is counted, and to collect anchors that can be checked over time. We referred to public materials such as FATF guidance, FinCEN releases, European Banking Authority publications, BIS and central bank notes, and World Bank financial access indicators, which helped us track policy direction and system-level transaction growth.
To translate those signals into a sizing model, we also reviewed vendor annual reports, investor presentations, product brochures, and trusted coverage in the financial and technology press. Where available, paid subscription company financials and news helped confirm revenue mixes and M&A timing, and a patent database supported directional checks on monitoring and analytics intensity. These examples are not exhaustive, and many other sources were reviewed for data collection, validation, and clarification.
Primary Interviews and Surveys
Primary work focused on explaining what the spend actually includes at the buyer level, and how pricing changes as monitoring rules, alert volumes, and staffing models evolve. We spoke with compliance and fraud teams, risk operations leaders, and solution implementers across major regions so that assumptions on adoption, average contract sizes, and replacement cycles could be corrected and then rechecked.
Distribution of primary research fieldwork respondents
| Company type | Respondent position | Region |
|---|---|---|
| Top tier: 26% | CXOs: 14% | APAC: 46% |
| Mid tier: 54% | Functional/Unit leaders: 35% | EMEA: 29% |
| Smaller Players: 20% | Managers: 51% | Americas: 25% |
Market-Sizing & Forecasting
Our main build uses a top-down approach where regulated-entity demand pools are reconstructed from the number of monitored accounts and payment flows, and then converted into annual spend using realistic per-institution pricing patterns. In practice, this means adoption rates and average annual contract values were mapped by buyer type, before totals were rolled up by region and then consolidated into the global number.
To keep the totals grounded, we corroborated outputs using selective bottom-up approximations, such as sampled vendor revenue exposure to monitoring, channel checks with system integrators, and price-per-module comparisons for cloud versus on-prem deployments. Inputs that mattered most included regulatory intensity (enforcement actions and guidance updates), alert volumes and false-positive pressure, the shift toward real-time payments, typical contract durations and renewal timing, and the mix of software licenses versus managed services. For forecasting, scenario analysis was applied around enforcement momentum and payment digitization speed, then adjusted using expert views on budget prioritization and platform consolidation trends. When bottom-up signals were incomplete for smaller providers, gaps were handled using conservative peer benchmarks and then revalidated in follow-up calls.
Data Validation & Update Cycle
Validation is done through repeated checks that compare the model output with independent signals, such as compliance headcount trends, enforcement patterns, and reported IT risk spend priorities. When a variance looks too wide, assumptions on adoption, pricing, or service attachment are reviewed, and respondents are re-contacted to confirm whether the shift is real or timing-related.
Before sign-off, the model is reviewed in steps by another analyst, followed by a final pass that checks arithmetic consistency, currency conversions, and regional roll-ups. Reports are refreshed annually, and interim updates are made when there are material events, such as major regulatory changes, large acquisitions, or clear pricing resets. Right before delivery, we run a quick update sweep so clients receive the most current view available.
Mordor Intelligence's Transaction Monitoring Market Estimate Compared With Other Published Estimates
Published market values for transaction monitoring can look far apart because each study draws its own line around what counts as monitoring spend and when the base year is set. Differences also show up when some sources treat compliance, fraud, and AML as one combined bucket, while others keep the scope narrower.
By tracking refresh points in enforcement activity and pricing, then rechecking deal scope in expert calls, Mordor Intelligence keeps the transaction monitoring total tied to spending that is directly used to screen and score live financial events, instead of bundling adjacent KYC or generic analytics tools.
Benchmark comparison
| Source | Market Size | Gaps in Research Methodology |
|---|---|---|
| Mordor Intelligence | USD 23.13 B (2026) | |
| Global Consultancy A | USD 20.27 B (2025) | Uses an earlier base year and tends to describe monitoring broadly, which can shift what is counted as core transaction monitoring versus adjacent compliance tooling. |
| Industry Publisher B | USD 19.27 B (2024) | Relies on a different base-year framing and wider segment buckets across applications and industries, which can pull in overlapping spend that some models separate out. |
The spread in the table is mostly explained by timing and scope boundaries, rather than a disagreement on the direction of growth. When the spend counted is limited to transaction screening, scoring, and investigation workflows, and when year and currency timing are kept consistent, the resulting market size becomes easier to replicate and track over updates.
Key Questions Answered in the Report
What is driving double-digit growth in the transaction monitoring market?
Intensifying AML regulation, rapid digital-payment adoption, and AI-driven improvements that lower false positives are the primary growth levers, propelling a 15.74% CAGR through 2031.
How large will the transaction monitoring market be by 2031?
The market is forecast to reach USD 48.06 billion by 2031, up from USD 19.98 billion in 2025.
Which deployment mode is preferred by financial institutions?
Cloud deployment leads with 63.25% 2025 share and is projected to grow at 19.28% CAGR as firms seek scalable, lower-cost compliance.
Why is retail & e-commerce the fastest-growing vertical?
Surging online payments and sophisticated card-not-present fraud push merchants to implement real-time monitoring, supporting a 21.78% CAGR.
How are vendors reducing false-positive alert fatigue?
Vendors integrate machine-learning models and entity-centric analytics that cut false positives by about 40% and automate low-risk alert closure.
What regions are expanding fastest?
Asia-Pacific leads with a 17.14% CAGR thanks to real-time payment expansion, rising regulatory maturity, and large unbanked populations entering digital finance.