
Tractor Market Size and Share
Market Overview
| Study Period | 2020 - 2031 |
|---|---|
| Market Size (2026) | USD 95.03 Billion |
| Market Size (2031) | USD 126.18 Billion |
| Growth Rate (2026 - 2031) | 5.83 % |
| Fastest Growing Market | South America |
| Largest Market | Asia-Pacific |
| Market Concentration | Medium |
Major Players *Disclaimer: Major Players sorted in no particular order Image © Mordor Intelligence. Reuse requires attribution under CC BY 4.0. | |
Tractor Market Analysis by Mordor Intelligence
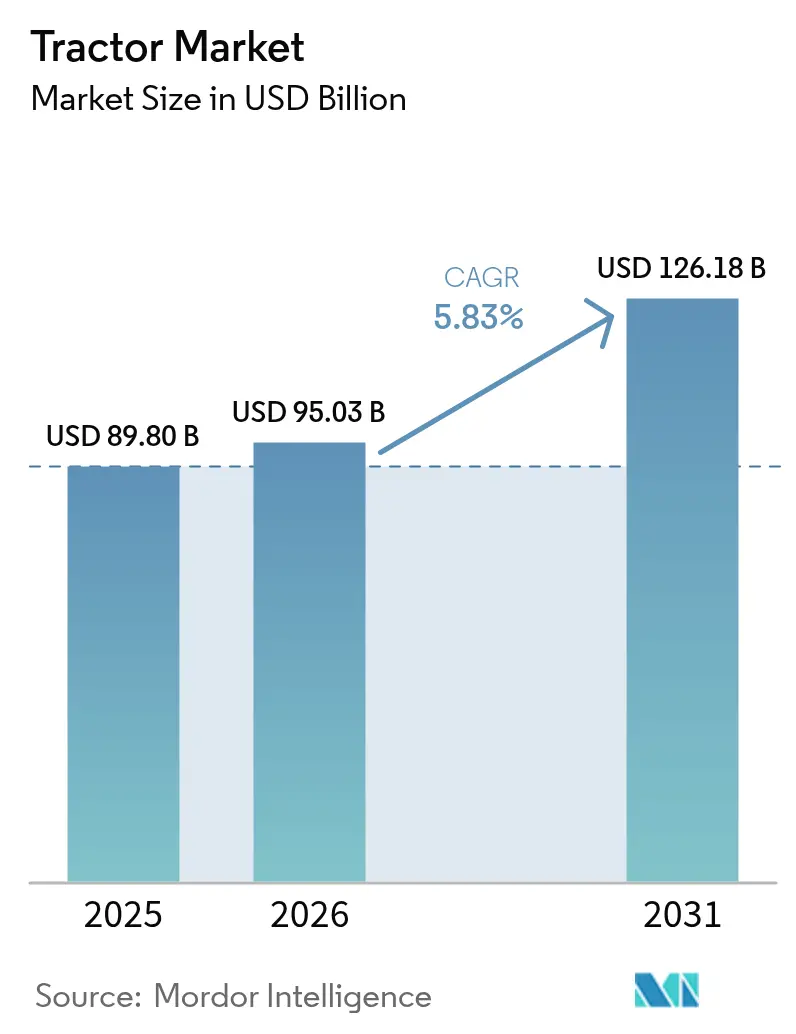
Tractor market size in 2026 is estimated at USD 95.03 billion, growing from 2025 value of USD 89.8 billion with 2031 projections showing USD 126.18 billion, growing at 5.83% CAGR over 2026-2031. A confluence of mechanization demand in emerging economies, rapid precision-ag adoption, and expanding rental models underpins this steady rise. Asia-Pacific dominates volume, while South America records the fastest regional growth, reflecting divergent maturity curves. Power segmentation trends favor 40-100 HP for versatility, yet demand for above-100 HP machines accelerates as farms consolidate. Drive-type choices still lean toward cost-efficient 2WD, but 4WD gains ground where terrain dictates higher traction and data-driven practices require consistent wheel-slip control. Diesel propulsion remains the workhorse, although electric variants are scaling quickly as battery density improves and decarbonization rules tighten.
Key Report Takeaways
- By horsepower, the 40-100 HP class captured 46.93% of global tractor market share in 2025, while above-100 HP units are projected to expand at a 7.16% CAGR through 2031.
- By drive type, 2WD commanded 77.10% revenue share in 2025; 4WD is forecast to post the fastest growth at 7.69% CAGR to 2031.
- By propulsion, diesel engines represented 90.25% of the global tractor market size in 2025, whereas battery-electric platforms are advancing at a 9.05% CAGR during the forecast period (2026-2031).
- By application, agriculture accounted for 88.87% share in 2025, while construction demand is projected to rise at a 7.31% CAGR through 2031.
- By geography, Asia-Pacific held 55.35% of 2025 revenue; South America is set to expand at the highest regional pace, with a 6.89% CAGR through 2031.
Note: Market size and forecast figures in this report are generated using Mordor Intelligence’s proprietary estimation framework, updated with the latest available data and insights as of 2026.
Global Tractor Market Trends and Insights
Drivers Impact Analysis*
| Driver | (~) % Impact on CAGR Forecast | Geographic Relevance | Impact Timeline |
|---|---|---|---|
| Mechanization Demand | +1.8% | Asia-Pacific, Sub-Saharan Africa, South America | Medium term (2-4 yrs) |
| Subsidy and Ag-credit | +1.2% | Global hot spots (India, China, Brazil) | Short term (≤ 2 yrs) |
| Labor Shortages | +1.5% | North America, Europe, China, India | Long term (≥ 4 yrs) |
| Precision-Ag Uptake | +0.9% | North America, Europe, Australia | Medium term (2-4 yrs) |
| Electric Tractors | +0.7% | Europe, North America, select Asia-Pacific | Long term (≥ 4 yrs) |
| Rental Platforms | +0.4% | Global early adopters | Medium term (2-4 yrs) |
| Source: Mordor Intelligence | |||
Rising Mechanization Demand in Emerging Economies
Urban migration and shrinking rural labor pools make mechanization a strategic necessity across Asia and Africa. India’s 40-45% mechanization rate trails China’s 57% and the United States’ 95%, offering clear catch-up potential[1]“Agricultural Policy Monitoring and Evaluation 2024,”, Organisation for Economic Co-operation and Development, oecd.org. New subsidy schemes in China prioritize smart 4WD tractors, promoting a shift toward higher horsepower that lifts per-acre productivity. Cooperative ownership models and equipment-sharing apps further catalyze adoption by spreading costs, while precision-placement benefits such as optimized fertilizer use improve soil health. Collectively, these trends embed tractors as multifunctional assets rather than basic power units, reinforcing long-term demand for the global tractor market.
Escalating Farm-Labor Shortages in OECD and BRICS
United States farmers grapple with a significant labor shortage, leading to heightened wage costs and squeezed profit margins[2]“Farm Labor Markets in 2025,”, U.S. Department of Agriculture Economic Research Service, ers.usda.gov. Similar gaps exist in the European Union and China. Growers respond by accelerating machinery purchases, now adopting labor-saving technology ahead of wage hikes. Autonomous and remotely operated tractors are making significant strides in the realms of horticulture and specialty crop farming, particularly in areas where securing a reliable seasonal workforce has become an ongoing challenge. This persistent labor shortage creates a fundamental baseline for the demand in the global tractor market, underscoring a transformative shift in agricultural practices. As these advanced machines take to the fields, they are not just filling a gap; they are revolutionizing the way crops are cultivated and harvested, opening up new possibilities for efficiency and productivity in an industry in need of innovation.
Rapid Adoption of Precision-Ag and Telematics Platforms
70% of large United States farms use guidance autosteering, which delivers yield gains and input savings that justify higher equipment outlays[3]“Precision Agriculture Technologies,”, U.S. Government Accountability Office, gao.gov. Manufacturers embed 4G/5G modems and over-the-air software, turning tractors into data nodes that support variable-rate seeding, fleet optimization, and predictive maintenance. AGCO’s joint venture with Trimble targets USD 2 billion in precision revenue by 2028 [4]“AGCO and Trimble Form PTx Trimble,”, AGCO Corporation, agcocorp.com. The recent advancements in digital technology significantly enhance the appeal of new tractor models, driving a wave of fleet replacement and invigorating the global tractor market. As these innovations unfold, they not only elevate the overall value proposition but also entice operators to embrace the modern capabilities that promise greater efficiency and productivity in their farming practices.
Growth of Data-Driven Tractor-Rental Platforms
Managing lease fleets like MachineryLink empowers agricultural producers to harness the latest high-performance equipment without burdening their budgets. This approach allows them to allocate their capital more efficiently by distributing fixed costs across shorter usage periods. Through innovative cloud dashboards, growers can seamlessly align machine availability with the critical peaks of planting and harvesting seasons, significantly boosting fleet utilization.
As telematics technology delivers detailed insights into runtime and load factors, the concept of risk-based pricing becomes a viable option, paving the way for quicker adoption of these advanced models. This strategy not only widens the potential market for smallholder farmers but also enhances the cyclical resilience of the global tractor market, ensuring that it remains robust and responsive to varying demands.
Restraints Impact Analysis*
| Restraint | (~) % Impact on CAGR Forecast | Geographic Relevance | Impact Timeline |
|---|---|---|---|
| High Price and Commodity Swings | −1.4% | North America, Europe | Short term (≤ 2 yrs) |
| Seasonal Income Volatility | −0.8% | South Asia, Sub-Saharan Africa, Latin America | Medium term (2-4 yrs) |
| Chip Bottlenecks | −0.6% | Global manufacturing hubs | Short term (≤ 2 yrs) |
| Localization Rules | −0.4% | North America, Europe, Asia-Pacific | Medium term (2-4 yrs) |
| Source: Mordor Intelligence | |||
Electronics-Grade Chip Supply Bottlenecks
The ongoing semiconductor shortages are casting a long shadow over the production of power-train controllers and sensor modules. In early 2025, the lead times for 32-bit microcontrollers soared beyond a staggering 50 weeks, leading to frustrating line stoppages and protracted delivery timelines. While some automotive chip fabrication facilities are finally beginning to open their doors, the strain on capacity persists, limiting the immediate output crucial for the global tractor market. The ripple effects of this constraint are felt deeply, as manufacturers scramble to keep pace with demand amid an increasingly competitive landscape.
New Localization and Content-Origin Rules in Trade Pacts
The United States-Mexico-Canada Agreement (USMCA) content thresholds, along with stringent EU regulations, are forcing manufacturers to dramatically reshape their supply chains. This disruption not only leads to inflated tooling and validation expenses but also creates a ripple effect across the industry. The significant funds diverted towards compliance rob vital capital from crucial research and development efforts, stifling innovation and delaying the launch of new models. As a result, profit margins are squeezed, and the pace of advancements in the global tractor market grinds to a halt, leaving manufacturers grappling with the complexities of navigating an increasingly regulated landscape.
*Our forecasts treat driver/restraint impacts as directional, not additive. The impact forecasts reflect baseline growth, mix effects, and variable interactions.
Segment Analysis
By Horsepower: Farm Consolidation Drives Power Demand
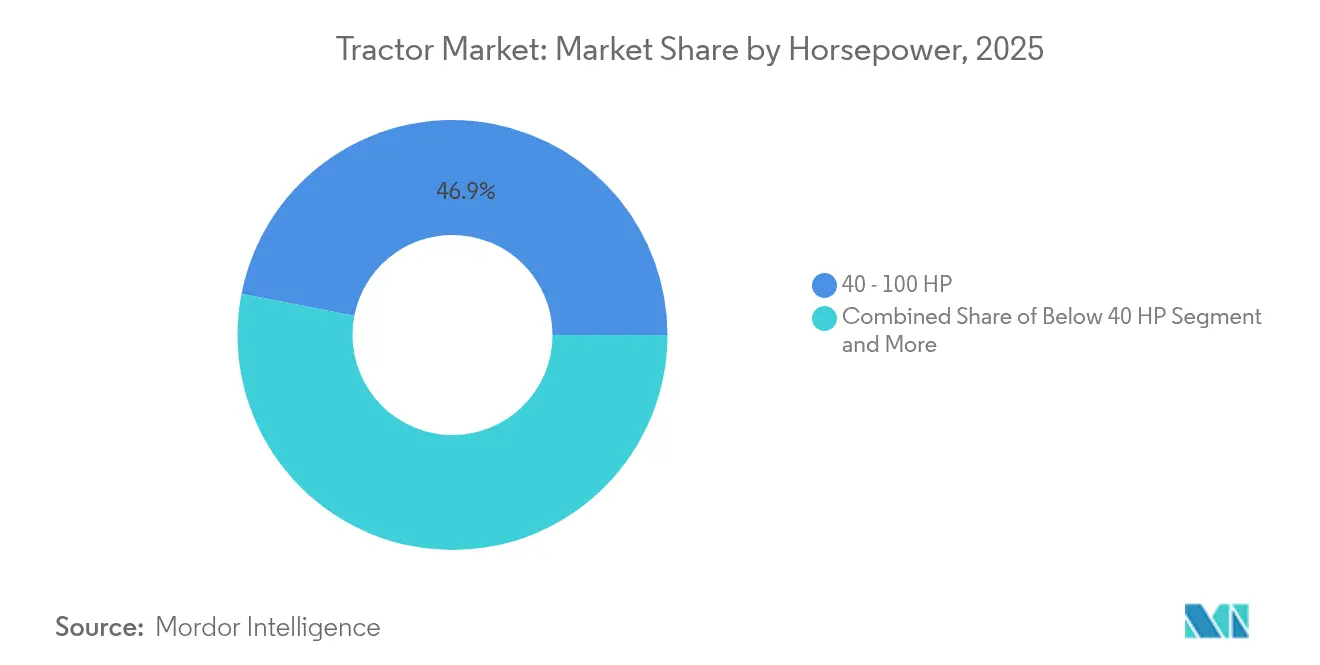
The 40-100 HP class supplied mainstream versatility and claimed 46.93% of the tractor market size in 2025, anchoring the global tractor market. Above-100 HP units are forecast to grow at a 7.16% CAGR during the forecast period, as larger farms seek acreage efficiency. This up-powering supports advanced hydraulic systems and greater implement widths, allowing integrated precision technologies. John Deere’s Iowa expansion to build 9RX machines underscores long-term confidence in significant iron demand.
Farm business models focusing on larger scales harness the power of telematics-driven fleet coordination, transforming horsepower into a catalyst for extraordinary productivity. While smaller tractors with less than 40 HP continue to carve out their niche in the specialized realm of horticulture, the gradual pace of mechanization in micro-plots casts a shadow over their prospects. Consequently, high-horsepower momentum lifts the premium end of the global tractor market size, propelling revenue faster than unit volume.


By Drive Type: Terrain Complexity Favors AWD
Cost-efficient 2WD platforms held a 77.10% share of the tractor market in 2025. Yet 4WD adoption benefits from added traction, distributing torque for tillage under wetter or sloped conditions. The 7.69% CAGR projected for 4WD through 2031 aligns with broader precision-ag uptake, where consistent wheel slip protects seed placement accuracy.
The unpredictable nature of climate variability is reshaping the landscape of agricultural practices, extending the fleeting windows of opportunity for fieldwork when soil moisture levels fall below ideal conditions. This shift underscores the value of Alternate Wetting and Drying (AWD) investments, forging a stronger connection between farmers and innovative solutions. As they strive for year-round cultivation, many are now viewing four-wheel drive (4WD) vehicles as a vital safeguard against the whims of the weather. This evolving mindset deepens the relationship between the adoption of 4WD and the quest for greater profitability, highlighting how essential these advancements have become in navigating the challenges of modern farming.
By Propulsion Type: Electric Transition Accelerates
Diesel remained dominant at 90.25% of the tractor market size in 2025; however, battery platforms expanded rapidly at 9.05% CAGR over the forecast period, as cell costs fell and charging solutions proliferated. Regulations in Europe set strict engine tier standards, redirecting R&D budgets into electric drivelines.
Fleet trials reveal a compelling transformation in the landscape of transportation, demonstrating fuel-cost parity at lower operating hours when electricity comes from renewable sources. As concerns about range anxiety diminish, the economic advantages of electric vehicles become increasingly evident over their entire lifecycle, greatly expanding their potential market. This pivotal shift is not just a minor adjustment; it steadily redirects the vast global tractor market toward innovative zero-emission solutions, while hybrid vehicles satisfy the transitional demand in this evolving ecosystem.

By Application: Construction Diversification Expands
In 2025, agriculture dominated the tractor market, commanding an impressive 88.87% share. However, the dynamic landscape of construction is increasingly steering tractors toward essential roles in grading, material handling, and site preparation. The projected 7.31% CAGR in the construction sector through 2031 is fueled by ambitious infrastructure initiatives in burgeoning economies like Brazil, India, and the United States, paving the way for a robust evolution in the utilization of these powerful machines.
Original equipment manufacturers (OEMs) skillfully tailor loader arms, backhoe attachments, and the ergonomic design of cabs to suit the rugged demands of off-farm environments. This customization not only elevates the functionality of their equipment but also unveils new revenue streams that help mitigate the impacts of fluctuating crop prices in the global tractor market.
Geography Analysis
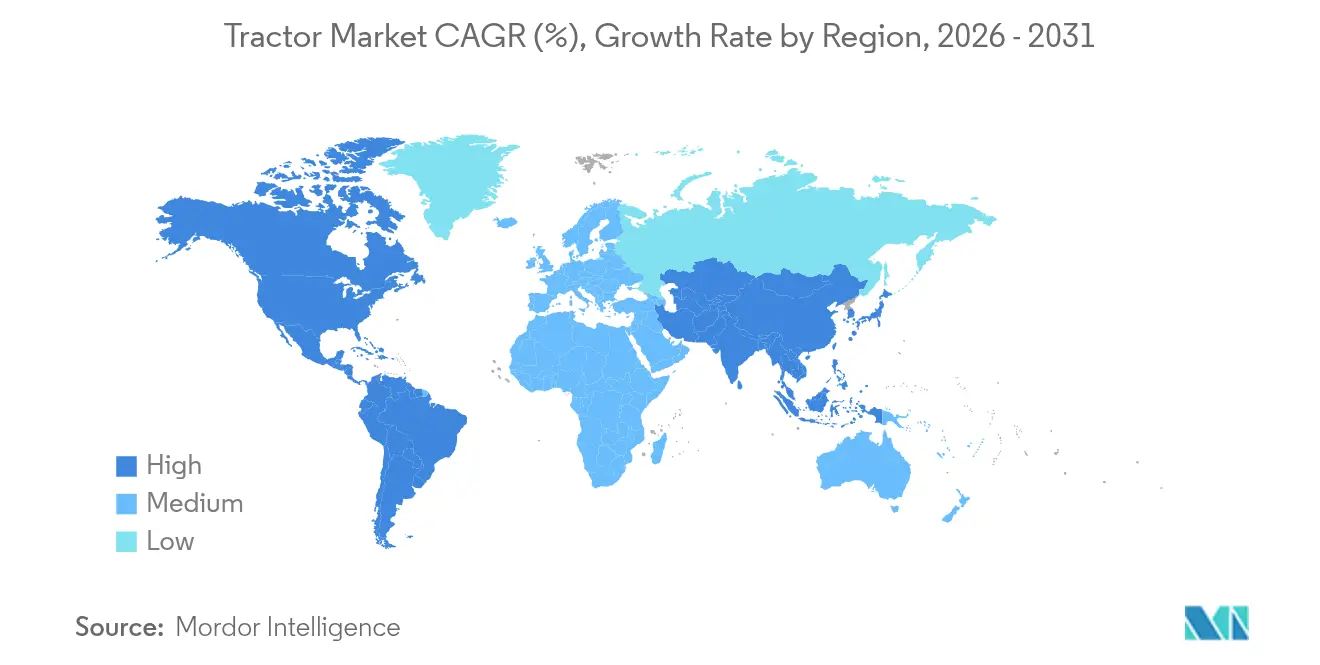
Asia-Pacific contributed 55.35% of the tractor market size in 2025. China remains pivotal as it pivots toward high-horsepower and smart tractors. Southeast Asian governments channel concessional credit into machinery purchases, maintaining a solid growth runway for the global tractor market in the region.
South America delivers the fastest expansion at 6.89% CAGR, buoyed by Brazil’s soy and corn acreage gains and domestic credit lines that spur equipment upgrades. Massey Ferguson, Valtra, and New Holland have a significant share of Brazilian sales, illustrating the influence of localized assembly on customer preference. Chile and Colombia inject incremental demand through fruit-export diversification, reinforcing continental momentum.
North America and Europe showcase well-established markets characterized by a more measured pace of volume growth, yet they boast a higher value per unit. In 2024, European vehicle registrations plummeted to a decade low, reflecting the tightening grip of profitability challenges. Despite this, Europe stands at the forefront of pioneering electric vehicle trials and developing regulatory frameworks for autonomous technology.
Meanwhile, the Middle East and Africa, still in their early stages of market development, are becoming increasingly vital to the long-term expansion and diversity of the global tractor industry. Their strategic importance cannot be understated as they represent emerging opportunities in a landscape ripe for growth.
Mordor Intelligence provides coverage of the tractor market across other key regional markets. Detailed country-level analysis extends to Brazil incorporating local coverage and market participation, as required.

Regulatory Landscape
Emissions and safety compliance are tightening across major tractor-producing regions, increasing engineering complexity for OEMs and suppliers. In the United States, EPA nonroad engine requirements such as Tier 4 (40 CFR 1039.101) continue to shape diesel aftertreatment and calibration strategies for off-highway equipment, while the EPA also finalized Phase 3 greenhouse gas standards for heavy-duty highway vehicles in March 2024, reinforcing the broader direction of fleet decarbonization and efficiency regulation that influences technology roadmaps and component sourcing.
In Europe, the regulatory framework for agricultural and forestry vehicles under EU type-approval continues to evolve beyond powertrain emissions into functional safety. The European Commission adopted Delegated Regulation (EU) 2025/1117, updating braking and functional safety requirements for agricultural and forestry vehicles, including changes tied to hydraulic braking configurations for new tractor approvals. India also moved to tighten tractor emissions: the Ministry of Road Transport and Highways notified the Central Motor Vehicles (Eleventh Amendment) Rules, 2026, mandating TREM Stage-V emission standards for agricultural tractors (56 kW to 560 kW) effective October 1, 2026, pushing additional demand for advanced aftertreatment, onboard diagnostics, and compliant engine variants across the domestic product mix.
Value Chain Analysis
The tractor value chain spans raw materials (steel, castings, tires) through high-value subsystems (engines and transmissions, hydraulics, axles, electronics and sensors) to OEM assembly, distribution, and lifecycle services. Global production is multipolar, with major manufacturing and assembly hubs across India, China, Europe, North America, and Brazil, supported by tiered supplier ecosystems for drivetrains, hydraulics, and increasingly telematics and software. Major OEMs such as Deere, CNH Industrial, and AGCO differentiate through integrated precision-ag and connected-machine stacks, while cost-competitive Asian manufacturers such as Mahindra scale volume with localized sourcing and broad dealer coverage.
Value capture is shifting toward software-enabled capabilities and semiconductor-dependent electronics (guidance, telematics modems, controllers), which also represent a key fragility in the chain. The report context highlights that in early 2025, lead times for 32-bit microcontrollers exceeded 50 weeks, creating production stoppages and delivery delays for electronics-heavy tractor configurations. In parallel, supplier participation is broadening as Tier 1 automotive suppliers pivot capabilities (power electronics, thermal management, electrified driveline components) into off-highway applications, while localization and content-origin rules (for example, under USMCA and EU requirements) add tooling, validation, and sourcing complexity that favors vertically integrated OEMs and well-capitalized supplier networks.
Competitive Landscape
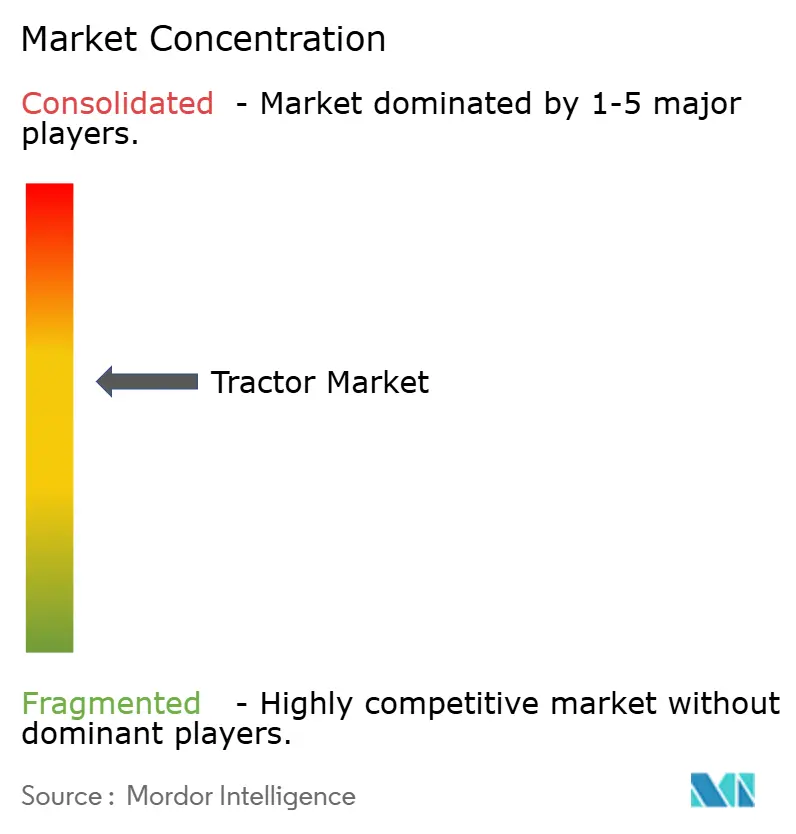
The global tractor market is moderately concentrated: the major players account for a significant share of worldwide revenue, conferring procurement leverage yet leaving space for regional challengers. Deere, CNH Industrial, AGCO, Kubota, and Mahindra differentiate through proprietary precision stacks, autonomous roadmaps, and integrated finance arms. Technology partnerships are intensifying; AGCO’s USD 2 billion acquisition of Trimble’s ag unit vaults it into retrofit autonomy leadership. Deere’s USD 20 billion United States investment earmarks new 9RX capacity and battery R&D, fortifying its premium offering.
Regional specialists exploit localized after-sales networks and price competitiveness, defending share in Southeast Asia and Africa. Rental platforms add another layer of rivalry by decoupling equipment access from ownership, potentially diluting OEM brand loyalty. Component shortages and policy-driven localization raise operating complexity, rewarding vertically integrated players that can buffer supply disruptions. Overall, strategic focus has shifted from horsepower escalation toward software ecosystems and electrification, redefining success factors inside the global tractor industry.
Tractor Industry Leaders
Mahindra & Mahindra Ltd.
Deere & Company
CNH Industrial N.V.
Kubota Corporation
AGCO Corporation
- *Disclaimer: Major Players sorted in no particular order

Market Opportunities and Future Outlook
Electrification, autonomy-ready electronics, and connected service models are opening practical whitespace in both agriculture and adjacent off-highway use cases. Battery-electric tractors and hybrid architectures benefit from regulatory pressure on diesel emissions and the growing integration of telematics, guidance, and over-the-air software into mainstream platforms. In the United States, 70% of large farms already use guidance autosteering (GAO), supporting an upgrade cycle toward tractors that function as data nodes for variable-rate work, fleet utilization, and predictive maintenance. OEM strategies such as AGCO's PTx Trimble initiative targeting USD 2 billion in precision revenue by 2028 further underline the commercial pull for bundled hardware plus software and retrofit pathways across mixed fleets.
Construction-linked demand diversification remains an actionable opportunity alongside agriculture, given tractors expanding roles in grading, material handling, and site preparation, and OEM attachment ecosystems (loader arms, backhoes, cabs) that increase addressable applications. Evidence of capacity localization in heavy equipment supply chains, such as LiuGong India's expanded Pithampur facility in July 2026 (capacity raised from 3,250 to 7,500 machines annually) and SANY's new Campinas plant in Brazil with 3,500 units of initial annual capacity, signals how OEMs and equipment makers are aligning local manufacturing footprints with regional infrastructure and resource project pipelines. For tractor OEMs, similar localization, financing, and dealer-led service investments can strengthen competitiveness where procurement preferences, import duties, and content rules increasingly influence purchase decisions.
Recent Industry Developments
- July 2026: Deere upgrades 6R and 6M Series tractors with improved comfort, control, and productivity features. The refresh supports replacement demand in core mid-horsepower bands and helps Deere defend share as buyers place more weight on operator experience and integrated technology.
- February 2026: Deere launches new 8R and 8RX tractor models with horsepower options up to 540 HP and an updated Intelligent Power Management system. The move strengthens Deere's position in high-horsepower segments where farm consolidation and wider implements increase the value of power, traction, and precision-ready features.
- March 2024: EPA finalizes Phase 3 greenhouse gas standards for heavy-duty highway vehicles, reinforcing the broader decarbonization trajectory and shaping diesel aftertreatment and calibration approaches for off-highway equipment.


Research Methodology Framework and Report Scope
Market Definition and Coverage
For this methodology, the tractors market is defined as revenue generated from new tractor equipment sold for farm and related off-road use, measured in USD value across major tractor power classes and drive configurations.
Scope exclusions: This sizing excludes used tractor resale transactions, most attachments and implements sold separately, and ongoing service, finance, and insurance revenues.
Segmentation Overview
- By Horsepower
- Below 40 HP
- 40 - 100 HP
- Above 100 HP
- By Drive Type
- Two-Wheel Drive (2WD)
- Four-/All-Wheel Drive (4WD/AWD)
- By Propulsion Type
- Diesel
- Battery-Electric
- Hybrid (Diesel-Electric)
- By Application
- Agriculture
- Construction
- Forestry
- Municipal & Grounds Maintenance
- Haulage & Logistics
- By Geography
- North America
- United States
- Canada
- Rest of North America
- South America
- Brazil
- Argentina
- Rest of South America
- Europe
- Germany
- United Kingdom
- France
- Italy
- Spain
- Russia
- Rest of Europe
- Asia-Pacific
- China
- India
- Japan
- South Korea
- Australia
- Rest of Asia-Pacific
- Middle-East and Africa
- United Arab Emirates
- Saudi Arabia
- Turkey
- Egypt
- South Africa
- Rest of Middle-East and Africa
- North America
Data Sources, Market Sizing, and Validation
Desk Research
Desk research was used to set the market boundary and to build reference points for demand, supply, and pricing. We relied on public statistical series and industry documentation that can be checked, such as FAOSTAT for agriculture context, UN Comtrade for tractor trade flows, and government vehicle registration or farm mechanization releases where available.
To keep assumptions grounded, we also reviewed manufacturer annual reports and investor presentations for regional mix and product positioning, along with association and regulator websites that track machinery adoption and emissions compliance. When needed, paid subscriptions for company financials and intelligence, news and financials, and shipment-level import and export data were used to sanity-check trends like unit cycles and ASP movement. The sources listed here are illustrative, and additional public references were reviewed to clarify gaps, validate data points, and confirm definitions.
Primary Interviews and Surveys
Primary discussions were run with a mix of OEM-side leaders, distributors and dealers, farm equipment buyers, and independent service and rental contacts, so the model reflects how demand and pricing behave in real purchase decisions. Coverage was kept broad across the main tractor consuming regions, and interview feedback was used to confirm power-band demand, 2WD versus 4WD adoption, discounting patterns, and the timing of new model launches that can shift revenue by year.
Distribution of primary research fieldwork respondents
| Company type | Respondent position | Region |
|---|---|---|
| Top tier: 34% | CXOs: 12% | APAC: 41% |
| Mid tier: 50% | Functional/Unit leaders: 33% | EMEA: 36% |
| Smaller Players: 16% | Managers: 55% | Americas: 23% |
Market-Sizing & Forecasting
The core build uses a top-down approach where the demand pool is reconstructed by region using tractor unit indicators and then translated into value through realistic ASP bands by horsepower and drive type. After the regional totals are formed, they are further filtered through factors that move revenue year to year, including replacement cycles, the share shift between below 40 HP, 40 to 100 HP, and above 100 HP, and the mix change between 2WD and 4WD as farms consolidate.
To keep the totals believable, we cross-check the output with selective bottom-up approximations, such as sampled OEM and dealer revenue splits, channel checks on delivery volumes, and ASP x volume spot builds for a few major countries when data is available. Typical inputs include tractor import and export values, farm income and subsidy signals that influence purchase timing, acreage and crop mix trends that affect horsepower choice, and inflation and currency movement that can reprice equipment in USD terms. Forecasting is done through scenario analysis supported by expert consensus on variables like financing tightness, emission-related cost pass-through, and the pace of electrification in smaller power bands, and then the scenarios are blended into a single base case.
Where bottom-up evidence is incomplete for certain regions or sub-classes, the gaps are handled through proportioning using the most stable signals available, followed by a second pass to ensure shares add up across power and drive categories without creating unrealistic jumps.
Data Validation & Update Cycle
Before results are finalized, the model is checked against independent signals that should move in the same direction, such as trade value, unit cycle commentary, and region-level mechanization indicators. If a country shows an unusual swing, the drivers are traced back to the input assumptions, and then relevant respondents are re-contacted when the variance cannot be explained through published data.
A multi-step internal review is followed, where another analyst tests the math flow, checks year-to-year continuity, and looks for segment totals that do not reconcile. Reports refresh annually, and interim updates are made when material events occur, such as policy changes affecting farm equipment subsidies or sharp currency moves in large tractor markets. Right before delivery, we perform a fresh pass so clients receive the latest updated view available.
Mordor Intelligence's Tractors Market Estimate Compared With Other Published Estimates
Published tractor market values can differ even when they appear to cover the same topic, because each publisher sets its own boundary for what counts as tractor revenue and which year is treated as the anchor.
The spread usually comes from practical choices like whether only new equipment is counted, how horsepower bands are grouped, whether the value reflects factory-level pricing versus broader channel pricing, and how currency conversion is timed when local prices move quickly.
Benchmark comparison
| Source | Market Size | Gaps in Research Methodology |
|---|---|---|
| Mordor Intelligence | USD 95.03 B (2026) | |
| Global Research Marketplace A | USD 84.80 B (2024) | This figure is anchored to an earlier base year, and the coverage may blend adjacent off-road equipment classes or use different price timing, which can pull the USD value down when compared year to year. |
| Global Publisher B | USD 78.50 B (2025) | The estimate appears to use a wider end-use framing and a longer horizon, and it may apply a different ASP progression path that smooths near-term pricing and discount cycles. |
The table indicates that the main gap is driven by base-year choice and what is priced into the revenue line, and in Mordor Intelligence's model the value is tied to new tractor equipment sales and then checked against horsepower and drive mix signals so the total stays consistent with observed unit and pricing movement.


Key Questions Answered in the Report
What is the current value of the global tractor market?
The global tractor market size reached USD 95.03 billion in 2026 and is forecast to top USD 126.18 billion by 2031.
Which segment is growing fastest by horsepower?
Tractors above 100 HP are projected to grow at 7.16% CAGR as farms consolidate and demand higher field capacity.
How quickly are electric tractors being adopted?
Battery-electric models are expanding at a 9.05% CAGR, the highest among all propulsion types, supported by emission regulations and lower operating costs.
Which segment is growing fastest by propulsion?
As cell costs declined and charging solutions became more widespread, battery platforms experienced a robust expansion, growing at a rate of 9.05% CAGR during the forecast period. This growth is attributed to battery technology advancements, increased electric vehicle adoption, and the rising demand for energy storage solutions across various industries.
Page last updated on:


 Your data is secure and never sold or shared.


