Market Overview
| Study Period | 2017 - 2030 |
| Base Year For Estimation | 2024 |
| Forecast Data Period | 2025 - 2030 |
| Market Size (2025) | USD 1 Billion |
| Market Size (2030) | USD 1.34 Billion |
| Growth Rate (2025 - 2030) | 5.96% CAGR |
| Market Concentration | Medium |
Major Players*Disclaimer: Major Players sorted in no particular order Image © Mordor Intelligence. Reuse requires attribution under CC BY 4.0. |
|

Tomato Seed Market Analysis
The Tomato Seed Market size is estimated at 1 billion USD in 2025, and is expected to reach 1.34 billion USD by 2030, growing at a CAGR of 5.96% during the forecast period (2025-2030).
The tomato seeds industry continues to evolve amid changing agricultural practices and technological advancements in seed development. Tomatoes maintain their position as a crucial vegetable crop globally, representing approximately 16.4% of global vegetable production with an overall production volume of 189.1 million metric tons. The increasing adoption of protected cultivation methods and greenhouse technologies has transformed traditional farming practices, particularly in major producing regions. This shift has been accompanied by significant investments in research and development for developing climate-resilient and high-yielding varieties, reflecting the industry's response to changing environmental conditions.
The industry has witnessed substantial technological innovations in seed development, particularly in disease resistance and yield improvement. In 2023, major seed companies including Rijk Zwaan and HM Clause introduced new tomato varieties with resistance to the Tomato Brown Rugose Fruit Virus (ToBRFV), addressing one of the most significant challenges facing tomato cultivation globally. The tomato seeds segment has emerged as a crucial component of the global vegetable seeds industry, accounting for 12.4% of the global vegetable seed market in 2022, highlighting its strategic importance in global agriculture.
Protected cultivation has become increasingly prevalent, with greenhouse production methods gaining significant traction across major producing regions. This trend is particularly evident in countries like China, where greenhouse cultivation accounts for more than 50% of total tomato production. The shift towards protected cultivation has been accompanied by increased investments in high-tech farming solutions, including hydroponics and vertical farming systems, which require specialized greenhouse tomato seeds adapted to controlled environment agriculture.
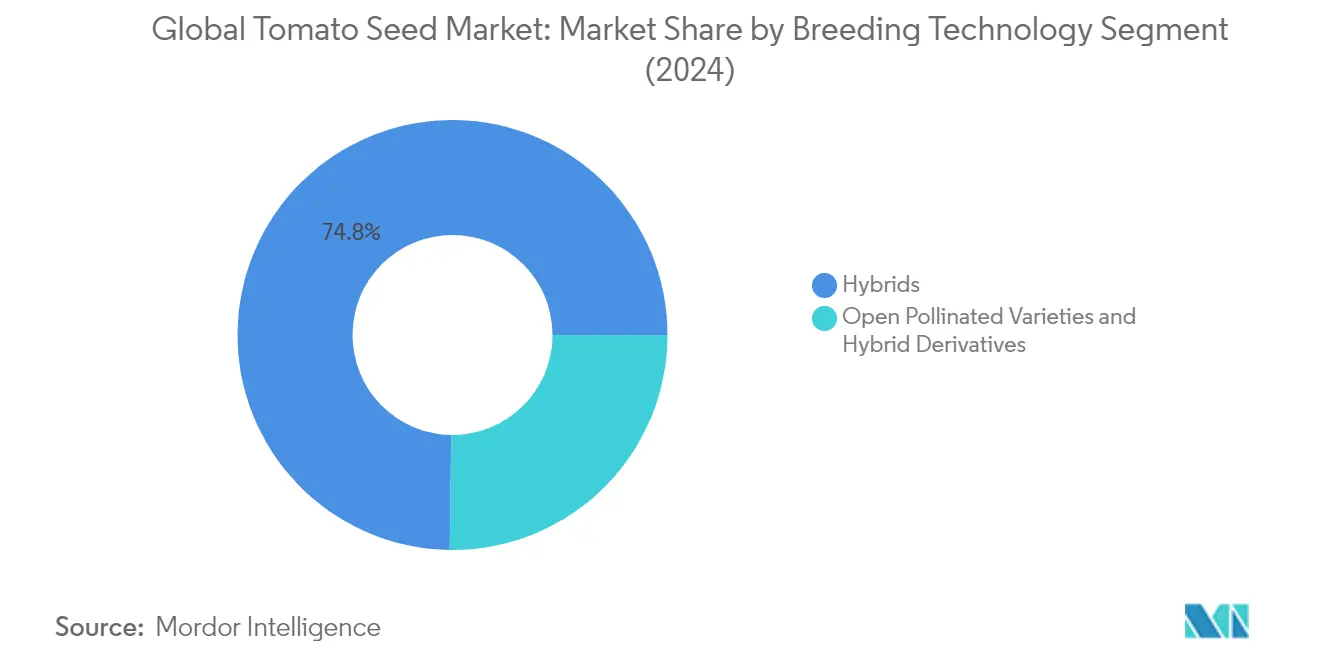
The industry has experienced a significant transformation in seed technology preferences, with hybrid tomato seeds dominating the market landscape. Hybrid varieties accounted for 72.7% of the global tomato seeds market in 2022, reflecting growers' preference for seeds offering superior traits such as disease resistance, improved shelf life, and higher yields. This trend has been supported by continuous innovations in breeding techniques and the development of commercial tomato seeds specifically designed for different cultivation methods and end-use applications, from fresh market consumption to processing industries.
Global Tomato Seed Market Trends
The increase in demand for tomatoes from various industries and the growing consumption are driving the tomato cultivation area
- Tomato is one of the major vegetable crops cultivated and consumed globally. The overall area under cultivation of tomatoes increased by 8.0% between 2017 and 2022. This increase is mainly attributed to the growing demand from the various food processing industries and increasing consumption worldwide.
- Asia-Pacific holds the largest area under tomato cultivation with 2.6 million ha, accounting for about 47.1% of the global tomato acreage in 2022. China and India were the top countries with major tomato-cultivated areas in the region, with 1.1 million and 0.8 million ha, respectively, in 2022. China and India are the world’s top countries in tomato production, and they have huge domestic and export demand. Africa is the second-largest region, accounting for 28.7% area of the world’s tomato acreage in 2022. In Africa, the cultivated area increased by 14.5% between 2017 and 2022. Nigeria accounted for 54.8% of the total tomato acreage in the region in 2022 due to higher demand in the country.
- In 2022, Europe held 10.6% of the global tomato acreage. Turkey is the largest country, with 28.2% of the total European tomato acreage in the same year. Turkey is one of the largest producers of tomatoes in the world. Moreover, North America accounted for 4.1% of the world’s tomato acreage in 2022. The United States is the major country, which held about 49.4% of the region's tomato area in the same year. South America accounted for 2.2% of the world’s tomato acreage in 2022. Brazil alone held more than 42% of the total tomato acreage in the region during the same year. The increase in demand for tomatoes from various industries is anticipated to drive tomato acreage globally during the forecast period.

Understand The Key Trends Shaping This Market
Download PDF
The expanding tomato seed market is driven by the increasing demand for disease-resistant and widely adaptable seed varieties
- Tomato is one of the largest segments of vegetables because of the high-value crop and high demand by processing industries for tomato puree, ketchup, and others. Major companies, such as Syngenta, Rijk Zwaan, and Enza Zaden, have more than 40% tomato seed varieties available globally that are resistant to viral diseases such as the leaf curl virus.
- Traits with resistance to viral diseases such as tomato mosaic virus, tomato yellow leaf curl virus, blossom end rot, powdery mildew, wilt diseases, and nematodes are popularly used for cultivation. Asia-Pacific is one of the largest tomato-producing regions, and major companies such as Rijk Zwaan, East-West Seed, and Namdhari Seeds have tomato seed varieties in the region that are resistant to viral diseases such as leaf curl virus. For instance, in 2022, Rijk Zwaan launched new tomato seed varieties resistant to the Tomato Brown Rugose Fruit Virus (ToBRFV). Moreover, in 2022, HM. Clause, a business unit of Limagrain, introduced a tomato variety that is resistant to the highly transmissible ToBRFV.
- Tomato varieties with extended shelf life, uniformity, cracking tolerance, and wider adaptability to different soils and climatic conditions are in high demand. Companies such as Bayer, Syngenta, and Rijk Zwaan offer seed varieties such as Kierano, Aurea, Angelle, Tontolle, and Cheramy RZ F1 to produce high-quality tomatoes in different agro conditions.
- The introduction of new hybrid seed varieties by companies with higher resistance to viruses, adaptability to different weather conditions, and high demand by processing industries are the factors expected to help in the growth of the tomato seed market during the forecast period.

OTHER KEY INDUSTRY TRENDS COVERED IN THE REPORT
- Hybrid breeding dominated the tomato seed market with the increased demand for varieties that have higher disease resistance and tolerance to biotic and abiotic stresses
Segment Analysis: Breeding Technology
Hybrids Segment in Global Tomato Seed Market
The hybrid tomato seeds segment dominates the global tomato seed market, commanding approximately 75% of the total market share in 2024. This significant market position is primarily attributed to the superior characteristics of hybrid seeds, including enhanced disease resistance, increased shelf life, higher yield potential, and wider adaptability to different growing conditions. Hybrid seeds are particularly favored in protected cultivation settings, where they demonstrate exceptional performance and consistent quality. The segment's dominance is further strengthened by continuous innovation in breeding technologies, leading to the development of varieties with improved traits such as resistance to tomato yellow leaf curl virus, bacterial wilt, and early blight. Major seed companies are actively investing in research and development to introduce new hybrid varieties that offer better stress tolerance and improved fruit quality, thereby maintaining the segment's strong market position.
Open Pollinated Varieties & Hybrid Derivatives Segment in Global Tomato Seed Market
The open pollinated varieties and hybrid derivatives segment maintains a significant presence in the global tomato seed market, particularly in developing regions where cost considerations play a crucial role in seed selection. This segment is especially important in organic tomato seeds farming systems and traditional agricultural practices, where farmers value the ability to save and replant seeds. The segment's appeal lies in its lower cost structure compared to hybrids, making it an accessible option for small-scale farmers and regions with limited agricultural resources. These varieties are particularly valued for their adaptation to local growing conditions and their role in maintaining genetic diversity in tomato cultivation. The segment continues to serve specific market niches, particularly in regions where traditional farming practices predominate and where there is a strong focus on preserving local varieties.
Segment Analysis: Cultivation Mechanism
Open Field Segment in Global Tomato Seed Market
The open field cultivation segment dominates the global tomato seed market, accounting for approximately 91% market share in 2024. This significant market position is attributed to several factors including lower initial investment requirements compared to protected cultivation methods, making it more accessible to farmers worldwide. Open field cultivation remains particularly prevalent in developing regions where traditional farming practices are still widely employed. The segment's dominance is further strengthened by the availability of both commercial tomato seeds and open-pollinated varieties suitable for open field conditions, offering farmers flexibility in seed selection based on their specific needs and budget constraints. In regions like Asia-Pacific, open field cultivation accounts for over 90% of tomato production, driven by favorable climatic conditions and the presence of large agricultural lands suitable for tomato cultivation.
Protected Cultivation Segment in Global Tomato Seed Market
The protected cultivation segment is experiencing rapid growth in the global tomato seed market, projected to expand at approximately 7% CAGR from 2024 to 2029. This growth is primarily driven by increasing adoption of greenhouse tomato seeds and controlled environment agriculture technologies, particularly in regions facing adverse climatic conditions. Protected cultivation offers numerous advantages including year-round production capability, better disease management, and higher yield potential. The segment is witnessing significant technological advancements with the integration of hydroponic tomato seeds, vertical farming, and climate control systems. Companies such as DC Farms and Bowery Farming are actively expanding their greenhouse operations across various regions, indicating a strong trend towards protected cultivation methods. The segment's growth is further supported by rising demand for premium quality tomatoes and increasing preference for pesticide-free produce among consumers.
Tomato Seed Market Geography Segment Analysis
Tomato Seed Market in Africa
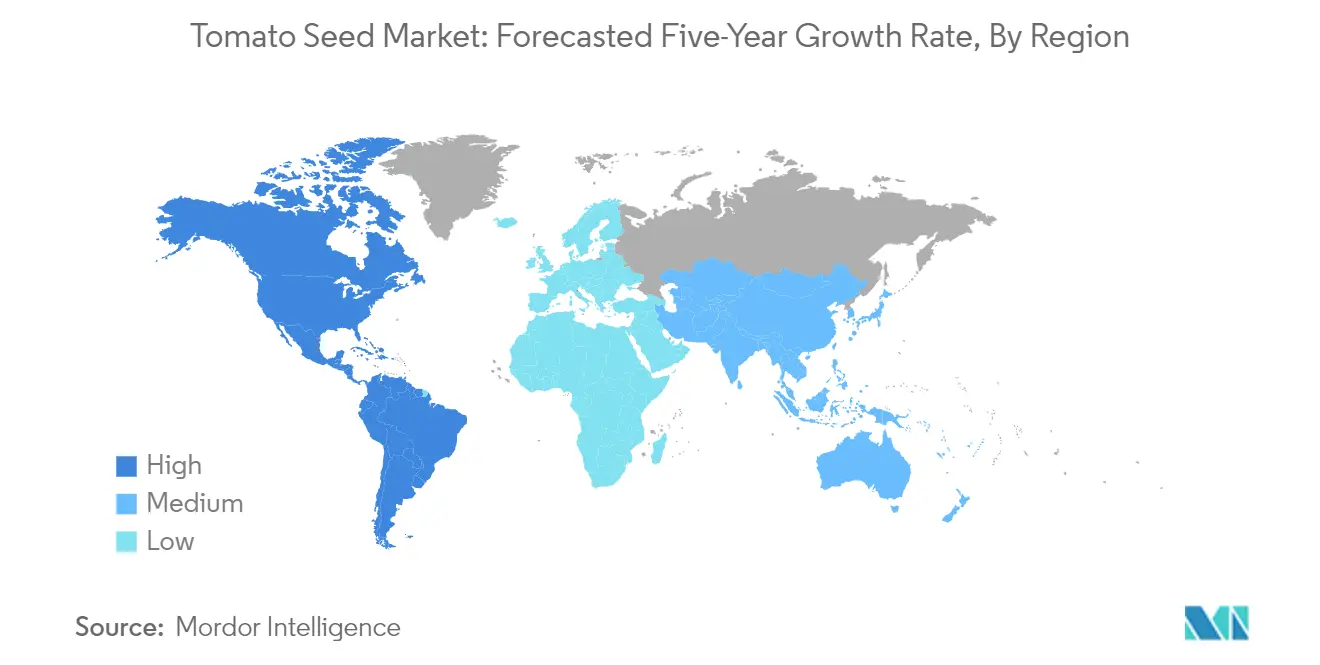
The African tomato seeds market demonstrates significant diversity across its key markets, including Egypt, Ethiopia, Ghana, Kenya, Nigeria, South Africa, and Tanzania. The region's tomato cultivation is predominantly characterized by open-field farming practices, with a gradual shift towards protected cultivation in certain advanced markets. The market dynamics are influenced by factors such as increasing demand from processing industries, growing adoption of hybrid seeds, and government initiatives to promote commercial farming practices across various countries in the region.Tomato Seed Market in NigeriaNigeria dominates the African tomato seeds market landscape, holding approximately 84% of the regional market share in 2024. The country's prominence is attributed to its extensive cultivation area and favorable climatic conditions that support tomato production throughout the year. Major tomato-producing areas are concentrated in states like Kano, Taraba, Gombe, Bauchi, and Kaduna, where both commercial and smallholder farmers actively engage in tomato cultivation.Tomato Seed Market in EthiopiaEthiopia emerges as the fastest-growing market in the African region, projected to grow at approximately 8% CAGR from 2024 to 2029. The country's growth is driven by increasing adoption of commercial hybrid seeds, expanding cultivation area, and rising demand from both domestic consumption and processing industries. The government's support through agricultural modernization initiatives and improved access to quality seeds has been instrumental in driving market growth.
Tomato Seed Market in Asia-Pacific
The Asia-Pacific region represents a diverse and dynamic market for tomato seeds, encompassing major agricultural economies such as China, India, Japan, and emerging markets like Vietnam and Thailand. The region demonstrates a strong mix of traditional and modern farming practices, with increasing adoption of protected cultivation and hybrid varieties. Countries like Australia, Bangladesh, Indonesia, Myanmar, Pakistan, and the Philippines contribute significantly to the regional market dynamics through their unique agricultural practices and market demands.Tomato Seed Market in ChinaChina stands as the dominant force in the Asia-Pacific tomato seeds market, commanding approximately 51% of the regional market share in 2024. The country's leadership position is supported by its extensive greenhouse cultivation infrastructure, strong research and development capabilities, and large-scale commercial farming operations. Shandong, Xinjiang, Hebei, and Henan provinces serve as the primary tomato-producing regions, driving significant demand for high-quality seeds.Tomato Seed Market in BangladeshBangladesh emerges as the fastest-growing market in the Asia-Pacific region, with a projected growth rate of approximately 6% from 2024 to 2029. The country's rapid market expansion is driven by increasing adoption of modern farming techniques, rising demand for fresh tomatoes, and growing awareness about high-yielding varieties among farmers. The Bangladesh Agricultural Research Institute's efforts in developing and disseminating improved varieties have significantly contributed to market growth.
Tomato Seed Market in Europe
The Europe tomato seeds market showcases a sophisticated landscape with advanced agricultural practices across countries including France, Germany, Italy, the Netherlands, Poland, Romania, Russia, Spain, Turkey, Ukraine, and the United Kingdom. The region is characterized by high adoption rates of protected cultivation, a strong emphasis on research and development, and stringent quality standards for seed production and distribution.Tomato Seed Market in RussiaRussia maintains its position as the largest Europe tomato seeds market, driven by extensive cultivation areas and increasing investments in modern agricultural technologies. The country's market leadership is supported by strong domestic demand, growing export opportunities, and government initiatives promoting agricultural self-sufficiency.Tomato Seed Market in ItalyItaly demonstrates the most dynamic growth in the European region, supported by its strong processing industry and advanced agricultural practices. The country's growth is driven by increasing demand for specialized varieties, growing adoption of protected cultivation, and strong export markets for processed tomato products.
Tomato Seed Market in Middle East
The Middle Eastern tomato seed market, primarily represented by Iran and Saudi Arabia, showcases unique characteristics shaped by challenging climatic conditions and increasing adoption of protected cultivation technologies. Iran emerges as the largest market in the region, while Saudi Arabia demonstrates the fastest growth rate, driven by significant investments in agricultural technology and protected cultivation systems.
Tomato Seed Market in North America
The North American tomato seed market, encompassing Canada, Mexico, and the United States, represents a technologically advanced and highly organized sector. The region demonstrates strong adoption of hybrid varieties and protected cultivation practices, with the United States emerging as both the largest and fastest-growing market in the region.
Tomato Seed Market in South America
The South American tomato seed market, primarily driven by Argentina and Brazil, demonstrates strong potential for growth through increasing adoption of hybrid varieties and modern cultivation practices. Brazil maintains its position as both the largest and fastest-growing market in the region, supported by extensive cultivation areas and strong demand from processing industries.
Get Analysis on Important Geographic Markets
Download PDF
Tomato Seed Industry Overview
Top Companies in Tomato Seed Market
The global tomato seeds industry is characterized by companies actively pursuing product innovation, particularly in developing disease-resistant varieties and enhanced traits. Major players are focusing on creating varieties resistant to the Tomato Brown Rugose Fruit Virus (ToBRFV) and other emerging pathogens, while also improving characteristics like shelf life, yield potential, and adaptability to different growing conditions. Companies are expanding their research and development capabilities through strategic partnerships and collaborations with agricultural institutions. Operational agility is demonstrated through investments in advanced breeding technologies and the establishment of regional breeding stations to develop locally adapted varieties. Market leaders are strengthening their distribution networks and technical support services to enhance farmer engagement and market penetration across different regions.
Consolidated Market Led By Global Players
The tomato seeds industry exhibits a highly consolidated structure dominated by multinational agricultural companies with diverse product portfolios. These major players leverage their extensive research capabilities, established distribution networks, and strong brand recognition to maintain their market positions. The market is characterized by the presence of both integrated agricultural conglomerates offering comprehensive solutions and specialized seed companies focusing exclusively on vegetable seeds. Regional players maintain a significant presence in specific markets through their understanding of local growing conditions and farmer preferences.
Merger and acquisition activities in the sector are primarily driven by the need to acquire new technologies, expand geographical presence, and enhance product portfolios. Companies are particularly interested in acquiring businesses with strong breeding programs or innovative technologies that can accelerate variety development. The trend of consolidation is expected to continue as larger companies seek to strengthen their market position and smaller players look for strategic partnerships to remain competitive in an increasingly technology-driven market.
Innovation and Adaptation Drive Future Success
Success in the tomato seeds industry increasingly depends on companies' ability to develop varieties that address emerging challenges while meeting evolving consumer preferences. Market leaders are investing in advanced breeding technologies, including molecular markers and gene editing, to accelerate the development of improved varieties. Companies are also focusing on building stronger relationships with farmers through comprehensive support programs, including technical assistance and market linkages. The ability to adapt products to specific regional requirements while maintaining consistent quality across global operations is becoming a crucial differentiator.
For new entrants and smaller players, success lies in identifying and serving niche market segments with specialized varieties. Companies need to focus on developing strong intellectual property portfolios and establishing efficient seed production and quality control systems. Building relationships with local distributors and agricultural extension services is crucial for market penetration. The regulatory environment, particularly regarding new breeding technologies and variety registration, continues to shape market dynamics and investment decisions. Companies must also address the growing emphasis on sustainable agriculture and climate resilience in their breeding programs to maintain long-term competitiveness. The demand for tomato seeds industry is expected to grow as companies innovate to meet these evolving needs.
Tomato Seed Market Leaders
-
BASF SE
-
Bayer AG
-
Groupe Limagrain
-
Rijk Zwaan Zaadteelt en Zaadhandel BV
-
Syngenta Group
- *Disclaimer: Major Players sorted in no particular order

Need More Details on Market Players and Competitors?
Download PDF
Tomato Seed Market News
- December 2022: Rijk Zwaan launched its first tomato varieties with high resistance to tomato brown rugose fruit virus (ToBRFV) and are compatible with all commercially available rootstocks.
- October 2022: HM Clause, a business unit of Groupe Limagrain, launched its first tomato varieties resistant to Tomato Brown Rugose Fruit Virus (ToBRFV) into the market.
- June 2021: East West Seed introduced a new tomato hybrid seed variety, EW 815, in India. This variety offers resistance to bacterial wilt and tomato yellow leaf curl disease. Additionally, EW 815 can withstand adverse weather conditions during the rainy season, making it an ideal choice for tomato farming in wet conditions.
Free With This Report
We provide a complimentary and exhaustive set of data points on regional and country-level metrics that present the fundamental structure of the industry. Presented in the form of 90+ free charts, the section covers difficult-to-find data from various regions regarding the area under cultivation for different crops within the scope


List of Tables & Figures
- Figure 1:
- AREA UNDER CULTIVATION OF TOMATO, HECTARE, GLOBAL, 2017-2022
- Figure 2:
- VALUE SHARE OF MAJOR TOMATO TRAITS, %, GLOBAL, 2022
- Figure 3:
- VALUE SHARE OF TOMATO BREEDING TECHNIQUES, %, GLOBAL, 2022
- Figure 4:
- VOLUME OF TOMATO SEED, METRIC TON, GLOBAL, 2017 - 2030
- Figure 5:
- VALUE OF TOMATO SEED, USD, GLOBAL, 2017 - 2030
- Figure 6:
- VOLUME OF TOMATO SEED BY BREEDING TECHNOLOGY CATEGORIES, METRIC TON, GLOBAL, 2017 - 2030
- Figure 7:
- VALUE OF TOMATO SEED BY BREEDING TECHNOLOGY CATEGORIES, USD, GLOBAL, 2017 - 2030
- Figure 8:
- VOLUME SHARE OF TOMATO SEED BY BREEDING TECHNOLOGY CATEGORIES, %, GLOBAL, 2017 VS 2023 VS 2030
- Figure 9:
- VALUE SHARE OF TOMATO SEED BY BREEDING TECHNOLOGY CATEGORIES, %, GLOBAL, 2017 VS 2023 VS 2030
- Figure 10:
- VOLUME OF HYBRIDS TOMATO SEED, METRIC TON, GLOBAL, 2017 - 2030
- Figure 11:
- VALUE OF HYBRIDS TOMATO SEED, USD, GLOBAL, 2017 - 2030
- Figure 12:
- VALUE SHARE OF HYBRIDS TOMATO SEED BY COUNTRY, %, GLOBAL, 2023 AND 2030
- Figure 13:
- VOLUME OF OPEN POLLINATED VARIETIES & HYBRID DERIVATIVES TOMATO SEED, METRIC TON, GLOBAL, 2017 - 2030
- Figure 14:
- VALUE OF OPEN POLLINATED VARIETIES & HYBRID DERIVATIVES TOMATO SEED, USD, GLOBAL, 2017 - 2030
- Figure 15:
- VALUE SHARE OF OPEN POLLINATED VARIETIES & HYBRID DERIVATIVES TOMATO SEED BY COUNTRY, %, GLOBAL, 2023 AND 2030
- Figure 16:
- VOLUME OF TOMATO SEED BY CULTIVATION MECHANISM CATEGORIES, METRIC TON, GLOBAL, 2017 - 2030
- Figure 17:
- VALUE OF TOMATO SEED BY CULTIVATION MECHANISM CATEGORIES, USD, GLOBAL, 2017 - 2030
- Figure 18:
- VOLUME SHARE OF TOMATO SEED BY CULTIVATION MECHANISM CATEGORIES, %, GLOBAL, 2017 VS 2023 VS 2030
- Figure 19:
- VALUE SHARE OF TOMATO SEED BY CULTIVATION MECHANISM CATEGORIES, %, GLOBAL, 2017 VS 2023 VS 2030
- Figure 20:
- VOLUME OF TOMATO SEED SOWN IN OPEN FIELD, METRIC TON, GLOBAL, 2017 - 2030
- Figure 21:
- VALUE OF TOMATO SEED SOWN IN OPEN FIELD, USD, GLOBAL, 2017 - 2030
- Figure 22:
- VALUE SHARE OF SEEDS SOWN IN OPEN FIELD BY BREEDING TECHNOLOGY, %, GLOBAL, 2023 AND 2030
- Figure 23:
- VOLUME OF TOMATO SEED SOWN IN PROTECTED CULTIVATION, METRIC TON, GLOBAL, 2017 - 2030
- Figure 24:
- VALUE OF TOMATO SEED SOWN IN PROTECTED CULTIVATION, USD, GLOBAL, 2017 - 2030
- Figure 25:
- VALUE SHARE OF SEEDS SOWN IN PROTECTED CULTIVATION BY BREEDING TECHNOLOGY, %, GLOBAL, 2023 AND 2030
- Figure 26:
- VOLUME OF TOMATO SEED BY REGION, METRIC TON, GLOBAL, 2017 - 2030
- Figure 27:
- VALUE OF TOMATO SEED BY REGION, USD, GLOBAL, 2017 - 2030
- Figure 28:
- VOLUME SHARE OF TOMATO SEED BY REGION, %, GLOBAL, 2017 VS 2023 VS 2030
- Figure 29:
- VALUE SHARE OF TOMATO SEED BY REGION, %, GLOBAL, 2017 VS 2023 VS 2030
- Figure 30:
- VOLUME OF TOMATO SEED BY BREEDING TECHNOLOGY CATEGORIES, METRIC TON, AFRICA, 2017 - 2030
- Figure 31:
- VALUE OF TOMATO SEED BY BREEDING TECHNOLOGY CATEGORIES, USD, AFRICA, 2017 - 2030
- Figure 32:
- VOLUME SHARE OF TOMATO SEED BY BREEDING TECHNOLOGY CATEGORIES, %, AFRICA, 2017 VS 2023 VS 2030
- Figure 33:
- VALUE SHARE OF TOMATO SEED BY BREEDING TECHNOLOGY CATEGORIES, %, AFRICA, 2017 VS 2023 VS 2030
- Figure 34:
- VOLUME OF TOMATO SEED BY CULTIVATION MECHANISM CATEGORIES, METRIC TON, AFRICA, 2017 - 2030
- Figure 35:
- VALUE OF TOMATO SEED BY CULTIVATION MECHANISM CATEGORIES, USD, AFRICA, 2017 - 2030
- Figure 36:
- VOLUME SHARE OF TOMATO SEED BY CULTIVATION MECHANISM CATEGORIES, %, AFRICA, 2017 VS 2023 VS 2030
- Figure 37:
- VALUE SHARE OF TOMATO SEED BY CULTIVATION MECHANISM CATEGORIES, %, AFRICA, 2017 VS 2023 VS 2030
- Figure 38:
- VOLUME OF TOMATO SEED BY COUNTRY, METRIC TON, AFRICA, 2017 - 2030
- Figure 39:
- VALUE OF TOMATO SEED BY COUNTRY, USD, AFRICA, 2017 - 2030
- Figure 40:
- VOLUME SHARE OF TOMATO SEED BY COUNTRY, %, AFRICA, 2017 VS 2023 VS 2030
- Figure 41:
- VALUE SHARE OF TOMATO SEED BY COUNTRY, %, AFRICA, 2017 VS 2023 VS 2030
- Figure 42:
- VOLUME OF EGYPT TOMATO SEED, METRIC TON, AFRICA, 2017 - 2030
- Figure 43:
- VALUE OF EGYPT TOMATO SEED, USD, AFRICA, 2017 - 2030
- Figure 44:
- VALUE SHARE OF EGYPT TOMATO SEED BY BREEDING TECHNOLOGY, %, AFRICA, 2023 AND 2030
- Figure 45:
- VOLUME OF ETHIOPIA TOMATO SEED, METRIC TON, AFRICA, 2017 - 2030
- Figure 46:
- VALUE OF ETHIOPIA TOMATO SEED, USD, AFRICA, 2017 - 2030
- Figure 47:
- VALUE SHARE OF ETHIOPIA TOMATO SEED BY BREEDING TECHNOLOGY, %, AFRICA, 2023 AND 2030
- Figure 48:
- VOLUME OF GHANA TOMATO SEED, METRIC TON, AFRICA, 2017 - 2030
- Figure 49:
- VALUE OF GHANA TOMATO SEED, USD, AFRICA, 2017 - 2030
- Figure 50:
- VALUE SHARE OF GHANA TOMATO SEED BY BREEDING TECHNOLOGY, %, AFRICA, 2023 AND 2030
- Figure 51:
- VOLUME OF KENYA TOMATO SEED, METRIC TON, AFRICA, 2017 - 2030
- Figure 52:
- VALUE OF KENYA TOMATO SEED, USD, AFRICA, 2017 - 2030
- Figure 53:
- VALUE SHARE OF KENYA TOMATO SEED BY BREEDING TECHNOLOGY, %, AFRICA, 2023 AND 2030
- Figure 54:
- VOLUME OF NIGERIA TOMATO SEED, METRIC TON, AFRICA, 2017 - 2030
- Figure 55:
- VALUE OF NIGERIA TOMATO SEED, USD, AFRICA, 2017 - 2030
- Figure 56:
- VALUE SHARE OF NIGERIA TOMATO SEED BY BREEDING TECHNOLOGY, %, AFRICA, 2023 AND 2030
- Figure 57:
- VOLUME OF SOUTH AFRICA TOMATO SEED, METRIC TON, AFRICA, 2017 - 2030
- Figure 58:
- VALUE OF SOUTH AFRICA TOMATO SEED, USD, AFRICA, 2017 - 2030
- Figure 59:
- VALUE SHARE OF SOUTH AFRICA TOMATO SEED BY BREEDING TECHNOLOGY, %, AFRICA, 2023 AND 2030
- Figure 60:
- VOLUME OF TANZANIA TOMATO SEED, METRIC TON, AFRICA, 2017 - 2030
- Figure 61:
- VALUE OF TANZANIA TOMATO SEED, USD, AFRICA, 2017 - 2030
- Figure 62:
- VALUE SHARE OF TANZANIA TOMATO SEED BY BREEDING TECHNOLOGY, %, AFRICA, 2023 AND 2030
- Figure 63:
- VOLUME OF REST OF AFRICA TOMATO SEED, METRIC TON, AFRICA, 2017 - 2030
- Figure 64:
- VALUE OF REST OF AFRICA TOMATO SEED, USD, AFRICA, 2017 - 2030
- Figure 65:
- VALUE SHARE OF REST OF AFRICA TOMATO SEED BY BREEDING TECHNOLOGY, %, AFRICA, 2023 AND 2030
- Figure 66:
- VOLUME OF TOMATO SEED BY BREEDING TECHNOLOGY CATEGORIES, METRIC TON, ASIA-PACIFIC, 2017 - 2030
- Figure 67:
- VALUE OF TOMATO SEED BY BREEDING TECHNOLOGY CATEGORIES, USD, ASIA-PACIFIC, 2017 - 2030
- Figure 68:
- VOLUME SHARE OF TOMATO SEED BY BREEDING TECHNOLOGY CATEGORIES, %, ASIA-PACIFIC, 2017 VS 2023 VS 2030
- Figure 69:
- VALUE SHARE OF TOMATO SEED BY BREEDING TECHNOLOGY CATEGORIES, %, ASIA-PACIFIC, 2017 VS 2023 VS 2030
- Figure 70:
- VOLUME OF TOMATO SEED BY CULTIVATION MECHANISM CATEGORIES, METRIC TON, ASIA-PACIFIC, 2017 - 2030
- Figure 71:
- VALUE OF TOMATO SEED BY CULTIVATION MECHANISM CATEGORIES, USD, ASIA-PACIFIC, 2017 - 2030
- Figure 72:
- VOLUME SHARE OF TOMATO SEED BY CULTIVATION MECHANISM CATEGORIES, %, ASIA-PACIFIC, 2017 VS 2023 VS 2030
- Figure 73:
- VALUE SHARE OF TOMATO SEED BY CULTIVATION MECHANISM CATEGORIES, %, ASIA-PACIFIC, 2017 VS 2023 VS 2030
- Figure 74:
- VOLUME OF TOMATO SEED BY COUNTRY, METRIC TON, ASIA-PACIFIC, 2017 - 2030
- Figure 75:
- VALUE OF TOMATO SEED BY COUNTRY, USD, ASIA-PACIFIC, 2017 - 2030
- Figure 76:
- VOLUME SHARE OF TOMATO SEED BY COUNTRY, %, ASIA-PACIFIC, 2017 VS 2023 VS 2030
- Figure 77:
- VALUE SHARE OF TOMATO SEED BY COUNTRY, %, ASIA-PACIFIC, 2017 VS 2023 VS 2030
- Figure 78:
- VOLUME OF AUSTRALIA TOMATO SEED, METRIC TON, ASIA-PACIFIC, 2017 - 2030
- Figure 79:
- VALUE OF AUSTRALIA TOMATO SEED, USD, ASIA-PACIFIC, 2017 - 2030
- Figure 80:
- VALUE SHARE OF AUSTRALIA TOMATO SEED BY BREEDING TECHNOLOGY, %, ASIA-PACIFIC, 2023 AND 2030
- Figure 81:
- VOLUME OF BANGLADESH TOMATO SEED, METRIC TON, ASIA-PACIFIC, 2017 - 2030
- Figure 82:
- VALUE OF BANGLADESH TOMATO SEED, USD, ASIA-PACIFIC, 2017 - 2030
- Figure 83:
- VALUE SHARE OF BANGLADESH TOMATO SEED BY BREEDING TECHNOLOGY, %, ASIA-PACIFIC, 2023 AND 2030
- Figure 84:
- VOLUME OF CHINA TOMATO SEED, METRIC TON, ASIA-PACIFIC, 2017 - 2030
- Figure 85:
- VALUE OF CHINA TOMATO SEED, USD, ASIA-PACIFIC, 2017 - 2030
- Figure 86:
- VALUE SHARE OF CHINA TOMATO SEED BY BREEDING TECHNOLOGY, %, ASIA-PACIFIC, 2023 AND 2030
- Figure 87:
- VOLUME OF INDIA TOMATO SEED, METRIC TON, ASIA-PACIFIC, 2017 - 2030
- Figure 88:
- VALUE OF INDIA TOMATO SEED, USD, ASIA-PACIFIC, 2017 - 2030
- Figure 89:
- VALUE SHARE OF INDIA TOMATO SEED BY BREEDING TECHNOLOGY, %, ASIA-PACIFIC, 2023 AND 2030
- Figure 90:
- VOLUME OF INDONESIA TOMATO SEED, METRIC TON, ASIA-PACIFIC, 2017 - 2030
- Figure 91:
- VALUE OF INDONESIA TOMATO SEED, USD, ASIA-PACIFIC, 2017 - 2030
- Figure 92:
- VALUE SHARE OF INDONESIA TOMATO SEED BY BREEDING TECHNOLOGY, %, ASIA-PACIFIC, 2023 AND 2030
- Figure 93:
- VOLUME OF JAPAN TOMATO SEED, METRIC TON, ASIA-PACIFIC, 2017 - 2030
- Figure 94:
- VALUE OF JAPAN TOMATO SEED, USD, ASIA-PACIFIC, 2017 - 2030
- Figure 95:
- VALUE SHARE OF JAPAN TOMATO SEED BY BREEDING TECHNOLOGY, %, ASIA-PACIFIC, 2023 AND 2030
- Figure 96:
- VOLUME OF MYANMAR TOMATO SEED, METRIC TON, ASIA-PACIFIC, 2017 - 2030
- Figure 97:
- VALUE OF MYANMAR TOMATO SEED, USD, ASIA-PACIFIC, 2017 - 2030
- Figure 98:
- VALUE SHARE OF MYANMAR TOMATO SEED BY BREEDING TECHNOLOGY, %, ASIA-PACIFIC, 2023 AND 2030
- Figure 99:
- VOLUME OF PAKISTAN TOMATO SEED, METRIC TON, ASIA-PACIFIC, 2017 - 2030
- Figure 100:
- VALUE OF PAKISTAN TOMATO SEED, USD, ASIA-PACIFIC, 2017 - 2030
- Figure 101:
- VALUE SHARE OF PAKISTAN TOMATO SEED BY BREEDING TECHNOLOGY, %, ASIA-PACIFIC, 2023 AND 2030
- Figure 102:
- VOLUME OF PHILIPPINES TOMATO SEED, METRIC TON, ASIA-PACIFIC, 2017 - 2030
- Figure 103:
- VALUE OF PHILIPPINES TOMATO SEED, USD, ASIA-PACIFIC, 2017 - 2030
- Figure 104:
- VALUE SHARE OF PHILIPPINES TOMATO SEED BY BREEDING TECHNOLOGY, %, ASIA-PACIFIC, 2023 AND 2030
- Figure 105:
- VOLUME OF THAILAND TOMATO SEED, METRIC TON, ASIA-PACIFIC, 2017 - 2030
- Figure 106:
- VALUE OF THAILAND TOMATO SEED, USD, ASIA-PACIFIC, 2017 - 2030
- Figure 107:
- VALUE SHARE OF THAILAND TOMATO SEED BY BREEDING TECHNOLOGY, %, ASIA-PACIFIC, 2023 AND 2030
- Figure 108:
- VOLUME OF VIETNAM TOMATO SEED, METRIC TON, ASIA-PACIFIC, 2017 - 2030
- Figure 109:
- VALUE OF VIETNAM TOMATO SEED, USD, ASIA-PACIFIC, 2017 - 2030
- Figure 110:
- VALUE SHARE OF VIETNAM TOMATO SEED BY BREEDING TECHNOLOGY, %, ASIA-PACIFIC, 2023 AND 2030
- Figure 111:
- VOLUME OF REST OF ASIA-PACIFIC TOMATO SEED, METRIC TON, ASIA-PACIFIC, 2017 - 2030
- Figure 112:
- VALUE OF REST OF ASIA-PACIFIC TOMATO SEED, USD, ASIA-PACIFIC, 2017 - 2030
- Figure 113:
- VALUE SHARE OF REST OF ASIA-PACIFIC TOMATO SEED BY BREEDING TECHNOLOGY, %, ASIA-PACIFIC, 2023 AND 2030
- Figure 114:
- VOLUME OF TOMATO SEED BY BREEDING TECHNOLOGY CATEGORIES, METRIC TON, EUROPE, 2017 - 2030
- Figure 115:
- VALUE OF TOMATO SEED BY BREEDING TECHNOLOGY CATEGORIES, USD, EUROPE, 2017 - 2030
- Figure 116:
- VOLUME SHARE OF TOMATO SEED BY BREEDING TECHNOLOGY CATEGORIES, %, EUROPE, 2017 VS 2023 VS 2030
- Figure 117:
- VALUE SHARE OF TOMATO SEED BY BREEDING TECHNOLOGY CATEGORIES, %, EUROPE, 2017 VS 2023 VS 2030
- Figure 118:
- VOLUME OF TOMATO SEED BY CULTIVATION MECHANISM CATEGORIES, METRIC TON, EUROPE, 2017 - 2030
- Figure 119:
- VALUE OF TOMATO SEED BY CULTIVATION MECHANISM CATEGORIES, USD, EUROPE, 2017 - 2030
- Figure 120:
- VOLUME SHARE OF TOMATO SEED BY CULTIVATION MECHANISM CATEGORIES, %, EUROPE, 2017 VS 2023 VS 2030
- Figure 121:
- VALUE SHARE OF TOMATO SEED BY CULTIVATION MECHANISM CATEGORIES, %, EUROPE, 2017 VS 2023 VS 2030
- Figure 122:
- VOLUME OF TOMATO SEED BY COUNTRY, METRIC TON, EUROPE, 2017 - 2030
- Figure 123:
- VALUE OF TOMATO SEED BY COUNTRY, USD, EUROPE, 2017 - 2030
- Figure 124:
- VOLUME SHARE OF TOMATO SEED BY COUNTRY, %, EUROPE, 2017 VS 2023 VS 2030
- Figure 125:
- VALUE SHARE OF TOMATO SEED BY COUNTRY, %, EUROPE, 2017 VS 2023 VS 2030
- Figure 126:
- VOLUME OF FRANCE TOMATO SEED, METRIC TON, EUROPE, 2017 - 2030
- Figure 127:
- VALUE OF FRANCE TOMATO SEED, USD, EUROPE, 2017 - 2030
- Figure 128:
- VALUE SHARE OF FRANCE TOMATO SEED BY BREEDING TECHNOLOGY, %, EUROPE, 2023 AND 2030
- Figure 129:
- VOLUME OF GERMANY TOMATO SEED, METRIC TON, EUROPE, 2017 - 2030
- Figure 130:
- VALUE OF GERMANY TOMATO SEED, USD, EUROPE, 2017 - 2030
- Figure 131:
- VALUE SHARE OF GERMANY TOMATO SEED BY BREEDING TECHNOLOGY, %, EUROPE, 2023 AND 2030
- Figure 132:
- VOLUME OF ITALY TOMATO SEED, METRIC TON, EUROPE, 2017 - 2030
- Figure 133:
- VALUE OF ITALY TOMATO SEED, USD, EUROPE, 2017 - 2030
- Figure 134:
- VALUE SHARE OF ITALY TOMATO SEED BY BREEDING TECHNOLOGY, %, EUROPE, 2023 AND 2030
- Figure 135:
- VOLUME OF NETHERLANDS TOMATO SEED, METRIC TON, EUROPE, 2017 - 2030
- Figure 136:
- VALUE OF NETHERLANDS TOMATO SEED, USD, EUROPE, 2017 - 2030
- Figure 137:
- VALUE SHARE OF NETHERLANDS TOMATO SEED BY BREEDING TECHNOLOGY, %, EUROPE, 2023 AND 2030
- Figure 138:
- VOLUME OF POLAND TOMATO SEED, METRIC TON, EUROPE, 2017 - 2030
- Figure 139:
- VALUE OF POLAND TOMATO SEED, USD, EUROPE, 2017 - 2030
- Figure 140:
- VALUE SHARE OF POLAND TOMATO SEED BY BREEDING TECHNOLOGY, %, EUROPE, 2023 AND 2030
- Figure 141:
- VOLUME OF ROMANIA TOMATO SEED, METRIC TON, EUROPE, 2017 - 2030
- Figure 142:
- VALUE OF ROMANIA TOMATO SEED, USD, EUROPE, 2017 - 2030
- Figure 143:
- VALUE SHARE OF ROMANIA TOMATO SEED BY BREEDING TECHNOLOGY, %, EUROPE, 2023 AND 2030
- Figure 144:
- VOLUME OF RUSSIA TOMATO SEED, METRIC TON, EUROPE, 2017 - 2030
- Figure 145:
- VALUE OF RUSSIA TOMATO SEED, USD, EUROPE, 2017 - 2030
- Figure 146:
- VALUE SHARE OF RUSSIA TOMATO SEED BY BREEDING TECHNOLOGY, %, EUROPE, 2023 AND 2030
- Figure 147:
- VOLUME OF SPAIN TOMATO SEED, METRIC TON, EUROPE, 2017 - 2030
- Figure 148:
- VALUE OF SPAIN TOMATO SEED, USD, EUROPE, 2017 - 2030
- Figure 149:
- VALUE SHARE OF SPAIN TOMATO SEED BY BREEDING TECHNOLOGY, %, EUROPE, 2023 AND 2030
- Figure 150:
- VOLUME OF TURKEY TOMATO SEED, METRIC TON, EUROPE, 2017 - 2030
- Figure 151:
- VALUE OF TURKEY TOMATO SEED, USD, EUROPE, 2017 - 2030
- Figure 152:
- VALUE SHARE OF TURKEY TOMATO SEED BY BREEDING TECHNOLOGY, %, EUROPE, 2023 AND 2030
- Figure 153:
- VOLUME OF UKRAINE TOMATO SEED, METRIC TON, EUROPE, 2017 - 2030
- Figure 154:
- VALUE OF UKRAINE TOMATO SEED, USD, EUROPE, 2017 - 2030
- Figure 155:
- VALUE SHARE OF UKRAINE TOMATO SEED BY BREEDING TECHNOLOGY, %, EUROPE, 2023 AND 2030
- Figure 156:
- VOLUME OF UNITED KINGDOM TOMATO SEED, METRIC TON, EUROPE, 2017 - 2030
- Figure 157:
- VALUE OF UNITED KINGDOM TOMATO SEED, USD, EUROPE, 2017 - 2030
- Figure 158:
- VALUE SHARE OF UNITED KINGDOM TOMATO SEED BY BREEDING TECHNOLOGY, %, EUROPE, 2023 AND 2030
- Figure 159:
- VOLUME OF REST OF EUROPE TOMATO SEED, METRIC TON, EUROPE, 2017 - 2030
- Figure 160:
- VALUE OF REST OF EUROPE TOMATO SEED, USD, EUROPE, 2017 - 2030
- Figure 161:
- VALUE SHARE OF REST OF EUROPE TOMATO SEED BY BREEDING TECHNOLOGY, %, EUROPE, 2023 AND 2030
- Figure 162:
- VOLUME OF TOMATO SEED BY BREEDING TECHNOLOGY CATEGORIES, METRIC TON, MIDDLE EAST, 2017 - 2030
- Figure 163:
- VALUE OF TOMATO SEED BY BREEDING TECHNOLOGY CATEGORIES, USD, MIDDLE EAST, 2017 - 2030
- Figure 164:
- VOLUME SHARE OF TOMATO SEED BY BREEDING TECHNOLOGY CATEGORIES, %, MIDDLE EAST, 2017 VS 2023 VS 2030
- Figure 165:
- VALUE SHARE OF TOMATO SEED BY BREEDING TECHNOLOGY CATEGORIES, %, MIDDLE EAST, 2017 VS 2023 VS 2030
- Figure 166:
- VOLUME OF TOMATO SEED BY CULTIVATION MECHANISM CATEGORIES, METRIC TON, MIDDLE EAST, 2017 - 2030
- Figure 167:
- VALUE OF TOMATO SEED BY CULTIVATION MECHANISM CATEGORIES, USD, MIDDLE EAST, 2017 - 2030
- Figure 168:
- VOLUME SHARE OF TOMATO SEED BY CULTIVATION MECHANISM CATEGORIES, %, MIDDLE EAST, 2017 VS 2023 VS 2030
- Figure 169:
- VALUE SHARE OF TOMATO SEED BY CULTIVATION MECHANISM CATEGORIES, %, MIDDLE EAST, 2017 VS 2023 VS 2030
- Figure 170:
- VOLUME OF TOMATO SEED BY COUNTRY, METRIC TON, MIDDLE EAST, 2017 - 2030
- Figure 171:
- VALUE OF TOMATO SEED BY COUNTRY, USD, MIDDLE EAST, 2017 - 2030
- Figure 172:
- VOLUME SHARE OF TOMATO SEED BY COUNTRY, %, MIDDLE EAST, 2017 VS 2023 VS 2030
- Figure 173:
- VALUE SHARE OF TOMATO SEED BY COUNTRY, %, MIDDLE EAST, 2017 VS 2023 VS 2030
- Figure 174:
- VOLUME OF IRAN TOMATO SEED, METRIC TON, MIDDLE EAST, 2017 - 2030
- Figure 175:
- VALUE OF IRAN TOMATO SEED, USD, MIDDLE EAST, 2017 - 2030
- Figure 176:
- VALUE SHARE OF IRAN TOMATO SEED BY BREEDING TECHNOLOGY, %, MIDDLE EAST, 2023 AND 2030
- Figure 177:
- VOLUME OF SAUDI ARABIA TOMATO SEED, METRIC TON, MIDDLE EAST, 2017 - 2030
- Figure 178:
- VALUE OF SAUDI ARABIA TOMATO SEED, USD, MIDDLE EAST, 2017 - 2030
- Figure 179:
- VALUE SHARE OF SAUDI ARABIA TOMATO SEED BY BREEDING TECHNOLOGY, %, MIDDLE EAST, 2023 AND 2030
- Figure 180:
- VOLUME OF REST OF MIDDLE EAST TOMATO SEED, METRIC TON, MIDDLE EAST, 2017 - 2030
- Figure 181:
- VALUE OF REST OF MIDDLE EAST TOMATO SEED, USD, MIDDLE EAST, 2017 - 2030
- Figure 182:
- VALUE SHARE OF REST OF MIDDLE EAST TOMATO SEED BY BREEDING TECHNOLOGY, %, MIDDLE EAST, 2023 AND 2030
- Figure 183:
- VOLUME OF TOMATO SEED BY BREEDING TECHNOLOGY CATEGORIES, METRIC TON, NORTH AMERICA, 2017 - 2030
- Figure 184:
- VALUE OF TOMATO SEED BY BREEDING TECHNOLOGY CATEGORIES, USD, NORTH AMERICA, 2017 - 2030
- Figure 185:
- VOLUME SHARE OF TOMATO SEED BY BREEDING TECHNOLOGY CATEGORIES, %, NORTH AMERICA, 2017 VS 2023 VS 2030
- Figure 186:
- VALUE SHARE OF TOMATO SEED BY BREEDING TECHNOLOGY CATEGORIES, %, NORTH AMERICA, 2017 VS 2023 VS 2030
- Figure 187:
- VOLUME OF TOMATO SEED BY CULTIVATION MECHANISM CATEGORIES, METRIC TON, NORTH AMERICA, 2017 - 2030
- Figure 188:
- VALUE OF TOMATO SEED BY CULTIVATION MECHANISM CATEGORIES, USD, NORTH AMERICA, 2017 - 2030
- Figure 189:
- VOLUME SHARE OF TOMATO SEED BY CULTIVATION MECHANISM CATEGORIES, %, NORTH AMERICA, 2017 VS 2023 VS 2030
- Figure 190:
- VALUE SHARE OF TOMATO SEED BY CULTIVATION MECHANISM CATEGORIES, %, NORTH AMERICA, 2017 VS 2023 VS 2030
- Figure 191:
- VOLUME OF TOMATO SEED BY COUNTRY, METRIC TON, NORTH AMERICA, 2017 - 2030
- Figure 192:
- VALUE OF TOMATO SEED BY COUNTRY, USD, NORTH AMERICA, 2017 - 2030
- Figure 193:
- VOLUME SHARE OF TOMATO SEED BY COUNTRY, %, NORTH AMERICA, 2017 VS 2023 VS 2030
- Figure 194:
- VALUE SHARE OF TOMATO SEED BY COUNTRY, %, NORTH AMERICA, 2017 VS 2023 VS 2030
- Figure 195:
- VOLUME OF CANADA TOMATO SEED, METRIC TON, NORTH AMERICA, 2017 - 2030
- Figure 196:
- VALUE OF CANADA TOMATO SEED, USD, NORTH AMERICA, 2017 - 2030
- Figure 197:
- VALUE SHARE OF CANADA TOMATO SEED BY BREEDING TECHNOLOGY, %, NORTH AMERICA, 2023 AND 2030
- Figure 198:
- VOLUME OF MEXICO TOMATO SEED, METRIC TON, NORTH AMERICA, 2017 - 2030
- Figure 199:
- VALUE OF MEXICO TOMATO SEED, USD, NORTH AMERICA, 2017 - 2030
- Figure 200:
- VALUE SHARE OF MEXICO TOMATO SEED BY BREEDING TECHNOLOGY, %, NORTH AMERICA, 2023 AND 2030
- Figure 201:
- VOLUME OF UNITED STATES TOMATO SEED, METRIC TON, NORTH AMERICA, 2017 - 2030
- Figure 202:
- VALUE OF UNITED STATES TOMATO SEED, USD, NORTH AMERICA, 2017 - 2030
- Figure 203:
- VALUE SHARE OF UNITED STATES TOMATO SEED BY BREEDING TECHNOLOGY, %, NORTH AMERICA, 2023 AND 2030
- Figure 204:
- VOLUME OF REST OF NORTH AMERICA TOMATO SEED, METRIC TON, NORTH AMERICA, 2017 - 2030
- Figure 205:
- VALUE OF REST OF NORTH AMERICA TOMATO SEED, USD, NORTH AMERICA, 2017 - 2030
- Figure 206:
- VALUE SHARE OF REST OF NORTH AMERICA TOMATO SEED BY BREEDING TECHNOLOGY, %, NORTH AMERICA, 2023 AND 2030
- Figure 207:
- VOLUME OF TOMATO SEED BY BREEDING TECHNOLOGY CATEGORIES, METRIC TON, SOUTH AMERICA, 2017 - 2030
- Figure 208:
- VALUE OF TOMATO SEED BY BREEDING TECHNOLOGY CATEGORIES, USD, SOUTH AMERICA, 2017 - 2030
- Figure 209:
- VOLUME SHARE OF TOMATO SEED BY BREEDING TECHNOLOGY CATEGORIES, %, SOUTH AMERICA, 2017 VS 2023 VS 2030
- Figure 210:
- VALUE SHARE OF TOMATO SEED BY BREEDING TECHNOLOGY CATEGORIES, %, SOUTH AMERICA, 2017 VS 2023 VS 2030
- Figure 211:
- VOLUME OF TOMATO SEED BY CULTIVATION MECHANISM CATEGORIES, METRIC TON, SOUTH AMERICA, 2017 - 2030
- Figure 212:
- VALUE OF TOMATO SEED BY CULTIVATION MECHANISM CATEGORIES, USD, SOUTH AMERICA, 2017 - 2030
- Figure 213:
- VOLUME SHARE OF TOMATO SEED BY CULTIVATION MECHANISM CATEGORIES, %, SOUTH AMERICA, 2017 VS 2023 VS 2030
- Figure 214:
- VALUE SHARE OF TOMATO SEED BY CULTIVATION MECHANISM CATEGORIES, %, SOUTH AMERICA, 2017 VS 2023 VS 2030
- Figure 215:
- VOLUME OF TOMATO SEED BY COUNTRY, METRIC TON, SOUTH AMERICA, 2017 - 2030
- Figure 216:
- VALUE OF TOMATO SEED BY COUNTRY, USD, SOUTH AMERICA, 2017 - 2030
- Figure 217:
- VOLUME SHARE OF TOMATO SEED BY COUNTRY, %, SOUTH AMERICA, 2017 VS 2023 VS 2030
- Figure 218:
- VALUE SHARE OF TOMATO SEED BY COUNTRY, %, SOUTH AMERICA, 2017 VS 2023 VS 2030
- Figure 219:
- VOLUME OF ARGENTINA TOMATO SEED, METRIC TON, SOUTH AMERICA, 2017 - 2030
- Figure 220:
- VALUE OF ARGENTINA TOMATO SEED, USD, SOUTH AMERICA, 2017 - 2030
- Figure 221:
- VALUE SHARE OF ARGENTINA TOMATO SEED BY BREEDING TECHNOLOGY, %, SOUTH AMERICA, 2023 AND 2030
- Figure 222:
- VOLUME OF BRAZIL TOMATO SEED, METRIC TON, SOUTH AMERICA, 2017 - 2030
- Figure 223:
- VALUE OF BRAZIL TOMATO SEED, USD, SOUTH AMERICA, 2017 - 2030
- Figure 224:
- VALUE SHARE OF BRAZIL TOMATO SEED BY BREEDING TECHNOLOGY, %, SOUTH AMERICA, 2023 AND 2030
- Figure 225:
- VOLUME OF REST OF SOUTH AMERICA TOMATO SEED, METRIC TON, SOUTH AMERICA, 2017 - 2030
- Figure 226:
- VALUE OF REST OF SOUTH AMERICA TOMATO SEED, USD, SOUTH AMERICA, 2017 - 2030
- Figure 227:
- VALUE SHARE OF REST OF SOUTH AMERICA TOMATO SEED BY BREEDING TECHNOLOGY, %, SOUTH AMERICA, 2023 AND 2030
- Figure 228:
- MOST ACTIVE COMPANIES BY NUMBER OF STRATEGIC MOVES, COUNT, GLOBAL, 2017-2023
- Figure 229:
- MOST ADOPTED STRATEGIES, COUNT, GLOBAL, 2017-2023
- Figure 230:
- VALUE SHARE OF MAJOR PLAYERS, %, GLOBAL
Tomato Seed Industry Segmentation
Hybrids, Open Pollinated Varieties & Hybrid Derivatives are covered as segments by Breeding Technology. Open Field, Protected Cultivation are covered as segments by Cultivation Mechanism. Africa, Asia-Pacific, Europe, Middle East, North America, South America are covered as segments by Region.| Breeding Technology | Hybrids | |||
| Open Pollinated Varieties & Hybrid Derivatives | ||||
| Cultivation Mechanism | Open Field | |||
| Protected Cultivation | ||||
| Region | Africa | By Breeding Technology | ||
| By Cultivation Mechanism | ||||
| By Country | Egypt | |||
| Ethiopia | ||||
| Ghana | ||||
| Kenya | ||||
| Nigeria | ||||
| South Africa | ||||
| Tanzania | ||||
| Rest of Africa | ||||
| Asia-Pacific | By Breeding Technology | |||
| By Cultivation Mechanism | ||||
| Australia | ||||
| Bangladesh | ||||
| China | ||||
| India | ||||
| Indonesia | ||||
| Japan | ||||
| Myanmar | ||||
| Pakistan | ||||
| Philippines | ||||
| Thailand | ||||
| Vietnam | ||||
| Rest of Asia-Pacific | ||||
| Europe | By Breeding Technology | |||
| By Cultivation Mechanism | ||||
| France | ||||
| Germany | ||||
| Italy | ||||
| Netherlands | ||||
| Poland | ||||
| Romania | ||||
| Russia | ||||
| Spain | ||||
| Turkey | ||||
| Ukraine | ||||
| United Kingdom | ||||
| Rest of Europe | ||||
| Middle East | By Breeding Technology | |||
| By Cultivation Mechanism | ||||
| Iran | ||||
| Saudi Arabia | ||||
| Rest of Middle East | ||||
| North America | By Breeding Technology | |||
| By Cultivation Mechanism | ||||
| Canada | ||||
| Mexico | ||||
| United States | ||||
| Rest of North America | ||||
| South America | By Breeding Technology | |||
| By Cultivation Mechanism | ||||
| Argentina | ||||
| Brazil | ||||
| Rest of South America | ||||
Breeding Technology
| Hybrids |
| Open Pollinated Varieties & Hybrid Derivatives |
Cultivation Mechanism
| Open Field |
| Protected Cultivation |
Region
| Africa | By Breeding Technology | ||
| By Cultivation Mechanism | |||
| By Country | Egypt | ||
| Ethiopia | |||
| Ghana | |||
| Kenya | |||
| Nigeria | |||
| South Africa | |||
| Tanzania | |||
| Rest of Africa | |||
| Asia-Pacific | By Breeding Technology | ||
| By Cultivation Mechanism | |||
| Australia | |||
| Bangladesh | |||
| China | |||
| India | |||
| Indonesia | |||
| Japan | |||
| Myanmar | |||
| Pakistan | |||
| Philippines | |||
| Thailand | |||
| Vietnam | |||
| Rest of Asia-Pacific | |||
| Europe | By Breeding Technology | ||
| By Cultivation Mechanism | |||
| France | |||
| Germany | |||
| Italy | |||
| Netherlands | |||
| Poland | |||
| Romania | |||
| Russia | |||
| Spain | |||
| Turkey | |||
| Ukraine | |||
| United Kingdom | |||
| Rest of Europe | |||
| Middle East | By Breeding Technology | ||
| By Cultivation Mechanism | |||
| Iran | |||
| Saudi Arabia | |||
| Rest of Middle East | |||
| North America | By Breeding Technology | ||
| By Cultivation Mechanism | |||
| Canada | |||
| Mexico | |||
| United States | |||
| Rest of North America | |||
| South America | By Breeding Technology | ||
| By Cultivation Mechanism | |||
| Argentina | |||
| Brazil | |||
| Rest of South America | |||
Need A Different Region or Segment?
Customize Now
Market Definition
- Commercial Seed - For the purpose of this study, only commercial seeds have been included as part of the scope. Farm-saved Seeds, which are not commercially labeled are excluded from scope, even though a minor percentage of farm-saved seeds are exchanged commercially among farmers. The scope also excludes vegetatively reproduced crops and plant parts, which may be commercially sold in the market.
- Crop Acreage - While calculating the acreage under different crops, the Gross Cropped Area has been considered. Also known as Area Harvested, according to the Food & Agricultural Organization (FAO), this includes the total area cultivated under a particular crop across seasons.
- Seed Replacement Rate - Seed Replacement Rate is the percentage of area sown out of the total area of crop planted in the season by using certified/quality seeds other than the farm-saved seed.
- Protected Cultivation - The report defines protected cultivation as the process of growing crops in a controlled environment. This includes greenhouses, glasshouses, hydroponics, aeroponics, or any other cultivation system that protects the crop against any abiotic stress. However, cultivation in an open field using plastic mulch is excluded from this definition and is included under open field.
| Keyword | Definition |
|---|---|
| Row Crops | These are usually the field crops which include the different crop categories like grains & cereals, oilseeds, fiber crops like cotton, pulses, and forage crops. |
| Solanaceae | These are the family of flowering plants which includes tomato, chili, eggplants, and other crops. |
| Cucurbits | It represents a gourd family consisting of about 965 species in around 95 genera. The major crops considered for this study include Cucumber & Gherkin, Pumpkin and squash, and other crops. |
| Brassicas | It is a genus of plants in the cabbage and mustard family. It includes crops such as carrots, cabbage, cauliflower & broccoli. |
| Roots & Bulbs | The roots and bulbs segment includes onion, garlic, potato, and other crops. |
| Unclassified Vegetables | This segment in the report includes the crops which don’t belong to any of the above-mentioned categories. These include crops such as okra, asparagus, lettuce, peas, spinach, and others. |
| Hybrid Seed | It is the first generation of the seed produced by controlling cross-pollination and by combining two or more varieties, or species. |
| Transgenic Seed | It is a seed that is genetically modified to contain certain desirable input and/or output traits. |
| Non-Transgenic Seed | The seed produced through cross-pollination without any genetic modification. |
| Open-Pollinated Varieties & Hybrid Derivatives | Open-pollinated varieties produce seeds true to type as they cross-pollinate only with other plants of the same variety. |
| Other Solanaceae | The crops considered under other Solanaceae include bell peppers and other different peppers based on the locality of the respective countries. |
| Other Brassicaceae | The crops considered under other brassicas include radishes, turnips, Brussels sprouts, and kale. |
| Other Roots & Bulbs | The crops considered under other roots & bulbs include Sweet Potatoes and cassava. |
| Other Cucurbits | The crops considered under other cucurbits include gourds (bottle gourd, bitter gourd, ridge gourd, Snake gourd, and others). |
| Other Grains & Cereals | The crops considered under other grains & cereals include Barley, Buck Wheat, Canary Seed, Triticale, Oats, Millets, and Rye. |
| Other Fibre Crops | The crops considered under other fibers include Hemp, Jute, Agave fibers, Flax, Kenaf, Ramie, Abaca, Sisal, and Kapok. |
| Other Oilseeds | The crops considered under other oilseeds include Ground nut, Hempseed, Mustard seed, Castor seeds, safflower seeds, Sesame seeds, and Linseeds. |
| Other Forage Crops | The crops considered under other forages include Napier grass, Oat grass, White clover, Ryegrass, and Timothy. Other forage crops were considered based on the locality of the respective countries. |
| Pulses | Pigeon peas, Lentils, Broad and horse beans, Vetches, Chickpeas, Cowpeas, Lupins, and Bambara beans are the crops considered under pulses. |
| Other Unclassified Vegetables | The crops considered under other unclassified vegetables include Artichokes, Cassava Leaves, Leeks, Chicory, and String beans. |
Need More Details on Market Definition?
Ask a Question
Research Methodology
Mordor Intelligence follows a four-step methodology in all our reports.
- Step-1: IDENTIFY KEY VARIABLES: In order to build a robust forecasting methodology, the variables and factors identified in Step-1 are tested against available historical market numbers. Through an iterative process, the variables required for market forecast are set and the model is built on the basis of these variables.
- Step-2: Build a Market Model: Market-size estimations for the forecast years are in nominal terms. Inflation is not a part of the pricing, and the average selling price (ASP) is kept constant throughout the forecast period.
- Step-3: Validate and Finalize: In this important step, all market numbers, variables and analyst calls are validated through an extensive network of primary research experts from the market studied. The respondents are selected across levels and functions to generate a holistic picture of the market studied.
- Step-4: Research Outputs: Syndicated Reports, Custom Consulting Assignments, Databases, and Subscription Platforms

Get More Details On Research Methodology
Download PDF


