
Tinned Fish Market Size and Share
Market Overview
| Study Period | 2021 - 2031 |
|---|---|
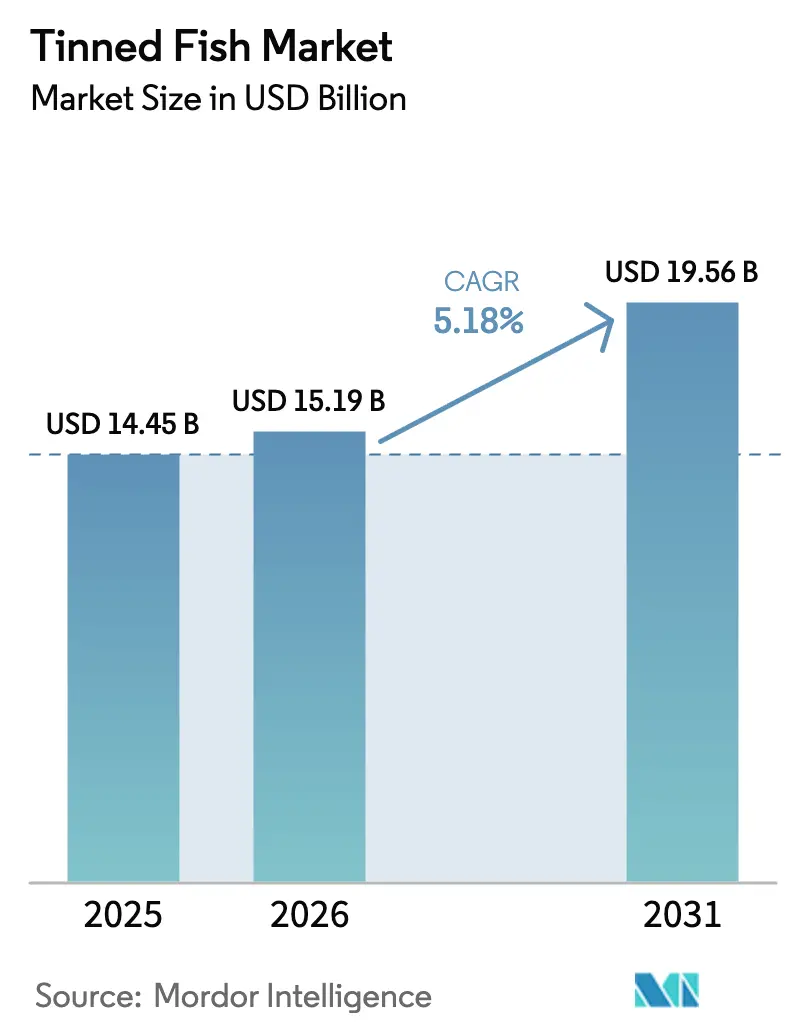
| Market Size (2026) | USD 15.19 Billion |
| Market Size (2031) | USD 19.56 Billion |
| Growth Rate (2026 - 2031) | 5.18 % |
| Fastest Growing Market | Asia-Pacific |
| Largest Market | Europe |
| Market Concentration | Medium |
Major Players *Disclaimer: Major Players sorted in no particular order Image © Mordor Intelligence. Reuse requires attribution under CC BY 4.0. | |
Tinned Fish Market Analysis by Mordor Intelligence
The global tinned fish market size is expected to grow from USD 14.45 billion in 2025 to USD 15.19 billion in 2026 and is forecast to reach USD 19.56 billion by 2031 at 5.18% CAGR over 2026-2031. The growing demand for seafood, coupled with its healthy attributes like the presence of superior quality proteins, essential fatty acids, and macro and micronutrients, is driving the global tinned fish market. Fish represents a rich source of nutrients necessary for good health. In addition, the expanding trend of consuming convenience foods due to busy lifestyles is influencing consumer inclination towards processed food, such as tinned fish. Further, the improved distribution infrastructure and fish processing methods are driving the growth of the tinned fish market across the globe. Therefore, new product introductions, expanding distribution channels, and improvements in canning techniques are anticipated to boost market expansion during the projection period.
Key Report Takeaways
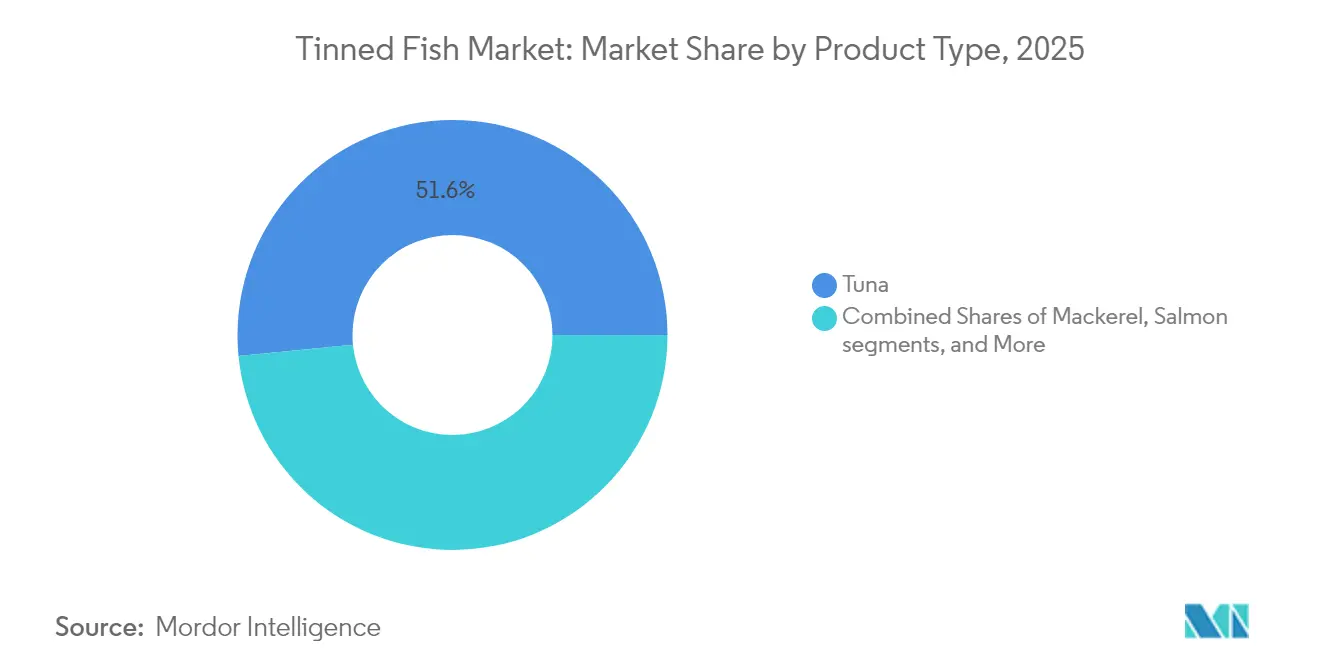
- By product type, tuna led with 51.55% of the tinned fish market share in 2025; mackerel is projected to expand at a 6.55% CAGR to 2031.
- By price, the mass segment accounted for 84.62% of the tinned fish market size in 2025; premium items are advancing at an 8.12% CAGR.
- By preservation medium, oil-based products captured 54.62% share of revenue in 2025, while brine-preserved lines are forecast to grow at 7.18% CAGR.
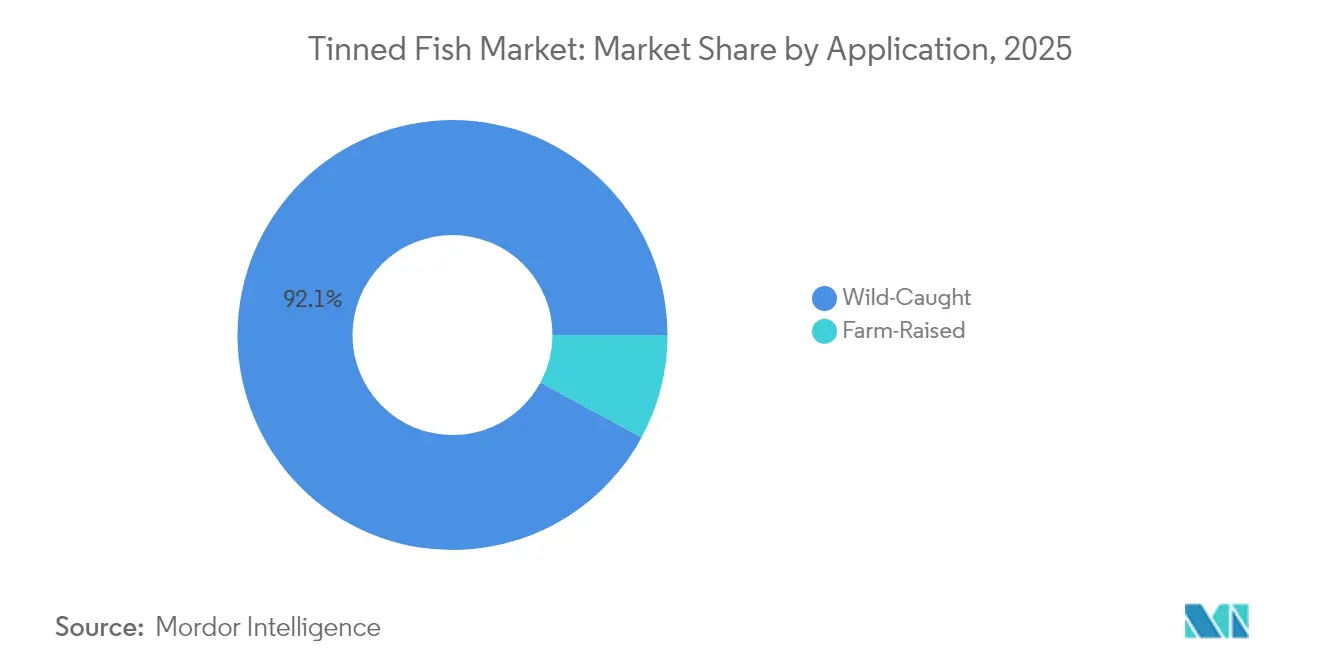
- By fish source, wild-caught offerings dominated with a 92.10% market share in 2025, whereas farm-raised products are poised for an 7.72% CAGR to 2031.
- By distribution channel, supermarkets and hypermarkets held 63.10% of the tinned fish market share in 2025; online retail is set to rise at 7.29% CAGR.
- By geography, Europe represented a 31.74% share of the global market in 2025; Asia-Pacific is projected to register a 7.52% CAGR through 2031.
Note: Market size and forecast figures in this report are generated using Mordor Intelligence’s proprietary estimation framework, updated with the latest available data and insights as of 2026.
Global Tinned Fish Market Trends and Insights
Drivers Impact Analysis*
| Driver | (~) % Impact on CAGR Forecast | Geographic Relevance | Impact Timeline |
|---|---|---|---|
| Rising Demand for Convenient and Ready-To-Eat Protein Sources | +1.2% | Global, with strongest impact in North America and Europe | Short term (≤ 2 years) |
| Growing Awareness of Health Benefits Associated with Omega-3-Rich Fish | +0.9% | Global, particularly the Asia-Pacific emerging markets | Medium term (2-4 years) |
| Expansion of Organized Retail and E-Commerce | +0.8% | Asia-Pacific core, spill-over to MEA | Medium term (2-4 years) |
| Longer Shelf Life Appeals to Consumers Seeking Food Security | +0.7% | Global, heightened in crisis-prone regions | Short term (≤ 2 years) |
| Rising Disposable Incomes in Emerging Markets | +0.6% | Asia-Pacific, Latin America | Long term (≥ 4 years) |
| Sustainable Fishing and Eco-Labeling Initiatives | +0.5% | North America and EU, expanding globally | Long term (≥ 4 years) |
| Source: Mordor Intelligence | |||
Rising Demand for Convenient and Ready-To-Eat Protein Sources Boosts Tinned Fish Consumption
The growing adoption of tinned fish is driven by the need for convenient, protein-rich solutions among busy professionals, coupled with its rising appeal as a trendy food choice influenced by social media. Platforms have popularized concepts like "tinned fish parties" and "seacuterie" boards, elevating canned seafood from a basic pantry item to an aspirational product, particularly among younger demographics who value both practicality and visually appealing meals. Retailers such as Target have capitalized on this trend by prominently featuring tinned fish to meet the increasing demand for quick, nutritious meal options. This convenience factor gains further importance during periods of economic uncertainty, as consumers seek affordable protein sources without compromising on quality or nutritional value. The convergence of convenience, health consciousness, and affordability positions tinned fish as a sustainable growth driver, transcending traditional consumption patterns and economic cycles to establish itself as both a necessity and a lifestyle choice.
Growing Awareness of Health Benefits Associated with Omega-3-Rich Fish Supports Market Growth
Scientific validation of omega-3 fatty acids' cardiovascular and cognitive benefits is influencing consumer preferences, particularly toward fish consumption, with tinned options emerging as a practical and affordable source of concentrated nutrition. Studies highlight that regular fish intake reduces the risk of cardiovascular diseases, certain cancers, and cognitive decline, with tinned fish offering comparable levels of essential proteins, omega-3 fatty acids, and micronutrients to fresh alternatives. This trend is particularly pronounced among aging populations and health-conscious consumers, who increasingly recognize tinned fish as a convenient way to meet dietary guidelines recommending at least 8 ounces of seafood weekly. As healthcare costs rise and preventive nutrition becomes a priority, this awareness is driving sustained demand growth in the market. Additionally, the long shelf life and ease of storage associated with tinned fish make it an attractive option for consumers seeking both convenience and cost-effectiveness. The growing focus on sustainable fishing practices further enhances the appeal of tinned fish, aligning with the values of environmentally conscious buyers.
Expansion of Organized Retail and E-Commerce Enhances Product Availability and Visibility
The expansion of digital commerce and modern retail has significantly enhanced the availability of tinned fish products, extending their reach beyond traditional sales channels. E-commerce platforms enable specialty and artisanal brands to directly connect with consumers, fostering premium market segments with higher profit margins. Concurrently, the growth of organized retail in emerging markets ensures proper storage conditions and effective merchandising, which not only maintain product quality but also educate consumers on product varieties and usage. This evolution in retail creates a cycle where increased visibility drives trial purchases, leading to repeat buying as consumers explore diverse fish species and preparations. The integration of physical and digital retail has made premium tinned fish products, previously limited to specialty stores, more accessible to a wider audience. The market's growth is further propelled by innovative distribution strategies, rising consumer awareness, and the introduction of varied product offerings across multiple retail formats.
Longer Shelf Life of Tinned Fish Products Appeals to Consumers Seeking Food Security
Tinned fish, with its extended shelf life enabled by sterilization, has become a critical pantry item for consumers prioritizing food security during supply chain disruptions and economic uncertainties. Its ability to remain viable for years without refrigeration addresses storage challenges, particularly in regions with inadequate cold storage infrastructure, while supporting household food budgets. Consumer behavior during crises, such as natural disasters and supply chain disruptions, highlights the practical and psychological benefits of shelf-stable products. Additionally, modern packaging technologies, including sensor-based smart systems that monitor food quality, are reducing reliance on expiration dates and minimizing food waste. This innovation is particularly significant in emerging markets, where income fluctuations and limited infrastructure make shelf-stable protein sources essential for meal planning. These factors drive consistent demand during economic downturns and create opportunities for market expansion during periods of growth.
Restraints Impact Analysis*
| Restraint | (~) % Impact on CAGR Forecast | Geographic Relevance | Impact Timeline |
|---|---|---|---|
| Rising Concerns Over Mercury and Microplastic Contamination | -0.8% | Global, particularly Europe with stricter regulations | Medium term (2-4 years) |
| Volatility In Raw Material Prices Affects Production Costs | -0.6% | Global, most severe in import-dependent regions | Short term (≤ 2 years) |
| Growing Preference for Fresh or Frozen Fish Alternatives | -0.4% | North America and Europe, urban centers with cold chain access | Medium term (2-4 years) |
| High Sodium Content in Some Tinned Fish Products | -0.3% | Global, strongest in health-conscious developed markets | Long term (≥ 4 years) |
| Source: Mordor Intelligence | |||
Rising Concerns Over Mercury and Microplastic Contamination in Fish May Deter Consumers
Regulatory scrutiny and consumer awareness of contaminants create headwinds for tinned fish consumption, particularly as European NGOs advocate for stricter mercury limits that could reshape product formulations. The methylmercury exposure risk particularly affects pregnant women and children, creating market segmentation challenges as health-conscious consumers seek low-mercury alternatives. However, technological innovation provides mitigation pathways, with Chalmers University developing packaging solutions that reduce mercury content by up to 35% using cysteine-infused water-based solutions that bind mercury without altering taste or appearance. Microplastic concerns add complexity, though FDA[1]US FDA, “Metals in Seafood: Microplastics and Mercury,” fda.gov guidance indicates current levels in seafood do not pose health risks, providing regulatory clarity that supports continued consumption. The contamination narrative creates opportunities for premium positioning around purity and sourcing transparency, enabling brands to differentiate through testing protocols and contamination reduction technologies.
Volatility In Raw Material Prices Affects Production Costs and Profit Margins
Raw material price fluctuations create margin pressure and supply chain disruptions that challenge profitability and market stability, particularly as climate change affects fish availability in traditional sourcing regions. The severe sardine shortage from Morocco, where production fell 60% in 2024 due to poor fish levels and climate impacts, demonstrates how environmental factors can rapidly disrupt supply chains and inflate costs for processors dependent on specific sourcing regions. Fish processing costs are particularly sensitive to raw material fluctuations, with over 70% of total costs attributed to raw materials in EU processing operations[2]European Commission, “Cost Structure in EU Fish Processing,” ec.europa.eu, making price management critical for maintaining competitive positioning. This volatility drives vertical integration strategies and long-term sourcing contracts, while also creating opportunities for alternative species development and aquaculture expansion to reduce dependence on wild-caught supplies subject to environmental variability.
*Our forecasts treat driver/restraint impacts as directional, not additive. The impact forecasts reflect baseline growth, mix effects, and variable interactions.
Segment Analysis
By Product Type: Tuna Dominance Faces Species Diversification
Tuna holds a dominant 51.55% market share in 2025, supported by widespread consumer acceptance and established global supply chains. Meanwhile, mackerel shows significant growth potential with a projected 6.55% CAGR through 2031, indicating a shift in consumer preferences. This change stems from increased health awareness, sustainability considerations, and consumer response to rising tuna prices caused by supply limitations and regulatory measures. Salmon continues to maintain its market position through premium branding and omega-3 content, while sardines appeal to cost-conscious consumers and offer sustainability benefits, despite production challenges in key regions like Morocco. Anchovies remain prominent in Mediterranean and Asian markets, with expansion opportunities in Western regions as consumers embrace diverse culinary traditions.
Social media platforms accelerate species diversification by introducing consumers to new preparation methods and elevating lesser-known species. Mackerel's growth is particularly notable due to its high omega-3 content and lower mercury concentration compared to larger fish species. Processors are expanding their capabilities to include alternative species, reducing their reliance on fluctuating tuna markets. The "others" category, which includes species such as octopus and mussels, presents opportunities for premium product development and culinary innovation that may transform traditional market structures.


By Price: Mass Market Stability Enables Premium Growth
Mass market products hold an 84.62% market share in 2025, providing volume stability that supports infrastructure investment and economies of scale. The premium segment is growing at an 8.12% CAGR as consumers seek higher quality and sustainable products. This market division reflects broader food industry patterns where budget-conscious consumers maintain category loyalty through affordable options, while higher-income segments support margin growth through their willingness to pay more for quality, transparent sourcing, and artisanal products. The premium segment benefits from social media exposure, which has transformed tinned fish from a basic pantry item to a premium food choice through enhanced presentation and communication about sourcing and preparation.
The premium segment growth creates opportunities for brands to differentiate through innovative packaging, sustainability certifications, and limited-edition products that generate higher margins while strengthening brand value. The mass market provides stability during economic downturns, as consumers seek affordable protein options that maintain nutritional value and convenience. This parallel growth allows companies to maintain volume through mass market products while increasing margins through premium offerings. The price segmentation also shows geographic differences, with emerging markets driving mass consumption and developed markets focusing on premium products as higher disposable incomes support increased spending.
By Preservation Medium: Oil Preference Shifts Toward Health-Conscious Alternatives
Oil-based preservation maintains 54.62% market share in 2025, supported by traditional consumer preferences and established supply chain infrastructure. Brine-preserved products are growing at 7.18% CAGR, driven by consumers seeking lower-sodium options and simpler ingredient lists. This market evolution reflects increasing consumer focus on ingredient transparency and dietary requirements, particularly regarding sodium intake. The "others" segment, including sauce-based and smoked preparations, offers opportunities for product differentiation through unique flavors and premium offerings that address diverse consumer preferences.
Brine preservation's growth stems from its perception as a healthier alternative to oil-based products, particularly among health-conscious consumers and those monitoring cardiovascular health. Oil-based products continue to maintain strong market presence due to superior flavor retention and texture preservation capabilities. The market shows potential for innovative preservation approaches that combine health benefits with taste preferences, including low-sodium brines and alternative oil formulations. Manufacturers must consider how preservation methods affect product shelf life and storage requirements when developing new products.
By Fish Source: Wild-Caught Dominance Faces Aquaculture Innovation
Wild-caught fish holds a 92.10% market share in 2025, as consumers prefer its natural origins and traditional harvesting methods. Farm-raised fish production grows at an 7.72% CAGR, driven by aquaculture technology improvements and sustainability requirements. This market structure highlights the contrast between consumer preferences for wild-caught fish and industry requirements for reliable supply chains and environmental sustainability, especially as wild fish populations face overfishing pressures and climate change effects. Aquaculture's expansion is supported by technical advances that improve fish health, minimize environmental effects, and enhance product quality to match wild-caught fish in taste and nutrition.
Companies are adapting their sourcing strategies to address sustainability requirements while meeting consumer demands. Wild-caught products retain their premium market position through natural and traditional fishing method messaging, while aquaculture products increase market acceptance through transparent farming practices and environmental advantages. Marine Stewardship Council (MSC) certification for wild-caught fish and Aquaculture Stewardship Council (ASC) certification for farmed fish provide standards for consumers and industry practices. Companies increasingly adopt dual-sourcing approaches, developing capabilities in both wild-caught and aquaculture production to strengthen supply chain stability and serve various market segments.
By Distribution Channel: Off-Trade Evolution Drives Digital Transformation
Supermarkets and hypermarkets hold a 63.10% market share in 2025, offering consistent volume sales and widespread consumer access. Online retail stores are growing at a 7.29% CAGR as digital commerce changes seafood buying patterns and enables brands to sell directly to consumers. This shift in distribution channels reflects a broader retail transformation, where traditional off-trade faces competition from e-commerce platforms that provide convenience, product variety, and direct consumer engagement. Convenience stores serve impulse buyers and urban consumers, while specialty stores cater to niche markets seeking premium and artisanal products at higher price points.
Digital platforms create opportunities for product differentiation and consumer education through detailed product information, cooking instructions, and sustainability messaging that physical stores cannot easily provide. Online retail benefits smaller and artisanal brands that can bypass traditional retail distribution and reach consumers through e-commerce and subscription services. The diversification of sales channels reflects evolving shopping habits, as younger consumers increasingly buy food online while traditional buyers prefer examining products in stores. In response, brands are developing omnichannel strategies to reach different consumer segments across multiple purchasing platforms.
Geography Analysis
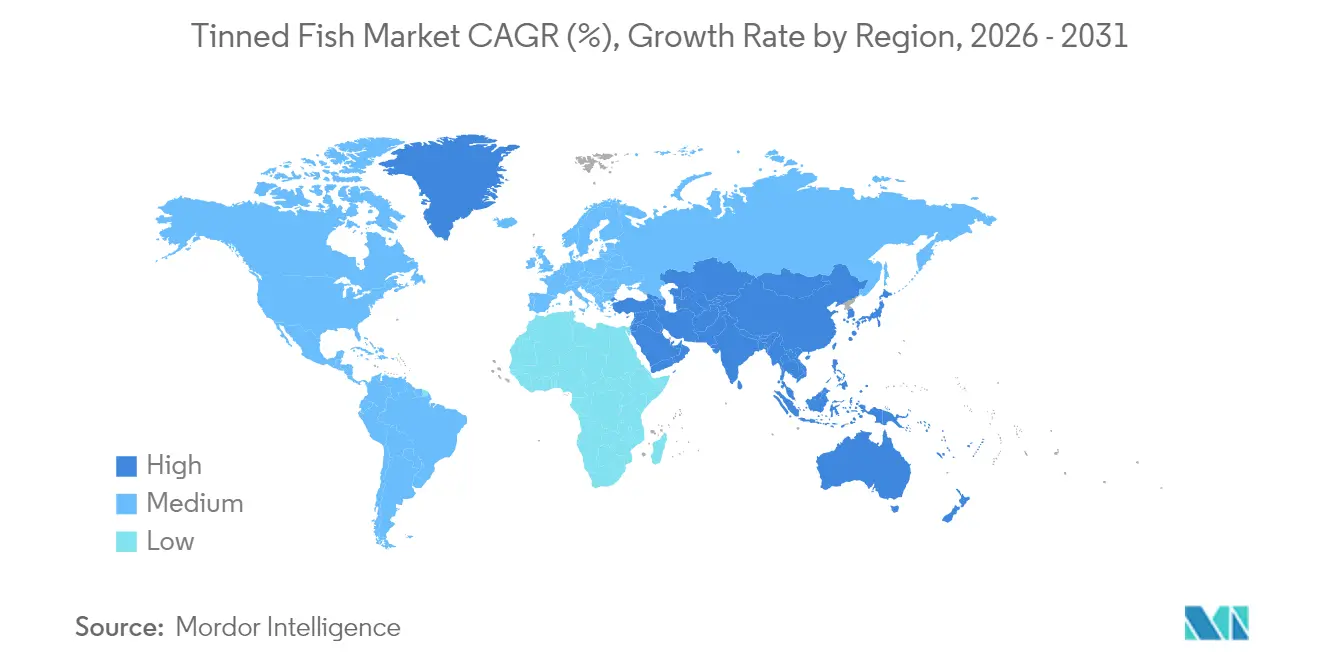
Europe holds a 31.74% market share in 2025, supported by established consumption patterns and robust supply chain infrastructure. However, market saturation and regulatory requirements necessitate a focus on innovation and premium offerings. Regional household spending on fishery products rose 6% to USD 71.35 billion in 2023, despite a 5% decline in total consumption, indicating consumer preference for quality and sustainable products (EUMOFA). European regulations on mercury content, with proposed reductions from 1 ppm to 0.3 ppm by NGOs, present operational challenges while offering competitive advantages for companies with superior contamination controls.
Asia-Pacific market growth rate at a 7.52% CAGR benefits from young, urban populations seeking convenient protein sources that complement modern lifestyles and health preferences. China maintains its position as the global seafood production leader, producing 71 million metric tons in 2023, influencing global market dynamics (United States Department of Agriculture). European markets navigate strict regulatory requirements for mercury content and sustainability, which increase operational costs but enable differentiation through safety and environmental compliance. Market expansion in emerging regions reflects infrastructure limitations, where inadequate cold chain facilities favor tinned fish over fresh options, establishing sustained demand patterns.
North America demonstrates characteristics of both European maturity and Asia-Pacific growth, offering opportunities for volume growth and premium positioning across consumer segments. The U.S. tinned fish market expands through increased demand for healthy, sustainable seafood, while domestic production faces capacity constraints in cannery infrastructure, creating opportunities for local production expansion and import growth. The region's emphasis on sustainability supports MSC and ASC-certified products, with over 1,750 MSC-certified products available in the U.S. and Canada, demonstrating established infrastructure for sustainable seafood distribution and consumer acceptance.

Value Chain Analysis
The tinned fish value chain starts with capture fisheries and aquaculture supplying raw material (notably tuna, which accounted for 51.55% of category share in 2025), followed by landing, cold storage and primary processing (grading, loining/filleting), canning (filling with oil, brine, or sauces), thermal sterilization, labeling, and secondary packaging before export and domestic distribution. Brand owners and processors manage procurement through traders, fishing fleets, and long-term supply arrangements, while quality and food-safety controls are embedded across HACCP-based manufacturing and lot-level traceability programs that support recalls, retailer audits, and cross-border compliance.
Downstream, the channel mix is led by supermarkets and hypermarkets (63.10% share in 2025), complemented by specialty retail and online retail as a route for premiumization and direct-to-consumer storytelling. Traceability and sustainability verification have become operational layers across the chain: Thai Union reports 100% traceability to vessel of origin and high on-the-water monitoring coverage, while Bolton (Rio Mare) discloses supplier-vessel lists, uses tools such as Global Fishing Watch for monitoring, and participates in industry traceability alignment through GDST. Packaging and energy inputs are also increasingly managed as cost and differentiation levers, with processors such as Century Pacific integrating renewables (including solar and biomass in manufacturing) to support efficiency and sustainability targets tied to retailer and brand commitments.
Competitive Landscape
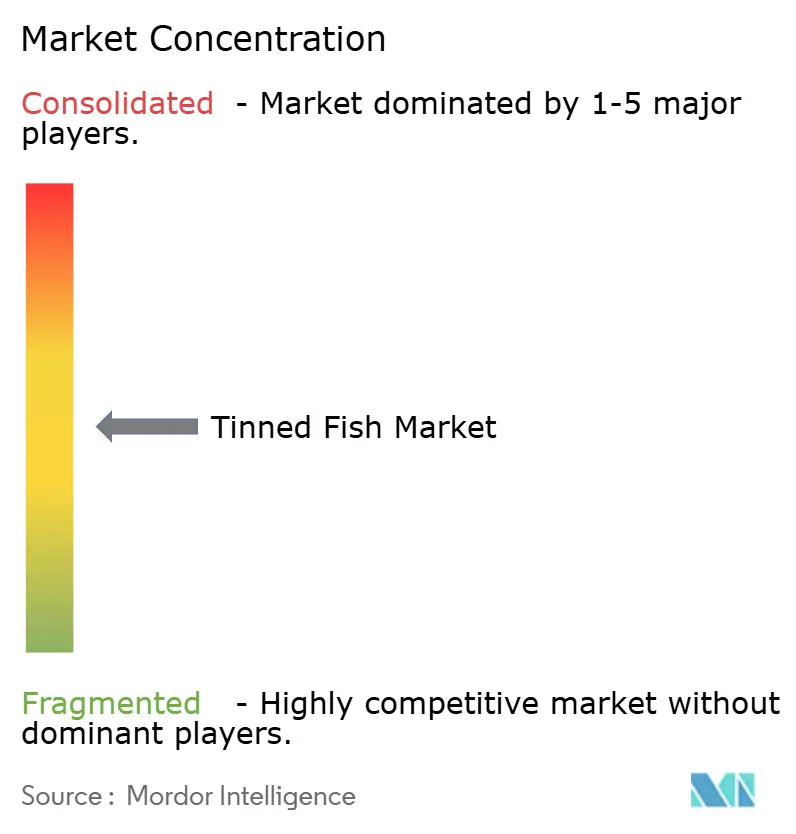
Thai Union Group PLC, Bolton Group (Rio Mare), Century Pacific Food Inc., and Wild Planet Foods Inc. lead the moderately concentrated tinned fish market. Established firms capitalize on economies of scale, while new entrants gain traction by introducing innovative products and targeting specific market segments.
Companies actively differentiate themselves by advancing technologies in packaging, traceability systems, and contamination reduction. These initiatives address consumer concerns and ensure compliance with regulatory standards. For example, Chalmers University's mercury-reduction packaging technology provides a competitive advantage for early adopters. Additionally, smart packaging systems that monitor food quality in real time enhance premium product positioning and minimize waste.
Growth opportunities lie in direct-to-consumer sales, sustainability-certified products, and the development of alternative fish species. Traditional tuna-focused strategies face challenges from supply constraints and regulatory pressures. New entrants leverage e-commerce platforms and social media to establish premium brands without relying on extensive retail infrastructure. This shift drives established companies to adapt their distribution strategies and refine their market positioning.
Tinned Fish Industry Leaders
Thai Union Group PLC
Bolton Group (Rio Mare)
Century Pacific Food Inc.
Wild Planet Foods Inc.
Bumble Bee Seafoods
- *Disclaimer: Major Players sorted in no particular order

Market Opportunities and Future Outlook
Opportunities in tinned fish are increasingly tied to verifiable sourcing, traceability, and safety attributes as brands and retailers respond to scrutiny around contaminants and responsible fishing. Operators with end-to-end visibility can differentiate through documented chain-of-custody and monitoring at sea: Thai Union reports 100% traceability to vessel of origin (2025 data), and Bolton Food has positioned tuna sourcing around MSC-certified fisheries and Fishery Improvement Projects, reinforcing a pathway for labeled, audited products in markets where sustainability-certified assortments are already established. This creates whitespace for premium and mass portfolios to use clearer provenance, low-mercury positioning, and transparent testing protocols, especially for tuna-led shelves.
A second opportunity sits in operational resilience and cost management across processing and packaging, given raw material volatility and the importance of manufacturing economics. EU processing benchmarks highlight raw materials as the dominant cost driver (over 70% of total costs), making yield, energy, and packaging efficiency meaningful levers for competitiveness. Investments in renewable energy and process optimization, such as Century Pacifics disclosed solar capacity and use of biomass boilers for waste-to-energy applications, support margin management while aligning with retailer sustainability requirements. Channel-side, online retail is the fastest-growing distribution route in the category, and it offers a platform for assortments beyond core tuna (including mackerel and other species) through education-led merchandising and subscription-style replenishment that complements the still-dominant supermarket and hypermarket volumes.
Recent Industry Developments
- June 2026: Century Pacific Food Inc. has confirmed an annual capital expenditure budget of PHP 8 billion to PHP 9 billion to increase production capacity for domestic and export businesses. The expansion focuses on tuna OEM export and coconut processing to meet rising demand across markets.
- March 2026: Thai Union Group PCL partnered with Wholechain to implement end-to-end digital traceability across its global seafood operations. The move enhances compliance and transparency, enabling premium positioning and risk management.
- March 2026: Thai Union Group PCL launched Star Union Packaging in Samut Sakhon, a joint venture with Starflex Public Company Limited targeting THB 1 billion in revenue within five years. The packaging initiative strengthens end-to-end capabilities and solidifies market presence in Southeast Asia.


Research Methodology Framework and Report Scope
Market Definition and Coverage
For this study, the tinned fish market covers retail and foodservice sales of shelf-stable fish packed in sealed cans or similar containers, typically processed using heat treatment to enable ambient storage. We measure the market as revenue from finished products sold through formal distribution channels.
Scope exclusions: This scope does not count fresh or frozen fish, chilled ready meals centered on fish, or bulk industrial fish inputs that are not sold as packaged tinned products.
Segmentation Overview
- By Product Type
- Tuna
- Salmon
- Sardines
- Mackerel
- Anchovies
- Others
- By Price
- Mass
- Premium
- By Preservation Medium
- In Oil
- In Brine
- Others (sauce, smoked)
- By Fish Source
- Wild-caught
- Farm-raised (Aquaculture)
- By Distribution Channel
- Supermarkets and Hypermarkets
- Convenience Stores
- Specialty Stores
- Online Retail Stores
- Other Distribution Channels
- By Geography
- North America
- United States
- Canada
- Mexico
- Rest of North America
- Europe
- Germany
- United Kingdom
- Italy
- France
- Spain
- Netherlands
- Poland
- Belgium
- Sweden
- Rest of Europe
- Asia-Pacific
- China
- India
- Japan
- Australia
- Indonesia
- South Korea
- Thailand
- Singapore
- Rest of Asia-Pacific
- South America
- Brazil
- Argentina
- Colombia
- Chile
- Peru
- Rest of South America
- Middle East and Africa
- South Africa
- Saudi Arabia
- United Arab Emirates
- Nigeria
- Egypt
- Morocco
- Turkey
- Rest of Middle East and Africa
- North America
Data Sources, Market Sizing, and Validation
Desk Research
Desk research was used to build the base market structure, especially around category definitions, seafood supply patterns, and cross-border trade signals that affect availability and pricing. We reviewed public statistics and reference publications such as FAO fisheries and aquaculture data, UN Comtrade trade flows, national customs or statistical offices, and USDA and FDA materials that help interpret processed seafood labeling and handling practices.
To shape country-level assumptions, we also used annual reports and investor presentations, public sustainability disclosures, and trusted press coverage on plant capacity changes and raw material constraints. In addition, paid subscriptions supporting company financials and intelligence, patent databases, and shipment-level import and export records were used selectively to sanity check revenue pools and product flow direction. The sources listed here are illustrative and not exhaustive, since additional references were used for data collection, validation, and clarification.
Primary Interviews and Surveys
Primary interviews focused on what is counted as tinned fish in trade and retail practice, plus how pricing and product mix shift across key consuming regions. We spoke with processors, brand managers, distributors, retailers, and category specialists across major consuming and producing countries, then used their inputs to confirm conversion factors, pack-size normalization, and realistic price ladders by channel.
Distribution of primary research fieldwork respondents
| Company type | Respondent position | Region |
|---|---|---|
| Top tier: 30% | CXOs: 12% | APAC: 38% |
| Mid tier: 53% | Functional/Unit leaders: 43% | EMEA: 36% |
| Smaller Players: 17% | Managers: 45% | Americas: 26% |
Market-Sizing & Forecasting
Market sizing starts from a top-down rebuild of demand using processed seafood consumption patterns, packaging penetration, and trade and production indicators, then aligns those totals to the packaged tinned fish boundary. Once country and region totals are formed, we run selective bottom-up checks, including sampled product price tracking across channels and supplier and distributor roll-ups in countries where company disclosures are more transparent.
Key inputs in the model include fish raw material availability by species group, import dependence versus local processing, average pack sizes and drain-weight conventions used in labeling, channel mix between retail and foodservice, and price-tier movement linked to commodity fish prices and canning costs. For forecasting, we apply scenario analysis so that changes in household pantry loading behavior, inflation-led downtrading, and supply-side constraints can be reflected without forcing one straight-line growth path. Where bottom-up signals were incomplete, gaps were filled using proxy ratios from comparable markets, then rechecked with primary feedback before finalizing totals.
Data Validation & Update Cycle
Outputs were cross-checked against independent signals such as seafood trade balances, processed fish production direction, and per-capita consumption ranges for shelf-stable seafood. When variances appeared, we flagged them, revisited assumptions, and scheduled follow-up calls when price, mix, or channel shares did not match what participants see in market.
We used a multi-step review to keep category boundaries, currency conversion timing, and country aggregation logic consistent before sign-off. Reports are refreshed annually, with interim updates when material events occur, such as major capacity additions, sharp raw material price shifts, or regulation changes affecting labeling or packaging. Before delivery, a final analyst pass is completed to ensure the latest public data points are incorporated.
Mordor Intelligence's Tinned Fish Market Estimate Compared With Other Published Estimates
Published market sizes for tinned fish can look far apart even when they refer to similar products, because counting rules are not always the same. Differences usually come from what gets included around canned seafood, how value is converted across currencies and years, and whether pricing is built from real pack sizes and channel mix or assumed as a single average.
By tracking pack-size normalized pricing, channel mix, and trade-to-consumption consistency checks, Mordor Intelligence keeps the tinned fish total tied to finished packaged products rather than wider canned seafood baskets that can pull in adjacent items. The gap can also widen when an estimate uses a different base year, applies aggressive price escalation without validating drain-weight and premium mix, or is not refreshed after commodity fish and packaging cost changes.
Benchmark comparison
| Source | Market Size | Gaps in Research Methodology |
|---|---|---|
| Mordor Intelligence | USD 15.19 B (2026) | |
| Trade Publisher A | USD 18.40 B (2025) | Uses a different base year and appears to group tinned fish with a broader canned seafood scope, which can include non-fish seafood formats and wider product boundaries. |
| Industry Portal B | USD 13.43 B (2025) | Likely applies a narrower value capture, with limited visibility on channel coverage and price tiering, which can undercount premium packs and foodservice volumes in higher-income markets. |
The comparison shows that year selection and category boundaries explain most of the spread, followed by how pricing and channel mix are treated in the model. When clear inclusion rules, practical checks against trade and consumption signals, and repeatable price normalization are applied, the market size becomes easier to interpret and to reuse in planning.


Key Questions Answered in the Report
What is the current value of the tinned fish market?
The tinned fish market size is USD 15.19 billion in 2026 and is projected to rise to USD 19.56 billion by 2031.
Which species commands the largest share?
Tuna leads with 51.55% of 2025 global revenue, although mackerel is the fastest-growing species segment.
Why is Asia-Pacific the fastest-growing region?
Rising disposable incomes, rapid urbanization, and strong e-commerce uptake push Asia-Pacific to a 7.52% CAGR through 2031.
What role does e-commerce play in category growth?
Online channels grow at 7.29% CAGR by offering direct-to-consumer access, detailed product storytelling, and subscription models that foster loyalty.
Page last updated on:


 Your data is secure and never sold or shared.


