
Thyroid Eye Disease Treatment Market Size and Share
Market Overview
| Study Period | 2020 - 2031 |
|---|---|
| Market Size (2026) | USD 5.36 Billion |
| Market Size (2031) | USD 8.09 Billion |
| Growth Rate (2026 - 2031) | 8.57 % |
| Fastest Growing Market | Asia-Pacific |
| Largest Market | North America |
| Market Concentration | Medium |
Major Players *Disclaimer: Major Players sorted in no particular order Image © Mordor Intelligence. Reuse requires attribution under CC BY 4.0. | |
Thyroid Eye Disease Treatment Market Analysis by Mordor Intelligence
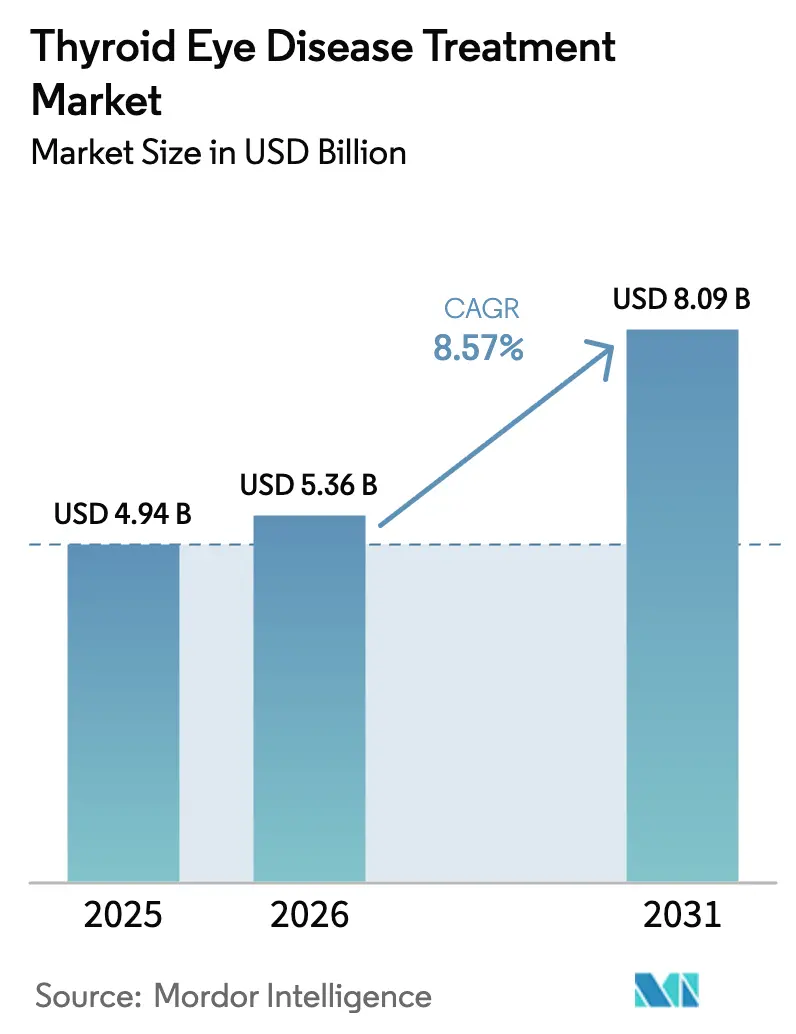
Thyroid eye disease treatment market size in 2026 is estimated at USD 5.36 billion, growing from 2025 value of USD 4.94 billion with 2031 projections showing USD 8.09 billion, growing at 8.57% CAGR over 2026-2031. Clinical validation of insulin-like growth factor-1 receptor (IGF-1R) inhibition, rising global screening initiatives, and streamlined orphan-drug pathways are transforming a once treatment-scarce arena into a competitive landscape. Investor confidence has strengthened after landmark transactions such as Amgen’s acquisition of Horizon Therapeutics, while late-stage biologics with more convenient dosing schedules promise to expand patient access. Parallel progress in telemedicine, multidisciplinary clinic networks, and international regulatory harmonization is repositioning the thyroid eye disease treatment market for sustained double-digit growth in underserved regions[1].
Key Report Takeaways
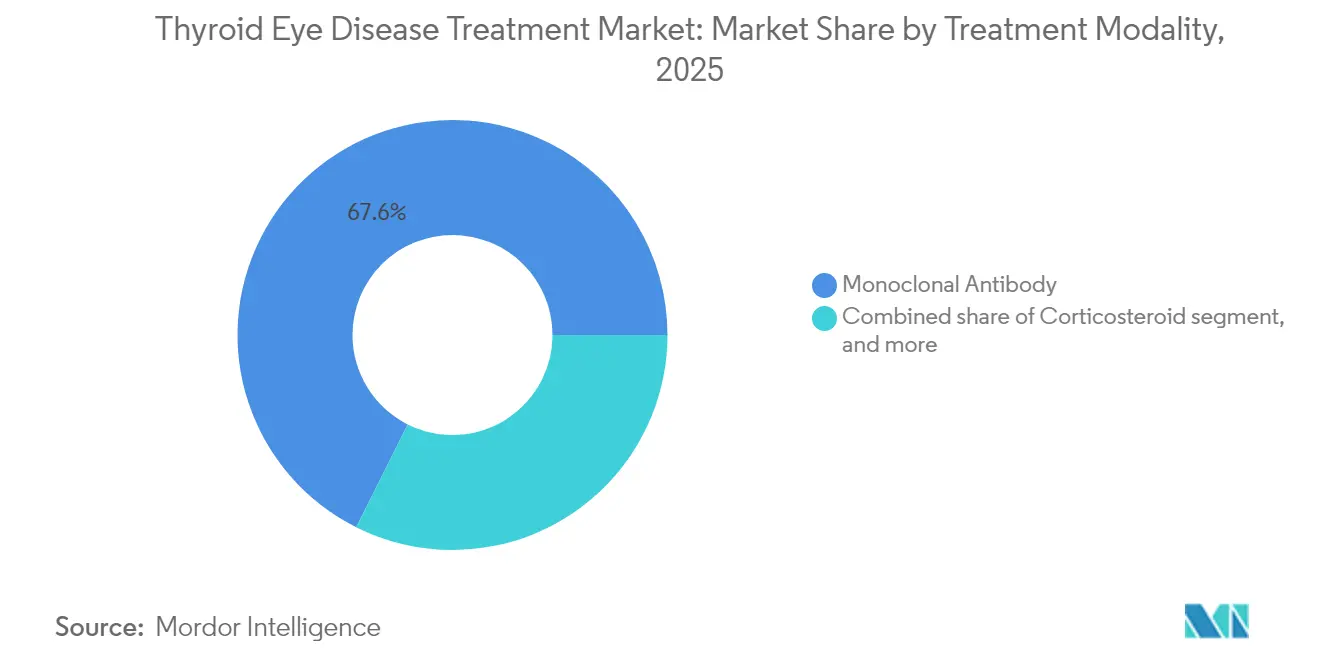
- By treatment modality, monoclonal antibodies led with 67.61% revenue share in 2025; subcutaneous and oral pipeline candidates are forecast to record the highest CAGR at 11.54% through 2031.
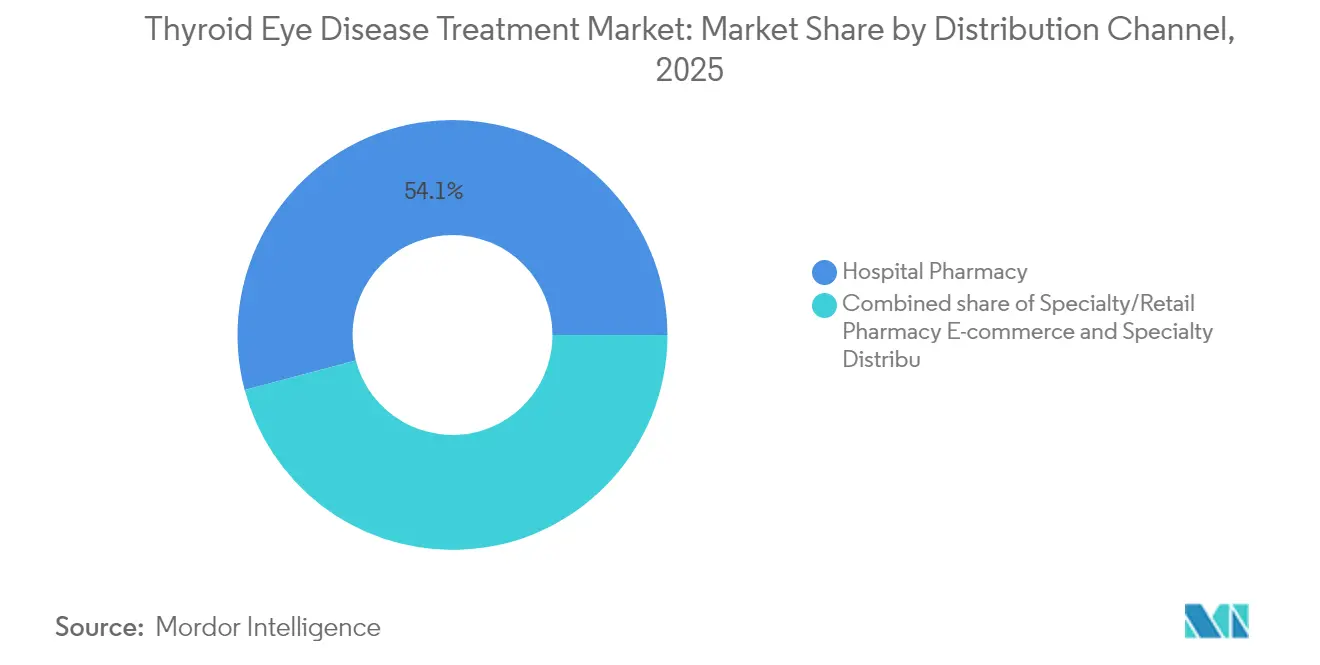
- By distribution channel, hospital pharmacies held 54.12% of the thyroid eye disease treatment market share in 2025, while e-commerce and specialty distributors are projected to expand at a 12.31% CAGR through 2031.
- By end user, tertiary-care hospitals commanded 48.92% share of the thyroid eye disease treatment market size in 2025, and specialty endocrine / ophthalmology clinics are advancing at an 11.08% CAGR to 2031.
- By geography, North America accounted for 46.25% share in 2025; Asia-Pacific is set to grow the fastest at 10.22% CAGR through 2031.
Note: Market size and forecast figures in this report are generated using Mordor Intelligence’s proprietary estimation framework, updated with the latest available data and insights as of 2026.
Market Trends and Insights
Drivers Impact Analysis of Thyroid Eye Disease Treatment Market*
| Driver | % Impact on CAGR Forecast | Geographic Relevance | Impact Timeline |
|---|---|---|---|
| Rising Global Prevalence of Autoimmune Thyroid Disorders | 1.80% | Global, with higher concentration in North America & Europe | Long term (≥ 4 years) |
| Growing Awareness & Screening Programs for Thyroid Dysfunction | 1.50% | APAC core, spill-over to MEA | Medium term (2-4 years) |
| Expansion Of Specialty Ophthalmology & Endocrinology Infrastructure | 1.20% | North America & EU, expanding to APAC | Medium term (2-4 years) |
| Favorable Orphan-Drug Incentives and Reimbursement Pathways | 2.10% | Global, with early gains in US, EU regulatory zones | Short term (≤ 2 years) |
| Advances In Biologic & Targeted Immunotherapy Platforms | 1.90% | Global | Long term (≥ 4 years) |
| Increasing Healthcare Expenditure on Vision-Saving Therapies | 1.40% | North America & EU, selective APAC markets | Medium term (2-4 years) |
| Source: Mordor Intelligence | |||
Rising Global Prevalence of Autoimmune Thyroid Disorders
Thyroid eye disease (TED) accompanies 25–50% of Graves’ disease cases and now affects roughly 1 million people in the United States alone. Urban lifestyle stressors, smoking, and iodine intake shifts are intensifying autoimmune thyroid dysfunction rates, especially in high-income economies. Broader recognition of Hashimoto-linked eye involvement enlarges the treatable patient base and reinforces the growth outlook for the thyroid eye disease treatment market. Demographic aging in developed regions further lifts prevalence, aligning with health-system capacity to manage chronic immune-mediated conditions.
Growing Awareness & Screening Programs for Thyroid Dysfunction
Inter-society clinical guidelines between endocrinology and ophthalmology bodies have shortened average time-to-diagnosis from 18-24 months to roughly 6–12 months in specialized centers[2]. Artificial-intelligence decision support embedded in primary care boosts early recognition of orbital changes, and tele-ophthalmology platforms extend specialist reach into rural areas. Earlier detection channels more patients into the active phase when biologic intervention yields maximal visual benefit, reinforcing uptake across the thyroid eye disease treatment market.
Favorable Orphan-Drug Incentives and Reimbursement Pathways
Breakthrough therapy and orphan-drug designations compress review timelines and confer up to seven years of exclusivity in major markets. Clear clinical end-points such as proptosis response simplify health-technology assessments, easing reimbursement hurdles. The resulting predictability underpins pipeline funding and supports accelerated launch strategies that expand the thyroid eye disease treatment market.
Advances in Biologic & Targeted Immunotherapy Platforms
Subcutaneous IGF-1R inhibitors like VRDN-003 offer 4–8 week dosing intervals versus the 3-week intravenous standard, boosting adherence and lowering infusion-center traffic[3]. Parallel research in IL-6 blockade, FcRn antagonists, and B-cell depletion widens mechanistic diversity, setting the stage for personalized combination regimens that may augment clinical response and durably modify disease.
Restraints Impact Analysis of Thyroid Eye Disease Treatment Market*
| Restraint | % Impact on CAGR Forecast | Geographic Relevance | Impact Timeline |
|---|---|---|---|
| High Treatment Costs and Payer Budget-Impact Concerns | -1.60% | Global, with acute impact in price-sensitive markets | Short term (≤ 2 years) |
| Limited Availability Of TED-Trained Specialists | -1.10% | APAC, MEA, selective EU markets | Medium term (2-4 years) |
| Safety & Tolerability Challenges with Systemic Biologics | -0.80% | Global | Long term (≥ 4 years) |
| Regulatory Uncertainty Around Off-Label & Emerging Therapies | -0.70% | Global, with regional variation in approval timelines | Medium term (2-4 years) |
| Source: Mordor Intelligence | |||
High Treatment Costs and Payer Budget-Impact Concerns
An average full-course biologic cost of USD 386,424 per patient, disclosed in company price filings, strains payer budgets. Prior-authorization processes extend beyond thirty days in many US plans, delaying therapy during the critical active disease window. In emerging economies, limited rare-disease budgets force tough resource allocation choices that restrict uptake and temper near-term expansion of the thyroid eye disease treatment market.
Limited Availability of TED-Trained Specialists
A survey by the American Society of Ophthalmic Plastic and Reconstructive Surgery found that fewer than 60% of TED patients are managed by a subspecialist. Urban clustering of expertise forces rural patients to travel long distances, adding indirect costs and contributing to under-treatment. Building human capital through fellowships and tele-mentoring is essential to unlock the next growth wave.
*Our forecasts treat driver/restraint impacts as directional, not additive. The impact forecasts reflect baseline growth, mix effects, and variable interactions.
Thyroid Eye Disease Treatment Market Segment Analysis
By Treatment Modality:
Biologics Sustain Segment DominanceMonoclonal antibodies captured 67.61% of the thyroid eye disease treatment market share in 2025, underpinned by teprotumumab’s 83% proptosis responder rate documented in pivotal trials. Intravenous delivery and hospital-based monitoring supported robust adoption despite logistical complexity. Small-molecule immunosuppressants and orbital radiation retained niche roles for maintenance or refractory cases but collectively accounted for less than one-fifth of revenue.
Pipeline momentum centers on subcutaneous IGF-1R inhibitors and oral agents such as linsitinib, which achieved a 52% proptosis response in Phase 2b/3 testing. Subcutaneous formulations promise at-home administration every 4–8 weeks, a shift likely to redistribute value toward outpatient settings. As these candidates secure approval, they are expected to lift the segment CAGR above the overall market pace, deepening penetration among patients deterred by infusion burdens and reinforcing growth across the thyroid eye disease treatment market.

By Distribution Channel:
Digital Pathways Disrupt Conventional SupplyHospital pharmacies held 54.12 % of 2025 revenue because infusion-requiring biologics depend on institution-based cold-chain storage and specialist oversight. This dominance is projected to erode gradually as subcutaneous and oral therapies reach market, allowing prescriptions to migrate into community and home settings. Specialty distributors and e-commerce platforms are forecast to post a 12.31 % CAGR, benefiting from direct-to-patient fulfillment models, insurance navigation support, and adherence monitoring apps that strengthen retention.
Rising adoption of tele-ophthalmology consultations through networks such as Medii shortens diagnostic lag and aligns with home-delivery logistics. These parallel trends broaden access in remote regions, lower facility fees, and tighten supply-chain transparency, attracting manufacturers eager to secure consistent margins while expanding the reach of the thyroid eye disease treatment market.
By End User:
Specialist Clinics Accelerate Patient-Centric CareTertiary-care hospitals generated 48.92% of 2025 revenue by offering comprehensive diagnostic imaging, infusion capabilities, and surgical backup. They also host clinical trials that refine treatment algorithms and facilitate early access programs. However, patient throughput is limited by scheduling bottlenecks and high overhead.
Specialty endocrine and ophthalmology clinics are predicted to grow at an 11.08% CAGR, empowered by streamlined care pathways and lower capital intensity. Purpose-built infusion suites, coupled with emerging subcutaneous options, enable higher visit volumes and shorter chair times, enhancing economic viability. As these clinics expand regionally, they underpin decentralization of care, boosting convenience for patients and reinforcing the long-term expansion of the thyroid eye disease treatment market.
Geography Analysis
North America Thyroid Eye Disease Treatment Market
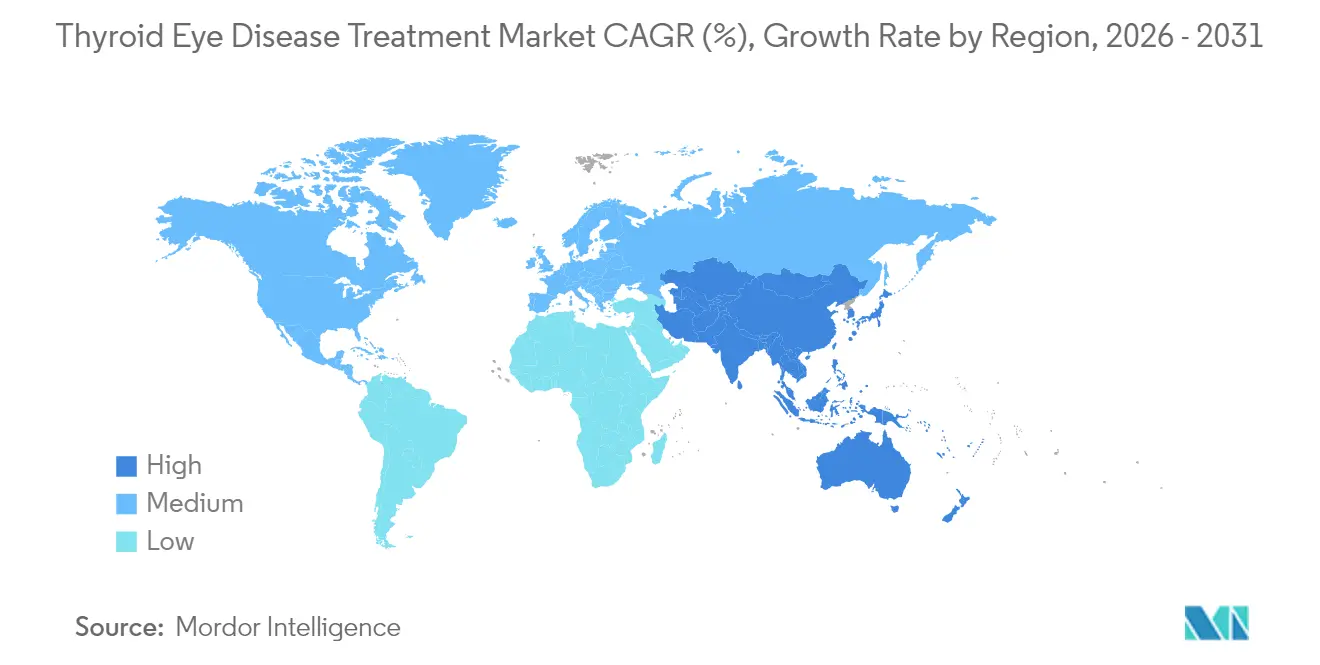
North America maintained a 46.25% revenue share in 2025, reflecting early FDA approval of teprotumumab and widespread insurance coverage. Integrated academic networks supply real-world evidence that steadily increases physician comfort with biologics. The thyroid eye disease treatment market size for North America is projected to reach USD 3.73 billion by 2031, supported by continuous pipeline launches and an aging population.
Europe Thyroid Eye Disease Treatment Market
Europe entered a new growth phase when the European Medicines Agency backed teprotumumab approval in April 2025, initiating country-level pricing negotiations. National health-technology assessments scrutinize cost-effectiveness but tend to green-light therapies that prevent vision loss. Robust research infrastructure facilitates post-marketing surveillance, critical for uptake under outcome-based reimbursement schemes. As local centers emulate US specialty-clinic models, regional penetration should accelerate, especially in Germany, France, and the Nordics.
APAC Thyroid Eye Disease Treatment Market
Asia-Pacific is on track for the fastest regional CAGR of 10.22% through 2031, propelled by rapidly modernizing healthcare systems and increasing endocrinology capacity. Japan already covers teprotumumab under its national insurance, while partnerships such as Amgen-Medii equip clinicians with teleconsultation tools for remote TED management. China and India remain cost-sensitive but are piloting orphan-drug funds that could unlock broader access. Rising autoimmune-disease incidence linked to urban stress and lifestyle change adds further momentum, positioning the thyroid eye disease treatment market for significant scale-up in the region.
Regulatory Landscape
Regulatory pathways for thyroid eye disease (TED) therapies increasingly rely on expedited programs used for rare, vision-threatening conditions, which typically shortens review timelines for targeted biologics. In the United States, the FDA approved Lumvoa (veligrotug-vvze) in June 2026 for TED, and the same period saw the agency grant Priority Review to Genentech/Roche for Enspryng (satralizumab) in TED, reflecting the regulator's active use of accelerated review levers for differentiated profiles in this indication.
Across Europe, country-level access is shaped by centralized scientific assessment followed by national reimbursement decisions. The UK MHRA granted marketing authorisation to Amgen's TEPEZZA (teprotumumab) in May 2025, expanding availability beyond the United States and adding another reference market for payers and clinical bodies. Clinical practice guidelines such as EUGOGO (2021) continue to anchor treatment sequencing and endpoints (including proptosis response), which in turn shapes trial design, payer evaluation, and real-world adoption standards.
Competitive Landscape
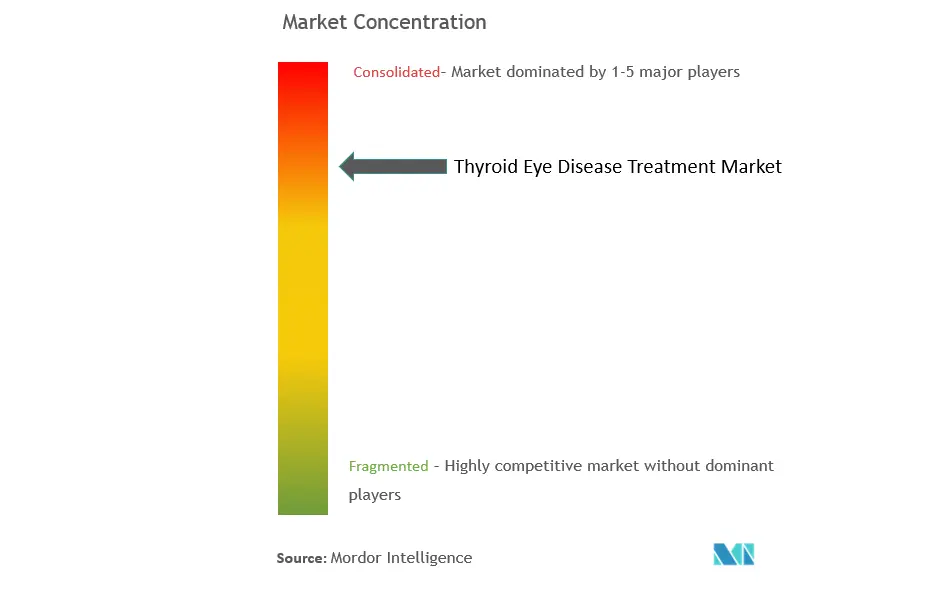
The thyroid eye disease treatment industry remains moderately concentrated. Amgen’s control of teprotumumab following its USD 27.8 billion Horizon Therapeutics acquisition established a clear market leader with extensive commercial infrastructure. Yet competitive pressure is intensifying as five Phase 3 programs approach submission. Viridian Therapeutics secured Breakthrough Therapy designation for veligrotug after delivering 70% proptosis response in active TED and 56% in chronic disease, signaling a credible rival entry point.
Innovation is coalescing around three strategic levers. First, differentiated formulations such as long-acting subcutaneous injections promise superior patient convenience. Second, alternative mechanisms including FcRn inhibition aim to broaden the responder pool. Third, companies are bundling therapeutics with digital-health services to streamline care coordination. Early examples include AI-driven symptom trackers integrated into specialty-pharmacy workflows that flag non-adherence proactively.
Competition is also expanding geographically. Domestic biotechs in Japan and China are advancing IGF-1R and IL-6 candidates, leveraging regional clinical-trial networks for rapid enrollment. Multinational firms increasingly partner with local distributors to navigate complex reimbursement systems while securing data exclusivity. These dynamics suggest that the thyroid eye disease treatment market will remain innovation-driven, with share shifts dictated by demonstrable gains in efficacy, convenience, and affordability.
Thyroid Eye Disease Treatment Industry Leaders
-
F. Hoffmann-La Roche Ltd
-
Amgen Inc.
-
Novartis AG
-
Viridian Therapeutics Inc.
-
Immunovant Inc.
- *Disclaimer: Major Players sorted in no particular order
Thyroid Eye Disease Treatment Market Companies Covered in this Report
- Amgen
- Roche
- Novartis
- Viridian Therapeutics Inc.
- Immunovant Inc.
- Abbvie
- Pfizer
- Regeneron Pharmaceuticals
- Horizon Therapeutics (legacy)
- Johnson & Johnson
- Alcon
- Bausch + Lomb Corp.
- Santen Pharmaceutical Co. Ltd.
- Sun Pharmaceuticals Industries
- Cipla
- Eyevance Pharmaceuticals
- Lupin
- Teva Pharmaceutical Industries
- Viatris
- Allakos Inc.
Market Opportunities and Future Outlook
The 2026 regulatory cycle expanded the commercial opportunity set by moving TED from a single-approved, targeted-therapy environment toward a multi-player category where differentiation can be built around disease stage and route of administration. FDA approval of Lumvoa (veligrotug-vvze) in June 2026, with labeling spanning both active and chronic TED, creates room for companies to position therapies around chronic-stage management and earlier referral pathways. In parallel, Genentech/Roche receiving FDA Priority Review in June 2026 for Enspryng (satralizumab) in TED points to regulator receptivity to mechanisms beyond IGF-1R, supporting strategies centered on alternative immune pathways and more tailored patient selection.
Care delivery and channel mix also present clearer value creation opportunities as pipelines emphasize reduced administration burden. Subcutaneous and other lower-infusion-load formats align with the shift toward specialty endocrine/ophthalmology clinics and non-hospital fulfillment models highlighted in current care patterns. This creates a route for manufacturers and specialty distributors to expand reach where infusion capacity and TED-trained specialists are bottlenecks, particularly when paired with payer navigation, specialty pharmacy services, and tele-ophthalmology enabled referral networks to address underdiagnosis and improve continuity of care without relying solely on hospital infusion infrastructure.
Recent Industry Developments in Thyroid Eye Disease Treatment Market
- June 2026: Viridian Therapeutics: The FDA approved Lumvoa (veligrotug-vvze) for thyroid eye disease, making it the first therapy with labeling for both active and chronic disease. The approval shifts market dynamics by introducing a competing option to Tepezza and broadens labeling across TED stages.
- June 2026: Viridian Therapeutics: The U.S. FDA approved Lumvoa (veligrotug-vvze) on June 26, 2026, for the treatment of thyroid eye disease, making it the first therapy approved with labeling for both active and chronic disease. This event further intensifies competition in TED and expands patient access across disease stages.
- April 2026: Immunovant Inc.: Batoclimab Phase 3 trials in TED failed to meet primary endpoint. The setback reduces near-term competitive pressure from Immunovant in TED and refocuses resources to other indications and candidates.
Thyroid Eye Disease Treatment Market Report Scope and Research Methodology
Market Definition and Coverage
This market covers revenues generated from medical and surgical treatments used to manage thyroid eye disease (TED) across hospital and outpatient care settings, and is tracked across major regions in USD terms.
Scope exclusions: We exclude diagnosis-only revenues, general thyroid disorder drugs that are not used for TED, and non-therapeutic services such as routine eye exams and cosmetic procedures.
Segments Covered in This Report
- By Treatment Modality
- Monoclonal Antibody
- Small-Molecule Immunosuppressant (Mycophenolate, Sirolimus)
- Corticosteroid (IV, Oral, Local Injection)
- Orbital Radiation Therapy
- Other Treatment Modalities
- By Distribution Channel
- Hospital Pharmacy
- Specialty/Retail Pharmacy
- E-commerce & Specialty Distributors
- By End User
- Tertiary-Care Hospitals
- Specialty Endocrine/Ophthalmology Clinics
- Ambulatory Surgery Centers
- Geography
- North America
- United States
- Canada
- Mexico
- Europe
- Germany
- United Kingdom
- France
- Italy
- Spain
- Rest of Europe
- Asia-Pacific
- China
- Japan
- India
- Australia
- South Korea
- Rest of Asia-Pacific
- Middle East & Africa
- GCC
- South Africa
- Rest of Middle East & Africa
- South America
- Brazil
- Argentina
- Rest of South America
- North America
Data Sources, Market Sizing, and Validation
Desk Research
Desk research starts by mapping the treated patient pool and standard care pathways, then linking that picture to observable healthcare activity. We mainly rely on public health and regulatory sources, such as US FDA drug labels and approvals databases, US CDC and NCHS health statistics series, the WHO Global Health Observatory, and OECD health data tables. We also use clinical literature in PubMed-indexed journals to understand treatment patterns across active versus inactive disease and typical dosing schedules.
To keep commercial assumptions realistic, we add context from sources such as SEC filings, annual reports, investor slide decks, and publications from medical societies and hospital networks that discuss patient journeys and referral patterns. Paid subscriptions are used in a limited way for company financials and intelligence, patent databases, and news and financials, which helps validate launch timing, pipeline maturity, and pricing commentary. These examples are illustrative only, and many other sources were also referred to for data collection, validation, and clarification.
Primary Interviews and Surveys
Primary work is used to pressure-test the desk assumptions and to fill gaps where public sources do not provide clear signals, especially around treated share, channel mix, and real-world dosing persistence. We spoke with a mix of clinicians, hospital pharmacy stakeholders, distributors, and industry specialists across key geographies, so the model reflects different access conditions and reimbursement environments.
Distribution of primary research fieldwork respondents
| Company type | Respondent position | Region |
|---|---|---|
| Top tier: 27% | CXOs: 12% | APAC: 46% |
| Mid tier: 59% | Functional/Unit leaders: 37% | EMEA: 34% |
| Smaller Players: 14% | Managers: 51% | Americas: 20% |
Market-Sizing & Forecasting
Our sizing approach uses top-down and bottom-up logic in a practical order. First, prevalence and diagnosis signals are translated into a treated-patient demand pool, which is then converted into revenue using therapy uptake, dosing intensity, and typical duration of treatment. Those totals are cross-checked with selective bottom-up approximations, such as sampled price per course multiplied by estimated treated volumes by region, supported by channel checks on where therapy is actually dispensed, and then adjusted when ranges do not align.
Key inputs used in the model include estimated TED prevalence and active-disease share, diagnosis and referral rates to ophthalmology or endocrinology clinics, biologic versus steroid and surgery utilization patterns, average dosing schedules and persistence, and average net price movement by geography after typical discounts. Where a bottom-up view is thin (for example in smaller countries with limited disclosure), we bridge gaps using proxy indicators like specialty clinic density, access constraints, and peer-country treatment rates that were confirmed in interviews.
For forecasting, we use scenario analysis supported by a light multivariate regression check, so growth ties back to a few observable drivers. The drivers most often referenced in interviews were biologic adoption curves, label expansions and launch timing, reimbursement tightening or loosening, and shifts in surgery rates as pharmacologic options expand.
Data Validation & Update Cycle
Outputs are validated through triangulation across independent signals, and then reviewed for outliers before sign-off. We compare modeled revenues against expected treatment volumes, known dosing norms, and regional access patterns, and then re-check any sharp jumps by revisiting pricing, uptake, and epidemiology assumptions.
A second analyst review is completed to catch inconsistencies in units, currency timing, and regional roll-ups, followed by re-contact triggers when interview feedback conflicts with the desk picture. Reports are refreshed annually, and interim updates are made when material events occur, such as a major approval, safety update, or reimbursement change. Before delivery, a final pass is completed so clients receive the most current view available at that time.
Mordor Intelligence's Thyroid Eye Disease Treatment Market Size Compared With Other Published Estimates
Published market sizes for thyroid eye disease treatment can look far apart because the counted patient pool and the monetization logic are not consistent across sources. Differences usually come from what is treated as TED-specific revenue, which geographies are included, and whether the estimate is built from treated patients or from product sales snapshots.
The main gap comes from whether mild and watchful-wait patients are monetized as treated demand, where Mordor Intelligence counts revenues only when a therapy course or procedure is initiated, then scales by persistence and net pricing rather than broad prevalence totals.
Benchmark comparison
| Source | Market Size | Gaps in Research Methodology |
|---|---|---|
| Mordor Intelligence | USD 5.36 B (2026) | |
| Industry Bulletin A | USD 4.43 B (2024) | Uses an earlier base year and blends estimated and historical years, which can understate the step-change from new biologic uptake and recent access expansion across regions. |
| Therapy Insights B | USD 2.10 B (2024) | Limits coverage to a set of leading markets and often tracks treated sales in those geographies, which excludes long-tail countries and reduces the contribution from emerging access and treatment adoption. |
The spread in the table is mainly explained by year choice and, more importantly, which geographies and treated cohorts are counted. By tying revenue to therapy initiation, dosing persistence, and regional net price logic, the estimate stays traceable to repeatable variables that can be re-checked as new approvals and access changes occur.
Key Questions Answered in the Report
What is the current size of the thyroid eye disease treatment market?
The thyroid eye disease treatment market size is USD 5.36 billion in 2026 and is forecast to reach USD 8.09 billion by 2031.
Which treatment modality leads the market today?
Monoclonal antibodies dominate with 67.61% revenue share in 2025, primarily due to teprotumumab’s strong clinical performance.
Why is Asia-Pacific expected to grow the fastest?
Healthcare modernization, expanding endocrinology capacity, and increased autoimmune-disease awareness drive a 10.22% CAGR in Asia-Pacific through 2031.
How are new delivery formats changing patient care?
Subcutaneous IGF-1R inhibitors and oral small-molecule therapies reduce reliance on hospital infusions, improving convenience and broadening access.
What factors could restrain near-term growth?
High drug prices, limited specialist availability, and payer budget pressures may slow uptake, especially in cost-sensitive regions.
Who are the key emerging competitors?
Viridian Therapeutics, Immunovant, and Sling Therapeutics are advancing late-stage programs that could challenge Amgen’s leadership over the next five years.