
Thrust Vector Control Market Size and Share
Market Overview
| Study Period | 2019 - 2031 |
|---|---|
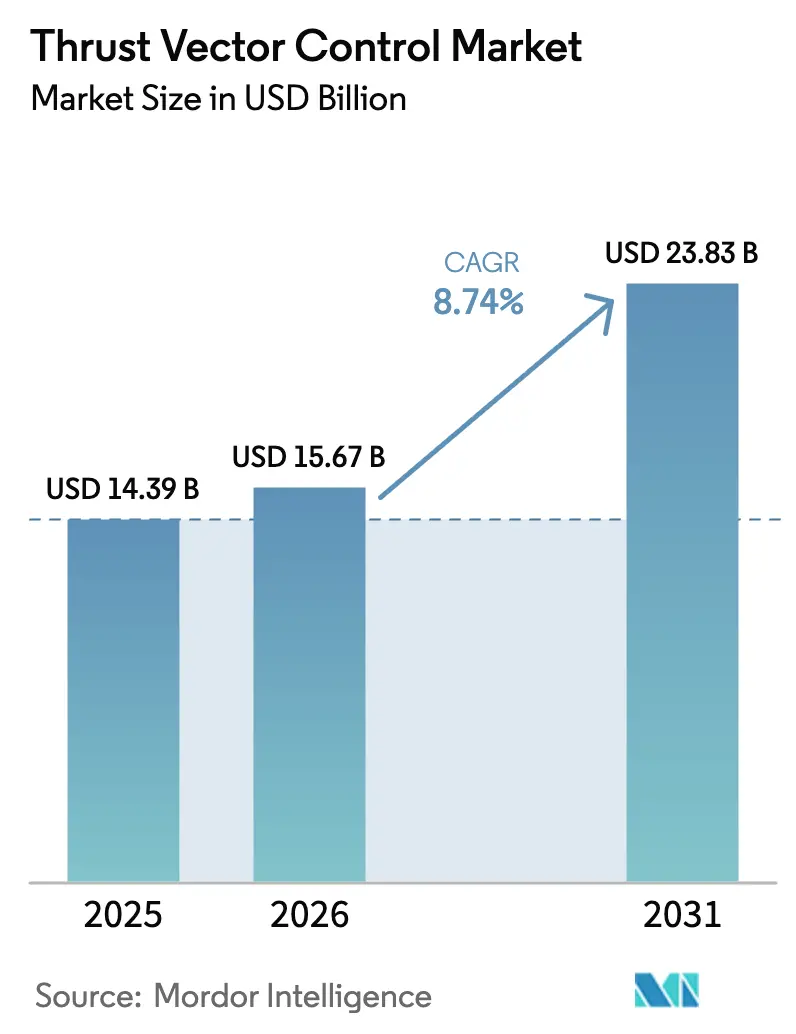
| Market Size (2026) | USD 15.67 Billion |
| Market Size (2031) | USD 23.83 Billion |
| Growth Rate (2026 - 2031) | 8.74% CAGR |
| Fastest Growing Market | Asia-Pacific |
| Largest Market | North America |
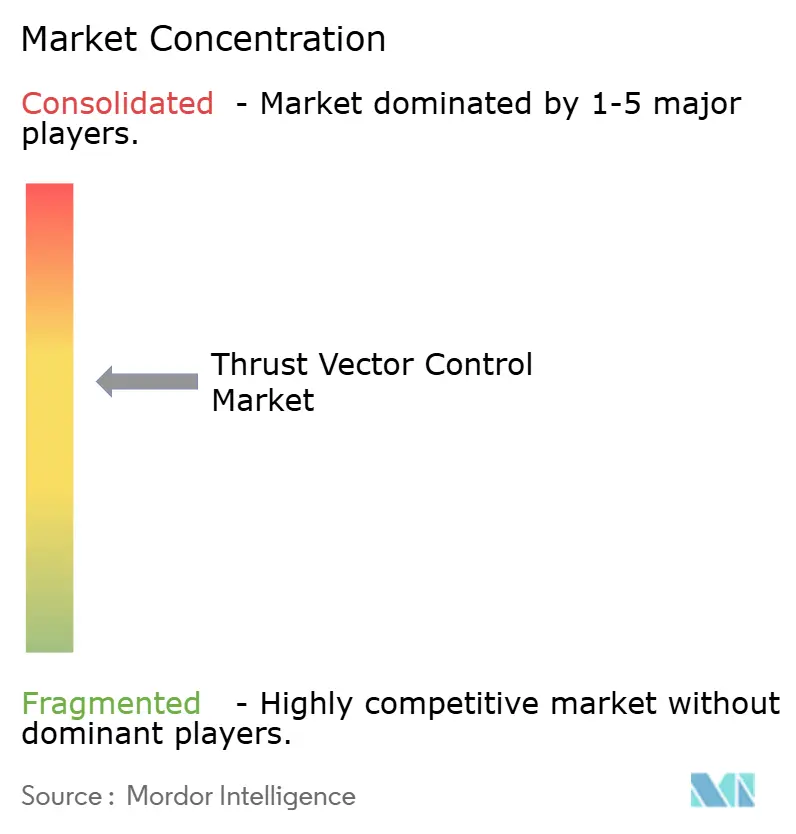
| Market Concentration | Medium |
Major Players *Disclaimer: Major Players sorted in no particular order Image © Mordor Intelligence. Reuse requires attribution under CC BY 4.0. | |
Thrust Vector Control Market Analysis by Mordor Intelligence
The thrust vector control market size is expected to grow from USD 14.39 billion in 2025 to USD 15.67 billion in 2026 and is forecasted to reach USD 23.83 billion by 2031 at an 8.74% CAGR over 2026-2031. Growing launch cadence in the commercial space segment and the scale-up of reusable architectures are expanding demand for high-reliability actuators that can tolerate repeated thermal and mechanical cycles. The surge in US orbital activity, led by SpaceX, and the parallel push by Chinese commercial firms to field reusable methane-fueled vehicles, are reinforcing a multi-year order pipeline for thrust vector control hardware, software, and services. Reusable economics are compressing launch costs and raising fleet utilization, thereby increasing inspection, repair, and overhaul events for thrust vectoring subsystems across first- and upper-stage vehicles. Defense modernization is equally influential, as missile stockpile replenishment and next-generation programs fuel new production runs and upgrades for fin actuation, divert and attitude control, and nozzle vectoring solutions across tactical and strategic systems. The technology mix is shifting from hydraulic to all-electric designs to cut weight and simplify maintenance while enabling tighter digital control loops and improved efficiency, as seen in Starship’s planned electric TVC implementation for upper-stage Raptor engines.
Key Report Takeaways
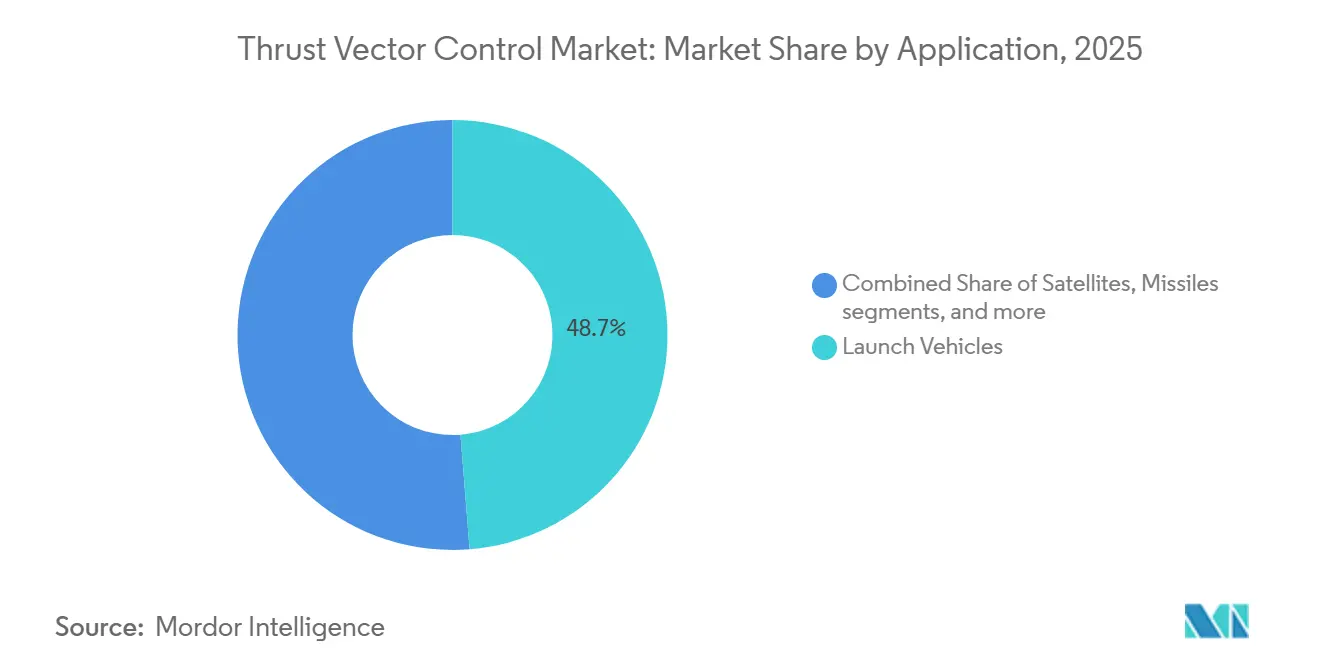
- By application, launch vehicles led with 48.73% revenue share in 2025, while satellites are forecasted to expand at a 10.68% CAGR through 2031.
- By end user, defense held 66.82% of the market in 2025, while space agencies are poised to grow at a 10.37% CAGR through 2031.
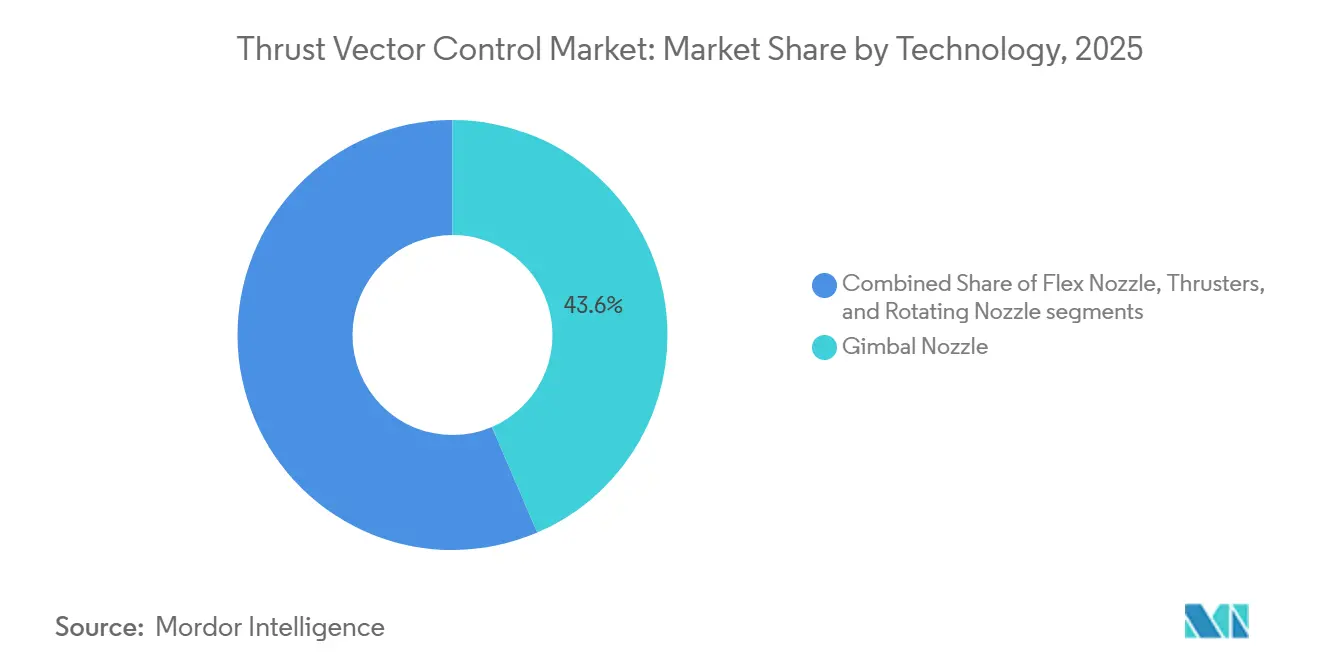
- By technology, gimbal nozzles accounted for a 43.55% share in 2025, while rotating nozzles are projected to post the fastest growth at an 11.51% CAGR through 2031.
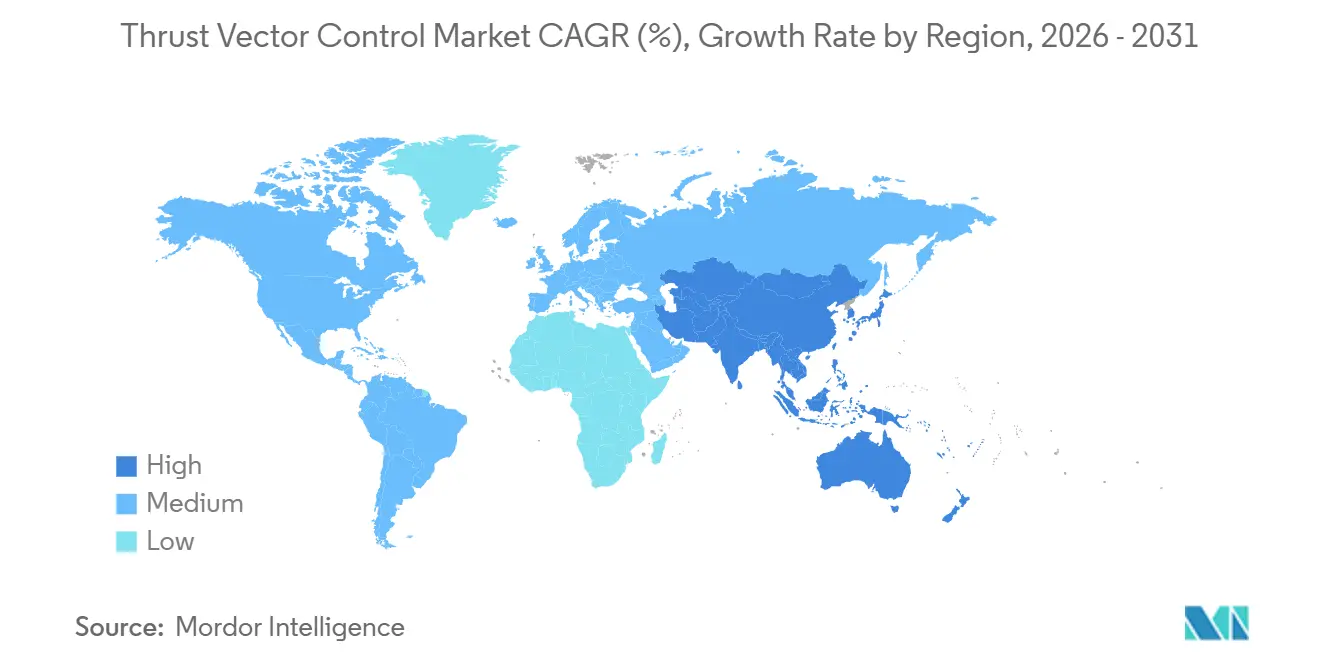
- By geography, North America retained a 46.38% share in 2025, while Asia-Pacific is set to register the fastest growth at a 9.77% CAGR through 2031.
Note: Market size and forecast figures in this report are generated using Mordor Intelligence’s proprietary estimation framework, updated with the latest available data and insights as of January 2026.
Global Thrust Vector Control Market Trends and Insights
Drivers Impact Analysis*
| Driver | (~) % Impact on CAGR Forecast | Geographic Relevance | Impact Timeline |
|---|---|---|---|
| Rising launch-vehicle cadence and small-sat demand | +2.1% | Global, with concentrations in North America, Asia-Pacific (China, India), and Europe | Medium term (2-4 years) |
| Missile fleet modernization in major defense budgets | +2.4% | Global, strongest in North America, Asia-Pacific, Middle East | Long term (≥ 4 years) |
| Reusable rockets amplifying TVC maintenance cycles | +1.6% | North America, Asia-Pacific core, spill-over to Europe | Medium term (2-4 years) |
| Hypersonic weapons race among the US, China, and Russia | +1.3% | National, with early gains in US (Huntsville, Tucson), China, Russia | Long term (≥ 4 years) |
| Commercial space-tourism and private crewed-mission boom | +0.7% | North America & EU | Short term (≤ 2 years) |
| Transition from hydraulic to all-electric actuators | +0.8% | Global | Medium term (2-4 years) |
| Source: Mordor Intelligence | |||
Rising Launch-Vehicle Cadence and Small-Sat Demand
Global launch operations scaled to record levels in 2024 and then accelerated through 2025, with SpaceX conducting 165 orbital missions that accounted for the bulk of US activity and driving steady demand for thrust vector control systems and spares across first- and second-stage systems. Chinese commercial launch firms advanced reusable methane-fueled vehicles, and program milestones set in 2025 and 2026 signaled a region-wide shift toward reusable platforms that intensify actuator duty cycles and ground turnaround work. Reusability has increased post-flight inspections and component refurbishment, which increases the lifetime value for thrust vector control providers as launch frequency rises and fleets age. Large constellation programs such as Project Kuiper have booked launch capacity across multiple providers, which underpins long-range demand for vectoring hardware on both heavy-lift and medium-lift vehicles used to seed orbit planes at pace. This scale introduces more exacting requirements for actuator responsiveness and thermal resilience, especially for rapid relight and precision landing maneuvers in reusable operations. The thrust vector control market benefits from this cadence-driven expansion because higher flight rates and reflight targets increase the installed base, the maintenance loop, and the need for digital control upgrades over time.
Missile Fleet Modernization in Major Defense Budgets
Munitions and missile defense recapitalization programs are scaling through multi-year procurements and capacity expansions, creating stable demand for guidance, control, and thrust vectoring subsystems across air defense, cruise missiles, and interceptors. Global military expenditure rose meaningfully in 2024, and public budgets in 2025 and 2026 have prioritized standoff strike, integrated air and missile defense, and long-range fires, which pull through actuation hardware and control electronics. Japan approved its largest defense budget to date for fiscal 2026, allocating significant funds to standoff missile capability, including domestic Type-12 surface-to-ship missiles, which sustains demand for vectoring, fin actuation, and control units across production lots.[1]Mari Yamaguchi, “Japanese Cabinet Approves Record Defense Spending,” AP News, apnews.com Prime contractors have formalized framework agreements to accelerate output of critical munitions, with production targets reaching into the thousands per year across multiple lines, supporting supplier tooling, workforce expansion, and long-lead material contracts for thrust vector control components. This procurement tempo underscores the value of modularity and common interfaces for actuators and control cards, enabling adaptation across families of missiles with minimal redesign, thereby shortening qualification cycles and reducing unit cost over time. As these modernization waves continue, the thrust vector control market captures growth from both new starts and retrofit programs that upgrade legacy inventories to meet new range, maneuverability, and survivability requirements.
Reusable Rockets Amplifying TVC Maintenance Cycles
SpaceX extended its first-stage reuse records and tallied a high volume of booster landings in 2025, highlighting the wear profile that actuators and gimbal mechanisms endure across multiple cycles of ascent, entry, and landing. Lower cost per kilogram from partial and planned full reusability is changing mission economics, increasing flight rates, and expanding demand for life-limited elements within vectoring systems that require replacement or overhaul after defined cycles. Chinese firms executed vertical takeoff and landing demonstrations and scheduled orbital test flights of reusable, methane-fueled vehicles into 2026, indicating a widening customer base for ruggedized electromechanical actuators and control electronics that can withstand thermal gradients and dynamic loads unique to return and landing. The cadence targets set by next-generation heavy-lift concepts place significant emphasis on rapid inspection and swap-friendly architecture for thrust vector control subsystems to support quick turnarounds. Operators and insurers have identified thrust vectoring as a key enabler of safe landings and precision control, which influences design choices for materials, cooling, drive systems, and software redundancy. This reuse-driven operating model lifts recurring service revenue and deepens long-term customer relationships for vendors in the thrust vector control market.
Commercial Space-Tourism and Private Crewed-Mission Boom
Suborbital and orbital crewed missions set elevated safety and reliability thresholds for propulsion vectoring components, which lengthen qualification timelines and increase content value per flight article. Blue Origin completed its 37th New Shepard mission in December 2025. Then it reallocated resources in early 2026 to accelerate human lunar capability development, reflecting a roadmap that still requires robust, flight-proven actuation and control subsystems as systems evolve.[2]Blue Origin Communications, “New Shepard Completes 37th Mission,” Blue Origin, blueorigin.com Sierra Space advanced the Dream Chaser program toward its first orbital cargo mission by completing key pre-flight milestones at the Kennedy Space Center in late 2025, signaling readiness steps that set interface and reliability expectations for suppliers of thrust vector control components on related propulsion modules and docking maneuver thrusters. Private crewed flights under commercial frameworks have also demonstrated rigorous test and certification paths that translate into stringent configuration control and documentation for all critical systems. These missions drive continuous improvements in actuator health monitoring, redundancy, and digital command architectures to support fault tolerance and crew safety across ascent and reentry segments. As commercial human spaceflight expands, the thrust vector control market captures premium opportunities tied to higher assurance levels and extended verification regimes that differentiate crewed from uncrewed programs. Vendors that can demonstrate reliability in crewed environments are well-positioned to win new contracts across both public and private programs.
Restraints Impact Analysis*
| Restraint | (~) % Impact on CAGR Forecast | Geographic Relevance | Impact Timeline |
|---|---|---|---|
| High qualification and certification cost | -0.9% | Global, with regulatory influence from NASA, FAA, ESA, ISRO | Long term (≥ 4 years) |
| Stringent reliability/safety thresholds in human–rated flight | -0.6% | National, with early gains in US (Cape Canaveral), Europe, Japan | Long term (≥ 4 years) |
| Supply bottlenecks in high-temperature composite nozzles | -0.5% | Global, with acute challenges in North America, Asia-Pacific | Medium term (2-4 years) |
| Tightening export-control regimes on dual-use propulsion tech | -0.7% | National, with gains in US, Europe, China | Long term (≥ 4 years) |
| Source: Mordor Intelligence | |||
High Qualification and Certification Cost
Human spaceflight and national security programs impose rigorous standards, driving extensive verification and validation test campaigns for propulsion vectoring systems that add time and expense to development. NASA’s Aerospace Safety Advisory Panel highlighted structural and process challenges in developmental programs, reinforcing the need for strong systems engineering oversight and safety assurance, which can increase cost and delay certification for complex actuation and control elements. Commercial cargo and crew programs impose strict requirements on hardware and software integration, telemetry, and fault management, resulting in detailed documentation and qualification artifacts for thrust vector control components. FAA oversight in commercial human spaceflight adds another layer of safety processes, mishap review requirements, and return-to-flight conditions that affect propulsion vectoring systems and associated command software. These combined demands can stress smaller suppliers that lack large compliance teams, prompting them to partner with primes that already maintain mature quality systems and certification pathways. As a result, incumbents have an advantage in capturing high-assurance programs, while challengers must fund significant non-recurring engineering and qualification work before entering serial production. This cost intensity acts as a structural headwind for broad-based entry in the thrust vector control market.
Stringent Reliability/Safety Thresholds in Human-Rated Flight
NASA’s safety panel underscored the importance of clear roles and responsibilities, along with technical insight, in developmental spacecraft, noting that contracting structures can complicate risk management and slow issue resolution for crewed platforms. These observations translate into deeper scrutiny of propulsion vectoring hardware and software interfaces, redundancy, and failure modes, which lengthen test timelines and increase supplier obligations. FAA oversight also influences commercial crew activities, as mishap investigations can pause operations while corrective actions are validated, potentially cascading into supply plans for vectoring components. Human-rated vehicles require integrated system performance under maximum dynamic pressure, stage separation events, and reentry loads, imposing stringent design requirements on actuators, seals, bearings, and electronics. Vendors that can demonstrate proven reliability and provide comprehensive telemetry for condition monitoring are better placed to meet these thresholds. Even with that capability, the time and cost required to achieve approvals can slow the pace of new product introductions in the thrust vector control market.
*Our forecasts treat driver/restraint impacts as directional, not additive. The impact forecasts reflect baseline growth, mix effects, and variable interactions.
Segment Analysis
By Application: Launch Vehicles Drive Volume While Satellites Accelerate Fastest
Launch vehicles accounted for 48.73% of the thrust vector control market share in 2025, driven by reusable booster fleets and high-cadence constellation deployments. Reusability has increased lifecycle demand for actuators and vectoring hardware by enabling more maintenance cycles per vehicle. High launch rates in the US in 2025 highlighted the need for actuator reliability across repeated landings and rapid relights. Parallel developments in China with recoverable methane vehicles indicate a multi-regional opportunity for ruggedized TVC actuation and control electronics. These trends enhance the installed base, supporting predictive maintenance solutions and deeper integration of telemetry for health monitoring across thrust vector control subsystems.
Satellites are the fastest-growing application, with the thrust vector control market size for satellites projected to grow at a 10.68% CAGR from 2026 to 2031. Orbit-raising, station-keeping, and collision avoidance drive unit demand for control thrusters and precise actuation. The increasing number of active spacecraft boosts the need for reaction control systems and small thrusters. Human spaceflight logistics and cargo vehicles also influence vectoring content tied to rendezvous and docking maneuvers. As satellite volumes grow, standardization and modularity in vectoring components support common spares and lower total cost of ownership, strengthening the value proposition for operators renewing or expanding fleets.


By End User: Defense Dominates Supply While Space Agencies Pursue Sovereign Capability
Defense accounted for 66.82% of the market in 2025, driven by investments in missile defense, long-range strike, and inventory replenishment. Global military spending prioritized integrated air and missile defense and standoff weapons, leading to extended production runs and capacity expansions. Multi-year framework agreements scaled output across munitions lines, illustrating the demand for actuation and control suppliers. Export orders for air and missile defense systems reinforced the global footprint of thrust vector control content. Upgrades and new starts favored modular, ruggedized electromechanical solutions, strengthening suppliers' installed base and aftermarket potential.
Space agencies are forecasted to grow at a 10.37% CAGR through 2031 as nations invest in lunar logistics, Mars-return preparations, and new multi-mission landers and orbiters that require precise vectoring. Agency programs selecting new engines for lunar landers highlight the demand for throttleable propulsion and integrated engine controllers. Government cargo and resupply contracts for space stations and cislunar missions ensure a predictable cadence of missions where vectoring performance is critical. Programs blending civil and national security objectives expand the customer base for thrust vector control technology. Sovereign capability drives emphasize domestic supply chains and portfolio breadth, rewarding suppliers with proven heritage and documentation.
By Technology: Gimbal Nozzles Anchor Market as Rotating Nozzles Capitalize on Innovation
Gimbal nozzles captured a 43.55% share in 2025, maintaining a leadership position due to their versatility and proven performance across various applications, including small satellites, upper stages, and heavy-lift cores. These systems redirect thrust by tilting the engine or nozzle, supported by advanced actuator technology with a strong record of successful missions. Suppliers are expanding manufacturing capacity to support upcoming launch vehicle programs and hypersonic testbeds. This established heritage and associated ecosystem reinforce the gimbal segment’s ease of integration for new vehicles adopting proven architectures.
Rotating nozzles are projected to achieve the fastest growth, with an 11.51% CAGR through 2031, driven by advancements in compact directional control solutions for advanced missile systems and maneuver-critical platforms. These designs focus on high response rates, weight reduction, and digital control, aligning with the industry shift from hydraulic to electromechanical actuation. Thruster-based vectoring for spacecraft and satellites is also scaling with the deployment of constellations, increasing production volumes of small, precise control units. The technology base is advancing toward tighter software integration and standardized control electronics, streamlining qualification and reducing time-to-flight. As these systems gain flight heritage, the thrust vector control market benefits from upgrades and integration services that enhance responsiveness and maintainability.
Geography Analysis
North America retained 46.38% of the thrust vector control market share in 2025, supported by a large defense industrial base, high research and procurement outlays, and the world’s highest orbital cadence led by commercial providers. SpaceX executed 165 orbital launches in 2025 and widened the installed base of reusable first stages, which require rigorous actuator maintenance and frequent inspections, thereby supporting recurring demand for electromechanical subsystems and gimbal units.[3]Mike Wall, “SpaceX Shatters Its Rocket Launch Record Yet Again,” Space.com, space.com The US defense procurement in 2026 focuses on missile defense, standoff strike, and hypersonic development, sustaining orders for fin actuation and nozzle vectoring. NASA programs and commercial cargo initiatives continue to anchor supplier roadmaps, as Dream Chaser’s pre-flight milestones in late 2025 signaled progress toward first orbital operations, which require reliable vectoring for orbital maneuvering and reentry stability.
Asia-Pacific is projected to register the fastest growth, with the thrust vector control market in the region expanding at a 9.77% CAGR through 2031. National programs focus on reusable launch vehicles, military inventories, and sovereign satellite constellations. Chinese commercial firms reported progress on vertical recovery and planned orbital test flights through 2026, signaling demand for ruggedized vectoring systems. Japan’s record defense budget for fiscal 2026 emphasizes standoff missile capability and domestic production, elevating the need for fin actuation and nozzle vectoring content.
Europe continues to invest in space resilience and dual-use capabilities, creating opportunities for thrust vector control suppliers across launch, satellites, and defense applications. The European Space Agency advanced navigation and resilience efforts, while manufacturers delivered hardware for reusable-launcher landing legs and vectoring systems to support test campaigns. In the Middle East and Africa, defense spending growth and ambitions in space contribute to a rising addressable base for vectoring and control solutions, supported by regional procurement programs and new satellite initiatives.

Regulatory Landscape
Thrust vector control (TVC) operates under stringent safety and export-control regimes because it is safety-critical on launch and crewed systems and dual-use in missiles. In the United States, FAA oversight and related airworthiness expectations for electronic engine control architectures shape qualification rigor, including single-fault tolerance and system safety assessment requirements highlighted in a January 27, 2026 Federal Register rulemaking focused on electronic engine control system safety.
On the international trade and defense side, TVC-relevant hardware and technical data are captured in controlled-goods definitions used for licensing and compliance screening. EU export-control language explicitly enumerates TVC methods (for example, flexible nozzles, secondary-fluid injection, and movable engines/nozzles) under controlled categories. For advanced aircraft and powered-lift platforms that use thrust or propulsive control for attitude, EASA continues publishing Means of Compliance for its VTOL framework (SC-VTOL), which reinforces a documentation and verification burden that tends to favor suppliers with established certification processes and configuration control.
Value Chain Analysis
The thrust vector control value chain starts with high-spec materials and components (high-temperature alloys and composites for nozzles, precision bearings, seals, power electronics, and sensors). These feed machining, forming, and composite fabrication, then move into subsystem build, including electromechanical or hydraulic actuators, servo valves, gimbal structures, and control electronics and software, before integration at the propulsion-module, stage, missile, or spacecraft level. Prime contractors and launch or engine OEMs typically drive requirements flow-down, qualification test regimes, and interface standards, while tier suppliers provide flight hardware plus embedded software, acceptance testing, and documentation packages.
Downstream, more value shifts toward integration and lifecycle support. Systems engineering, hardware-in-the-loop test, telemetry-enabled health monitoring, spares provisioning, and MRO become more prominent for reusable launch architectures and long-lived defense inventories. Industry association reporting in 2026 (for example via ADS and peer bodies) has highlighted ongoing supply-chain ramp-up constraints across equipment and engine categories, which elevates the importance of dual sourcing, long-lead procurement, and qualified repair networks. Ecosystem platforms and supplier-development channels (including defense procurement conferences and MSME integration initiatives such as AeroDef Nexus in India) support new supplier onboarding, but entry is still gated by capital-intensive qualification, export compliance, and audited quality systems.
Competitive Landscape
Industry leaders are consolidating capabilities in actuation, control electronics, and integration services to capture growth across launch and defense applications. Woodward expanded its portfolio by acquiring Safran’s North American electromechanical actuation business in 2025 and secured selection to supply spoiler actuation systems for the Airbus A350, broadening its exposure in primary flight control and aftermarket services. Safran enhanced its capabilities by purchasing flight control and actuation activities from Collins Aerospace in 2025, adding scale across commercial and military applications, including missiles.
Program momentum remains critical as suppliers demonstrate flight heritage and production readiness across major platforms. Moog expanded its space actuation and avionics manufacturing capacity in 2025 to support priority development programs, underscoring sustained demand for precision thrust vector control and fin-steering solutions. Spaceplane and cargo vehicle integrators advanced toward first flights, with supplier ecosystems in place for propulsion and control subsystems, reinforcing the importance of qualification and integrated test campaigns for thrust-vectoring components.
On the munitions side, framework agreements were formalized in 2026 to expand production of critical missile systems, requiring scaled deliveries of actuation hardware and control electronics that meet strict standards. In launch, operators disclosed plans to test fully electric thrust vector control on heavy-lift vehicles, underscoring interest in advanced electromechanical solutions and integrated engine controllers. European suppliers delivered structural and vectoring systems for reusable launchers, demonstrating regional capabilities in composite structures and landing and control mechanisms.
Thrust Vector Control Industry Leaders
Honeywell International Inc.
Moog Inc.
RTX Corporation
Woodward, Inc.
BAE Systems plc
- *Disclaimer: Major Players sorted in no particular order

Market Opportunities and Future Outlook
Electrification and tighter digital control loops define a clear whitespace area inside thrust vector control, spanning actuators, power electronics, and software assurance for safety-critical control. Industry moves in 2026 reinforce that direction toward electric actuation and higher-integrity electronic controls: RTX Collins Aerospace opened an Engineering Center of Excellence in Wolverhampton, UK (July 2026) focused on electric actuation for thrust-related systems, and Moog received FAA authorization (TSO) for a 4-axis autopilot in 2026. Together, these developments point to regulator-recognized maturation of complex flight-control electronics and verification processes adjacent to TVC control architectures.
Another opportunity centers on aftermarket and industrial capacity expansion tied to higher utilization and defense replenishment, where repair networks, precision-flow hardware, and supplier tooling affect delivery cadence for TVC subsystems. Woodward expanded capability breadth through an agreement to acquire Valve Research and Manufacturing (March 2026), strengthening precision flow-control coverage that connects to propulsion control ecosystems, and it also broadened licensed repair pathways via an Elite-level repair service facility agreement with Lufthansa Technik (April 2026) for LEAP engine controls. On the defense-production side, multi-year capacity investments such as Honeywell Aerospace's March 2026 framework agreement with a USD 500 million multi-year production-capacity upgrade program reflect a procurement environment where qualified suppliers that can scale output while maintaining compliance and traceability can compete for expanding production lots.
Recent Industry Developments
- June 2026: RTX Corporation was selected by the U.S. Navy for a $1.1 billion contract to produce AIM-9X Block II missiles featuring 3-D thrust-vectoring control. This expands TVC capabilities for next-generation missile systems and strengthens RTX's role in integrated fire-control solutions. The award consolidates RTX's position in defense modernization efforts.
- April 2026: Moog Inc. announced successful steering of NASA's Artemis II mission using Moog TVC systems during the SLS rocket ascent. The achievement validates Moog's TVC technology in flagship space programs and strengthens credibility for future space launch demand. The result signals opportunities for adjacent space launch platforms and related service offerings.
- March 2026: Kratos Defense & Security Solutions was awarded a 49 million contract by NSWC Port Hueneme Division for production of up to 36 Oriole rocket motors and 3 TVC nozzle kits. This expands Kratos' TVC manufacturing footprint and ties to naval propulsion and test programs. The engagement reinforces Kratos' role in critical propulsion subsystems for defense programs.


Research Methodology Framework and Report Scope
Market Definition and Coverage
This market covers hardware and integrated systems that intentionally steer engine or motor thrust to control vehicle direction, stability, and maneuvering across aerospace and defense platforms. Values are captured as revenue generated from thrust vector control solutions supplied for new builds and upgrades.
Scope exclusions: We exclude adjacent flight-control electronics and general propulsion components when they are sold without a thrust vectoring function.
Segmentation Overview
- By Application
- Launch Vehicles
- Satellites
- Missiles
- Combat Aircraft
- By End User
- Defense
- Space Agencies
- By Technology
- Gimbal Nozzle
- Flex Nozzle
- Thrusters
- Rotating Nozzle
- By Geography
- North America
- United States
- Canada
- Mexico
- Europe
- United Kingdom
- France
- Germany
- Russia
- Rest of Europe
- Asia-Pacific
- China
- Japan
- India
- Australia
- Rest of Asia-Pacific
- South America
- Brazil
- Rest of South America
- Middle East and Africa
- Middle East
- United Arab Emirates
- Saudi Arabia
- Rest of Middle East
- Africa
- South Africa
- Rest of Africa
- Middle East
- North America
Data Sources, Market Sizing, and Validation
Desk Research
Desk research started with building the demand context around missile, aircraft, and launch activity, and then mapping where thrust vectoring is actually used. We used open sources such as defense budget documents and procurement releases, NASA program updates, FAA aircraft registry and safety publications, and UN Comtrade trade statistics for relevant aerospace parts as supporting signals.
To make the model usable by product and country, we also reviewed public company annual reports, investor presentations, and technical papers in aerospace engineering journals that explain nozzle types, actuation approaches, and typical integration choices. Where needed, we referenced paid subscriptions for company financials and intelligence, patent databases, and an import and export shipment-level database to cross-check supplier footprints and timing of program ramps. This list is not exhaustive, and we used additional public and paid sources for data collection, validation, and clarification during the study.
Primary Interviews and Surveys
Primary work focused on validating the split of demand across missiles, combat aircraft, and launch vehicles, and on pressure-testing pricing logic for different actuation technologies. We spoke with system integrators, component suppliers, and engineering or procurement roles across major regions so assumptions on fitment rates, replacement cycles, and program timing could be adjusted before finalizing the totals.
Distribution of primary research fieldwork respondents
| Company type | Respondent position | Region |
|---|---|---|
| Top tier: 35% | CXOs: 12% | APAC: 46% |
| Mid tier: 47% | Functional/Unit leaders: 39% | EMEA: 34% |
| Smaller Players: 18% | Managers: 49% | Americas: 20% |
Market-Sizing & Forecasting
Sizing was built using a combined top-down and bottom-up approach. First, program and fleet signals were translated into an addressable install base, then converted into value using realistic system pricing. On the top-down side, defense procurement and platform production cues are used to reconstruct demand pools for missiles, combat aircraft, and launch vehicles, followed by applying penetration and fitment assumptions for thrust vectoring by platform type.
The model is then corroborated with selective bottom-up approximations. For example, we rolled up a sampled set of supplier revenues, cross-checked shipped units or program lots where public data exists, and applied sampled ASP times volume for key technology types. Inputs that typically drive this section include launch cadence and vehicle mix, missile procurement volumes, new aircraft deliveries and retrofit activity, technology mix across gimbal and flex nozzles versus thruster-based solutions, and observed changes in actuator and nozzle material costs.
For forecasting, we used scenario analysis supported by expert views on defense budget direction, space launch cadence, and major program milestones, which tend to shift year to year. When gaps show up in bottom-up checks, they are handled using conservative proxy variables such as platform counts, typical subsystem content per vehicle, and region-level import signals, then normalized back to the most defensible demand pool.
Data Validation & Update Cycle
Each major assumption was checked in more than one way, and then results were compared against independent market signals that should move in the same direction as demand. Outliers at country, application, or technology level were flagged, reviewed by another analyst, and then traced back to the input driver that caused the variance.
If a variance could be linked to a real-world event such as a delayed program, a revised budget line, or a production-rate change, the model was updated and the related assumptions were rechecked through follow-up discussions. Reports are refreshed annually, with interim updates when material events occur, and a final pre-delivery pass is completed so clients receive the latest view at the time of purchase.
Mordor Intelligence's Thrust Vector Control Market Size Measured Against Other Published Estimates
Published market numbers for thrust vector control can look far apart because the counted scope changes, and because different studies use different platform totals and pricing paths. Differences also come from whether figures are anchored to defense and space end users only, or whether broader aerospace control content is indirectly mixed in.
Launch cadence, missile procurement lot sizes, and platform fitment rates are the checks that keep Mordor Intelligence's estimate tied to the real install base for thrust vectoring, and that can lift or reduce the total depending on how strictly those conditions are applied. In practice, the spread in published values is usually driven by what is treated as a complete TVC system versus a component, the assumed share of platforms that adopt vectoring, how replacement and retrofit cycles are treated, and the currency timing used for multi-region totals.
Benchmark comparison
| Source | Market Size | Gaps in Research Methodology |
|---|---|---|
| Mordor Intelligence | USD 15.67 B (2026) | |
| Trade Publisher A | USD 12.70 B (2024) | Uses an earlier base year and appears to mix revenue and output framing, which can understate near-term ramps when launch and missile procurement volumes accelerate after the base period. |
| Industry Portal B | USD 1.20 B (2024) | Likely applies a narrower definition that captures select components only, which compresses the total when complete system content and multi-platform applications are not fully counted. |
Overall, the table shows that most gaps are explainable through scope boundaries and how platform demand is translated into value. By keeping the model traceable to platform activity, adoption assumptions, and practical pricing checks, the final number stays easier to audit and update when programs shift.


Key Questions Answered in the Report
What is the current size and growth outlook for the thrust vector control market through 2031?
The thrust vector control market size is USD 15.67 billion in 2026 and is projected to reach USD 23.83 billion by 2031 at a CAGR of 8.74%.
Which application leads and which grows fastest in the thrust vector control market?
Launch vehicles led with 48.73% share in 2025, while satellites are forecasted to grow at a 10.68% CAGR from 2026 to 2031.
How are reusability trends shaping demand for thrust vector control systems?
Reusable boosters boost actuator duty cycles and maintenance events due to repeated ascent and landing, strengthening aftermarket and upgrade demand.
Which regions are most important for near-term growth in the thrust vector control market?
North America held 46.38% share in 2025, while Asia-Pacific is set to record the fastest growth with a 9.77% CAGR through 2031.
What technology shifts are most impactful in the thrust vector control industry?
The transition from hydraulic to fully electric actuation is improving efficiency and maintainability, with major operators planning flight tests on heavy-lift vehicles.
How do export controls and certification impact suppliers in this space?
Tightened export rules and rigorous NASA and FAA oversight add time and cost to qualification, which favors suppliers with strong compliance and flight heritage.
Page last updated on:






