
Thrombosis Drugs Market Size and Share
Market Overview
| Study Period | 2020 - 2031 |
|---|---|
| Market Size (2026) | USD 28.2 Billion |
| Market Size (2031) | USD 41.23 Billion |
| Growth Rate (2026 - 2031) | 7.89 % |
| Fastest Growing Market | Asia-Pacific |
| Largest Market | North America |
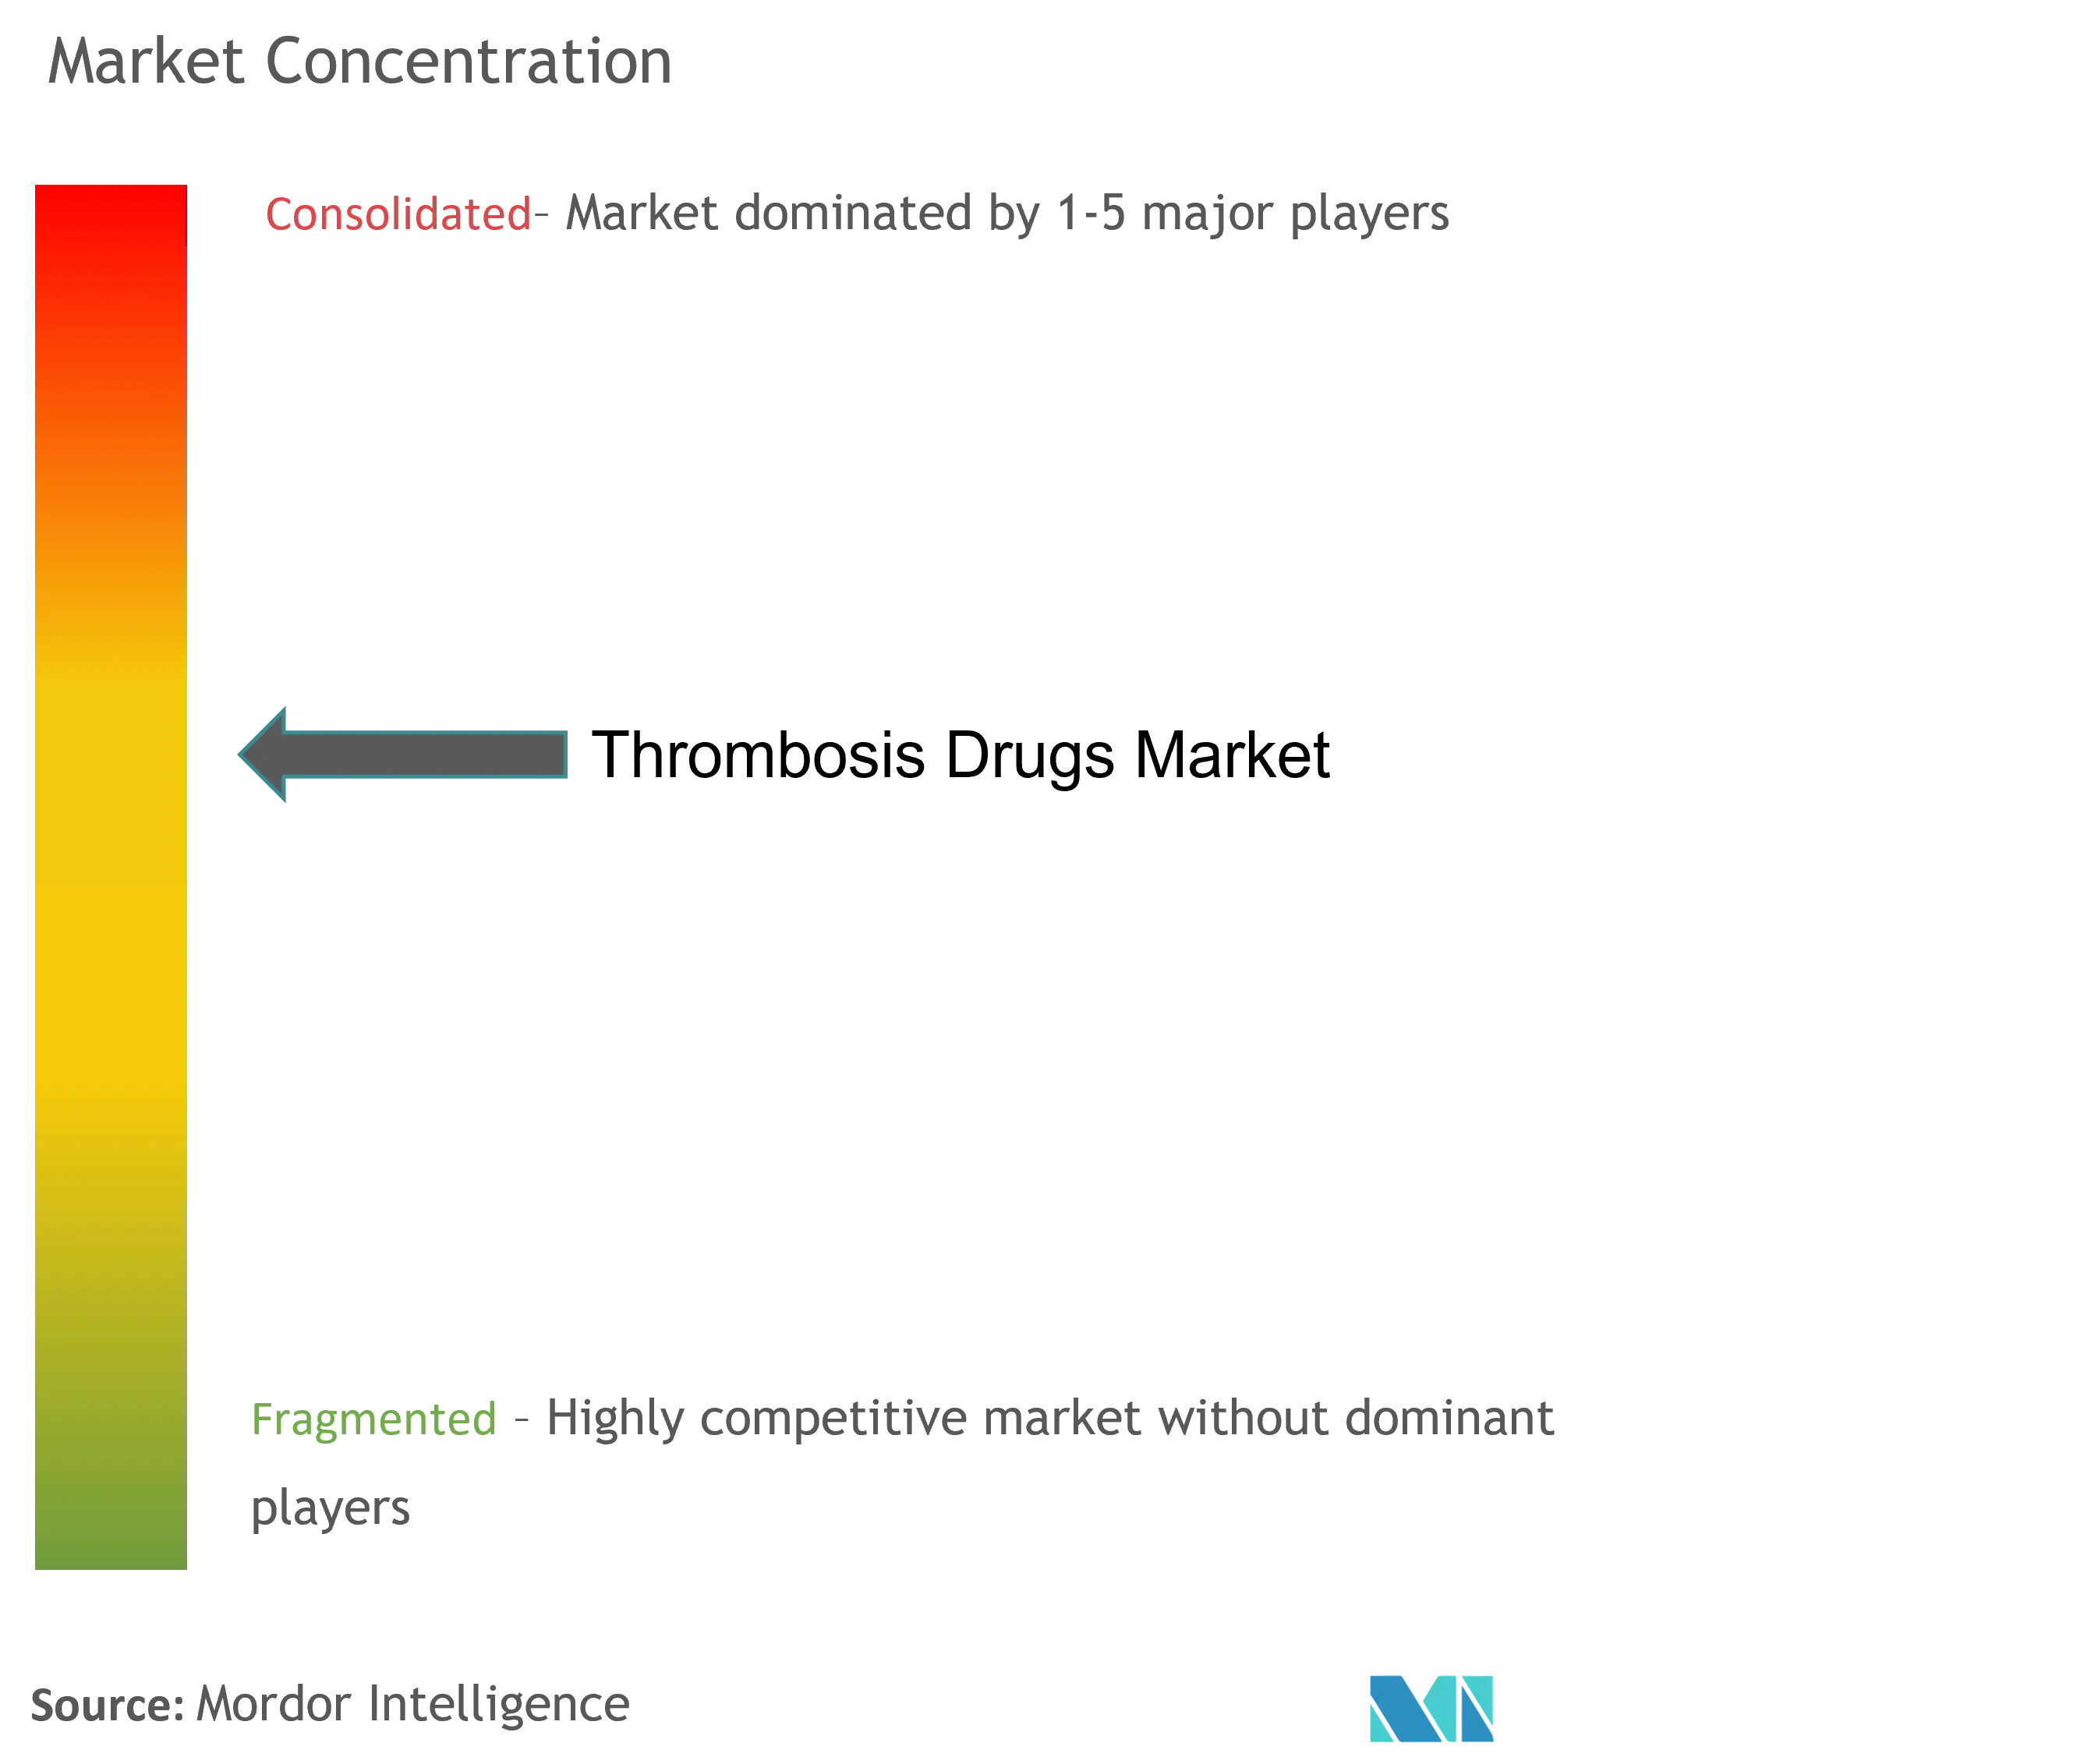
| Market Concentration | Medium |
Major Players *Disclaimer: Major Players sorted in no particular order Image © Mordor Intelligence. Reuse requires attribution under CC BY 4.0. | |
Thrombosis Drugs Market Analysis by Mordor Intelligence
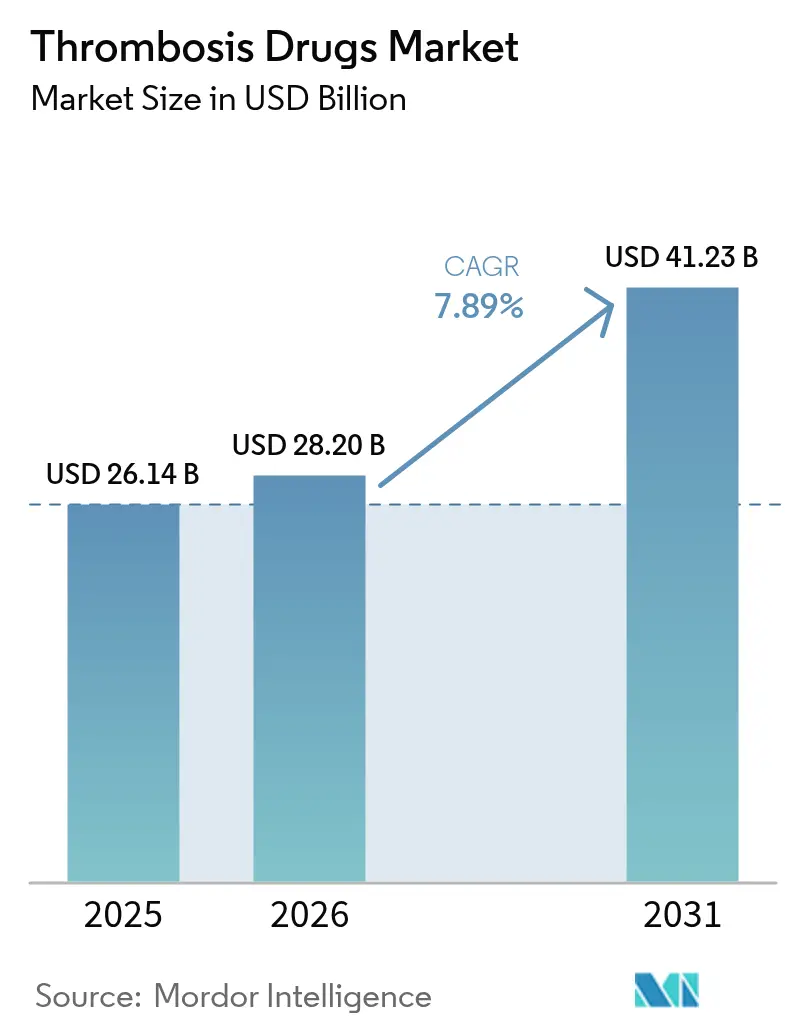
The thrombosis drugs market size was valued at USD 26.14 billion in 2025 and estimated to grow from USD 28.2 billion in 2026 to reach USD 41.23 billion by 2031, at a CAGR of 7.89% during the forecast period (2026-2031). Expanded life expectancy, rising venous thrombo-embolism (VTE) incidence, and accelerated adoption of direct oral anticoagulants (DOACs) are underpinning steady demand. Regulatory green lights for first-in-class Factor XI inhibitors, together with artificial-intelligence risk stratification tools, are recasting therapy selection beyond warfarin and heparin. Hospitals continue to favor rapid-onset injectables for acute care even as outpatient use of once-daily oral DOACs becomes the routine standard. Competitive responses to approaching patent cliffs include consolidation around safer mechanisms of action and discount programs aimed at sustaining loyalty during the shift from brands to generics.
Key Report Takeaways
- By drug class, DOACs captured 54.62% of thrombosis drugs market share in 2025, while Factor XI inhibitors are projected to expand at an 8.24% CAGR through 2031.
- By disease type, deep-vein thrombosis led with 31.22% share of the thrombosis drugs market size in 2025; pulmonary embolism is set to grow at an 8.12% CAGR by 2031.
- By route of administration, oral products commanded 66.55% of the thrombosis drugs market size in 2025, whereas injectables are forecast to grow at 7.98% CAGR through 2031.
- By geography, North America held 37.86% of thrombosis drugs market share in 2025; Asia-Pacific is the fastest-growing region at 7.97% CAGR to 2031.
Note: Market size and forecast figures in this report are generated using Mordor Intelligence’s proprietary estimation framework, updated with the latest available data and insights as of 2026.
Market Trends and Insights
Drivers Impact Analysis of Thrombosis Drugs Market*
| Driver | (~) % Impact on CAGR Forecast | Geographic Relevance | Impact Timeline |
|---|---|---|---|
| Rising venous thrombo-embolism (VTE) prevalence | +2.1% | Global, with concentration in aging populations of North America & Europe | Long term (≥ 4 years) |
| Rapid adoption of direct oral anticoagulants (DOACs) | +1.8% | North America & Europe leading, Asia-Pacific following | Medium term (2-4 years) |
| Growing surgical volumes & peri-operative prophylaxis need | +1.4% | Global, driven by Asia-Pacific healthcare expansion | Medium term (2-4 years) |
| Pipeline of Factor XI inhibitors promising lower bleed risk | +1.2% | North America & Europe early adoption, global expansion | Long term (≥ 4 years) |
| COVID-triggered protocols for inpatient thromboprophylaxis | +0.8% | Global, with persistent impact in hospital systems | Short term (≤ 2 years) |
| Expansion of AI-based risk stratification enabling targeted therapy | +0.6% | North America & Europe leading, selective Asia-Pacific adoption | Long term (≥ 4 years) |
| Source: Mordor Intelligence | |||
Rising VTE prevalence
Higher life expectancy and a surge in cancer survival elevate VTE incidence, making long-term anticoagulation an essential component of chronic disease care. Lung-cancer patients face pulmonary-embolism rates roughly six times the population baseline, creating durable demand for safer oral agents[1]. Hospitals respond by embedding thrombosis protocols within oncology pathways, shifting anticoagulation from episodic to continuous management.
Rapid adoption of DOACs
Evidence from ROCKET-AF and ARISTOTLE continues to drive prescriber confidence in rivaroxaban and apixaban. Bristol Myers Squibb and Pfizer recorded USD 3.2 billion in Eliquis sales in Q4 2024. Upcoming Medicare-negotiated prices effective January 2026 lower patient out-of-pocket costs, broadening eligibility without compromising margins.
Growing surgical volumes & peri-operative prophylaxis
Elective and trauma surgeries are rising fastest in Asia-Pacific, where low-molecular-weight heparins (LMWHs) cut hospital stays from 3.3 to 2.4 days in atrial-fibrillation cases. Outpatient same-day procedures heighten the need for predictable injectables that bridge surgery with outpatient prophylaxis.
Expanding pipeline of Factor XI inhibitors
Abelacimab reduced major or clinically relevant bleeding by 67% versus rivaroxaban in Phase II studies[2]. Novartis secured the candidate through a USD 925 million acquisition that underscores industry intent to leapfrog DOAC safety limits.
Restraints Impact Analysis of Thrombosis Drugs Market*
| Restraint | (~) % Impact on CAGR Forecast | Geographic Relevance | Impact Timeline |
|---|---|---|---|
| High cost of novel anticoagulants | -1.5% | Global, with acute impact in price-sensitive emerging markets | Medium term (2-4 years) |
| Patent expiries & generic erosion | -1.2% | North America & Europe primarily, spreading to global markets | Short term (≤ 2 years) |
| Safety concerns – major bleeding & limited reversal agents | -0.9% | Global, with regulatory focus in developed markets | Long term (≥ 4 years) |
| Source: Mordor Intelligence | |||
High cost of novel anticoagulants
List prices often dwarf those of warfarin, curbing uptake in price-sensitive regions. Bristol Myers Squibb and Pfizer now sell Eliquis direct to patients at 40% discount, dropping monthly costs to USD 346. Policy shifts such as Medicare negotiations suggest broader price pressure is imminent.
Patent expiries & generic erosion
FDA approval of generic rivaroxaban in March 2025 precipitated a 31% drop in Bayer’s Xarelto sales during Q1 2025. Similar erosion looms for Eliquis in 2028, forcing innovators to migrate portfolios toward next-generation assets.
*Our forecasts treat driver/restraint impacts as directional, not additive. The impact forecasts reflect baseline growth, mix effects, and variable interactions.
Thrombosis Drugs Market Segment Analysis
By Drug Class:
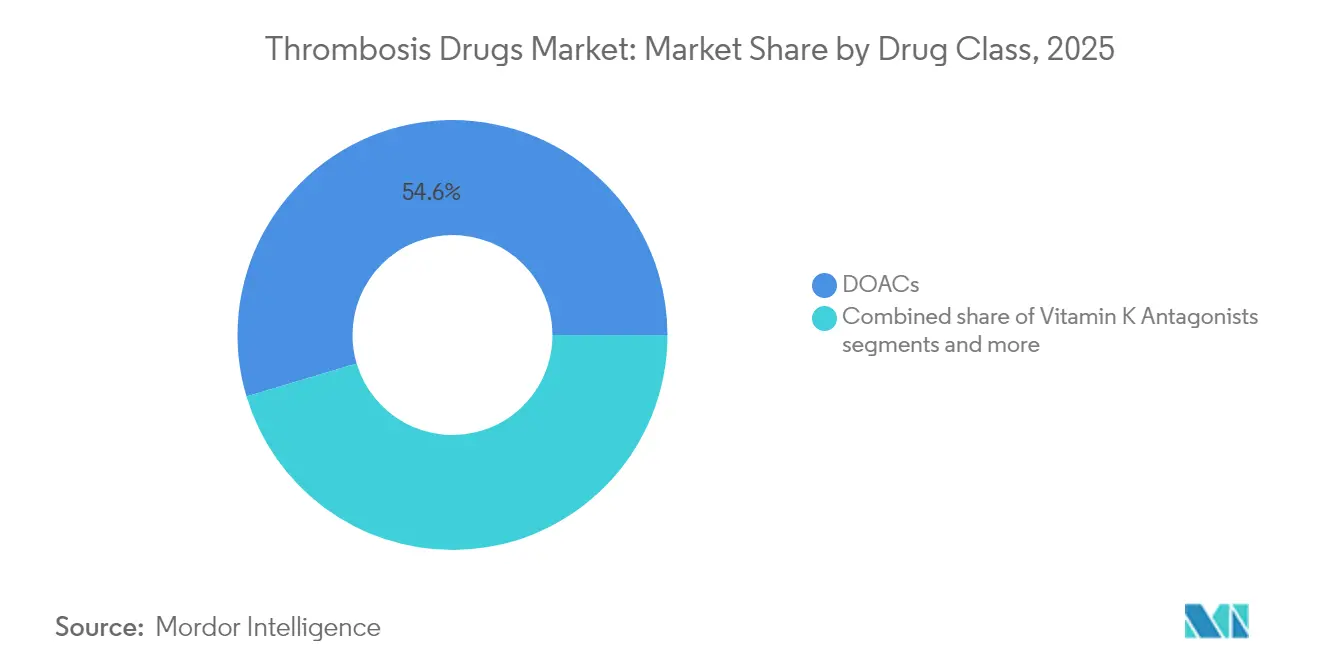
DOAC dominance alongside Factor XI momentumDOACs yielded 54.62% thrombosis drugs market share in 2025 and represent a USD 14.28 billion slice of the thrombosis drugs market size, expanding on the back of simplified dosing and fewer monitoring demands. Factor XI inhibitors are forecast to climb at an 8.24% CAGR, converting bleeding-averse clinicians and patients.
Heparin and LMWHs sustain relevance for in-patient bridging and oncology protocols. Vitamin K antagonists retreat to resource-limited settings, while thrombolytics retain niche roles in stroke and massive pulmonary-embolism emergencies. The arrival of once-monthly subcutaneous Factor XI agents could blur traditional oral-versus-injectable boundaries, recasting competitive alignment within the thrombosis drugs market.

By Disease Type:
DVT leadership against rapid PE growthDeep-vein thrombosis accounted for 31.22% of thrombosis drugs market size in 2025, driven by guideline-mandated anticoagulation post-orthopedic surgery. Pulmonary embolism is set to expand fastest at 8.12% CAGR, fueled by improved CT angiography diagnostics.
Adoption of Pulmonary Embolism Response Teams (PERTs) standardizes rapid treatment, while cancer-associated thrombosis gains visibility as survival rates rise. Stroke prevention in atrial-fibrillation patients remains a high-value application, especially with Factor XI safety data promising broader eligibility.
By Route of Administration:
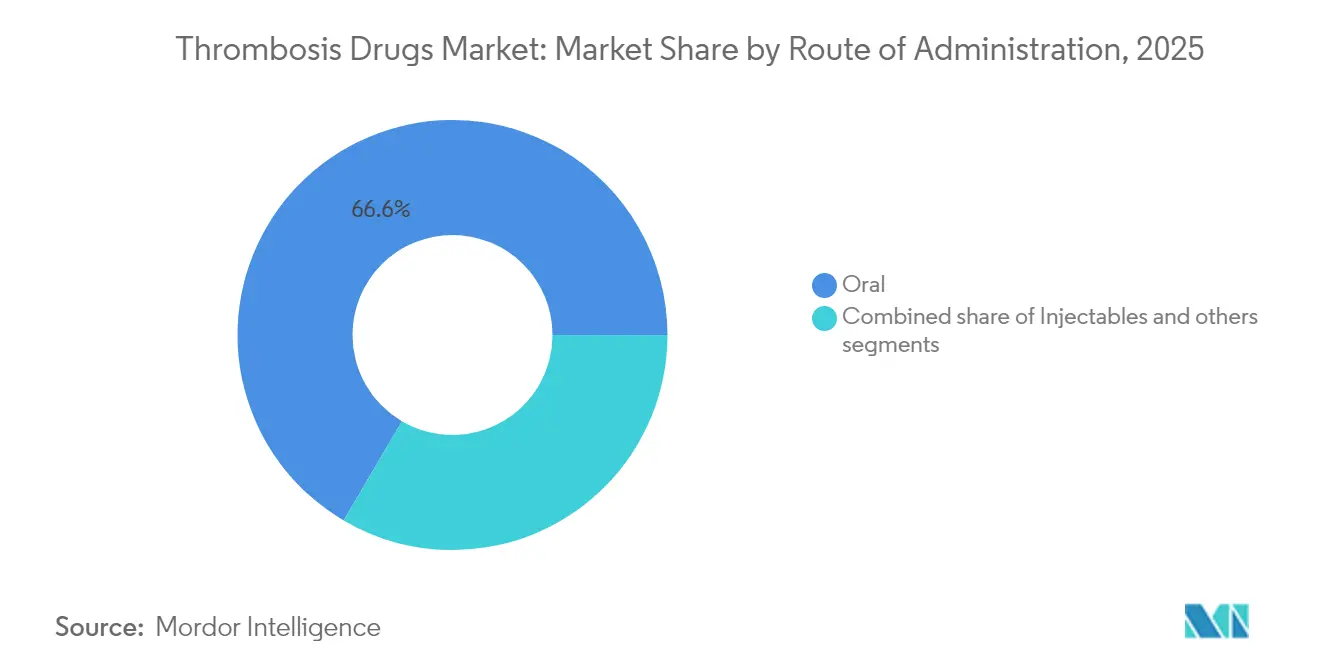
Oral prevalence with injectable resurgenceOral therapies represented 66.55% of thrombosis drugs market size in 2025. Long-acting once-daily formulations reinforce adherence, particularly in outpatient atrial-fibrillation management.
Hospitals rely on LMWHs and unfractionated heparin for immediate onset and quick reversal. Pipeline assets such as weekly subcutaneous Factor XI inhibitors may offer an oral-free alternative that merges convenience with rapid titration, giving injectables renewed prominence within the thrombosis drugs market.
By Distribution Channel:
Hospital lead amid digital expansionHospital pharmacies generated 46.15% of value in 2025, tied to acute care initiation. Retail outlets support chronic management, yet online pharmacies are advancing at 7.84% CAGR as telehealth normalizes digital prescriptions.
Direct-to-consumer discount programs bypass traditional benefit managers, and specialty pharmacies integrate adherence apps that transmit dosing data to clinicians. Such hybrid models are reshaping last-mile delivery economics in the thrombosis drugs market.
Geography Analysis
North America Thrombosis Drugs Market
North America’s reimbursement systems and early DOAC adoption anchored 37.86% thrombosis drugs market share in 2025. Federal price negotiations aim to balance affordability with innovation, potentially widening drug access without hampering R&D investments.
Europe Thrombosis Drugs Market
Europe maintains harmonized clinical guidelines that speed incorporation of breakthrough agents; the region shows consistent mid-single-digit growth supported by aging demographics.
APAC, LATAM and MEA Thrombosis Drugs Market
Asia-Pacific, projected at 7.97% CAGR, benefits from infrastructure upgrades and higher elective-surgery volumes. China’s tiered hospital reform and India’s Ayushman Bharat scheme expand insured cohorts, while Japan’s super-aged society sustains high per-capita anticoagulant use. Latin America and the Middle East & Africa trail but show rising awareness campaigns and imported generics that lower entry barriers, gradually enlarging their footprint in the thrombosis drugs market.

Regulatory Landscape
Regulatory oversight for thrombosis drugs focuses on bioequivalence and pharmacovigilance for established anticoagulants, while increasing attention on bleeding and thromboembolic risk management for novel mechanisms, including reversal strategies. In the European Union, the revised HMA/EMA variations framework became applicable on 15 January 2026, shaping how marketing authorization holders implement post-approval changes for anticoagulants and related products.
Generic access continues to expand through EU-wide and national competent authority actions. The EMA granted EU-wide marketing authorization for rivaroxaban Koanaa on 21 November 2025, and Ireland’s HPRA issued national marketing authorizations for generic rivaroxaban products, including a 29 August 2025 authorization and an earlier 26 January 2024 authorization. This continues to reinforce price-competition pathways for high-volume indications such as VTE and atrial fibrillation. In the United States, FDA engagement with novel antithrombotic approaches also remains active, illustrated by Cadrenal Therapeutics completing an End-of-Phase 2 meeting in April 2026 for CAD-1005 in heparin-induced thrombocytopenia, which sets a pivotal Phase 3 registration path.
Value Chain Analysis
The thrombosis drugs value chain runs from key starting materials (KSMs) and intermediates through API production and finished-dose manufacturing, then to distribution via hospital pharmacies, retail pharmacies, and growing online channels. Supply security remains a focal constraint for anticoagulant portfolios because upstream dependencies can be difficult to substitute: in April 2026, U.S. Pharmacopeia highlighted 100 medications at risk of supply gaps due to KSM sourcing bottlenecks, and reported that 48% had at least one KSM manufactured in only one country. This strengthens the case for dual sourcing, qualified alternates, and inventory strategies for both oral anticoagulants and critical injectables used in acute care.
Innovation-led nodes (R&D, clinical manufacturing, and regulatory submission operations) are increasingly central to competitive positioning as companies diversify beyond mature DOACs toward next-generation targets such as Factor XIa. Bayer’s asundexian program is an example of how late-stage evidence generation and regulatory acceleration connect upstream development to downstream commercialization planning: global Phase III OCEANIC-STROKE results were published in April 2026, and the FDA granted Priority Review in May 2026 for secondary stroke prevention. These milestones elevate the importance of scalable clinical and commercial supply, robust quality systems, and specialty distribution capabilities tied to neurologic and cardiovascular prescriber channels.
Competitive Landscape
Intellectual-property expiries are tilting power toward pipelines rather than current brands. Bristol Myers Squibb–Pfizer’s Eliquis alliance exemplifies a scale-economies approach, yet its 2028 exclusivity sunset drives the partners to explore next-wave targets. Bayer pivots toward cardiometabolic diversification after seeing Xarelto revenues slide on generic pressure.
Novartis’ acquisition of Anthos Therapeutics positions abelacimab as a flagship entrant into the Factor XI space, while Johnson & Johnson advances milvexian to Phase III in multiple indications. The field witnesses a rising prevalence of strategic collaborations pairing molecule innovation with digital risk-stratification platforms to deepen clinical stickiness.
Generic manufacturers Lupin and Taro capitalize on newly granted approvals, enabling payers to swap to lower-cost options rapidly. Market contenders therefore race to offer differentiated bleeding profiles or bundled care ecosystems, reaffirming that future competitiveness hinges on holistic thrombosis-management solutions rather than drug efficacy alone.
Thrombosis Drugs Industry Leaders
-
Boehringer Ingelheim GmbH
-
Johnson & Johnson
-
Sanofi SA
-
Pfizer Inc.
-
Laurus Lab (Aspen Pharmacare Holdings Limited)
- *Disclaimer: Major Players sorted in no particular order
Thrombosis Drugs Market Companies Covered in this Report
- Bristol-Myers Squibb
- Pfizer
- Bayer
- Johnson & Johnson
- Boehringer Ingelheim
- Daiichi Sankyo
- Sanofi
- Aspen Pharmacare
- Leo Pharma
- CSL Behring
- Grifols
- Roche
- Fresenius
- Viatris
- Cipla
- NATCO Pharma
- Glenmark Pharmaceuticals
- Alkem Laboratories
- Dr. Reddy’s Laboratories
- Hikma Pharmaceuticals
Market Opportunities and Future Outlook
Near-term whitespace is forming where affordability and differentiated safety intersect, as generic entry broadens access while innovators refocus on mechanisms designed to reduce bleeding risk. The FDA approval of generic rivaroxaban, including Lupin’s 2025 approval and broader US generic availability, intensifies payer-driven switching and pushes branded portfolios toward value propositions beyond price, including adherence support and care models that align with outpatient DOAC-dominant use (oral therapies held 66.55% of market value in 2025). Alongside formulary dynamics, direct-to-patient discount approaches such as the Eliquis cash-pay program at a 40% discount show another commercialization route that can fit alongside benefit designs and support persistence as competition rises.
Clinical and regulatory emphasis on safety and reversal also creates opportunity for therapies and services that tighten risk management in high-acuity settings. AstraZeneca’s withdrawal of Andexxa from the US market in December 2025 following FDA safety concerns underscores continuing gaps in DOAC reversal confidence for certain use cases, which raises the value of hospital protocols, monitoring, and alternative bleeding-management approaches. Next-generation Factor XI programs (milvexian, abelacimab, and asundexian) are being tested in large Phase 3 pathways, with reported enrollment targets exceeding 15,000 patients in major milvexian trials. This keeps development and evidence-generation activity active, while creating a clearer path for differentiated bleeding profiles, peri-procedural management, and integration with AI-based risk stratification tools to influence treatment selection and eligibility.
Recent Industry Developments in Thrombosis Drugs Market
- May 2026: Bayer reported that the US FDA granted Priority Review for asundexian for secondary stroke prevention. The designation accelerates the regulatory timeline for a next-generation oral Factor XIa approach and increases competitive pressure on established anticoagulant classes as companies pursue safety differentiation beyond current DOACs.
- December 2025: AstraZeneca withdrew Andexxa from the US market following FDA safety concerns tied to thrombotic risk findings. The action increased attention on anticoagulant safety management and highlighted remaining unmet needs around reversal strategies and hospital protocols for DOAC-treated patients.
- February 2024: Bayer initiated a Phase II study (SIRIUS) evaluating a first-in-class anti-alpha2 antiplasmin antibody program. Expanding R&D into adjacent thrombotic and fibrinolytic pathways supports diversification beyond conventional anticoagulants and adds competitive optionality for specific high-risk clinical settings.
Thrombosis Drugs Market Report Scope and Research Methodology
Market Definition and Coverage
This market is defined as the global revenue from prescription drugs used to prevent, manage, or dissolve blood clots across acute and long term thrombosis care, counted at manufacturer level sales in USD.
Scope exclusions: Devices and procedures used to manage thrombosis (such as stents, filters, and thrombectomy services) and non-drug diagnostics are excluded from this sizing.
Segments Covered in This Report
- By Drug Class (Value)
- Direct Oral Anticoagulants (DOACs)
- Heparin & Low-Molecular-Weight Heparin
- Vitamin K Antagonists
- Thrombolytics / Fibrinolytics
- P2Y12 Platelet Inhibitors
- Factor XI / XII Inhibitors (emerging)
- Others
- By Disease Type (Value)
- Deep Vein Thrombosis
- Pulmonary Embolism
- Atrial Fibrillation
- Peripheral Arterial Disease
- Stroke & Transient Ischemic Attack
- Others
- By Route of Administration (Value)
- Oral
- Injectable
- Topical
- By Distribution Channel (Value)
- Hospital Pharmacies
- Retail Pharmacies
- Online Pharmacies
- Mail-Order Pharmacies
- By Geography (Value)
- North America
- United States
- Canada
- Mexico
- Europe
- Germany
- United Kingdom
- France
- Italy
- Spain
- Rest of Europe
- Asia-Pacific
- China
- India
- Japan
- South Korea
- Australia
- Rest of Asia-Pacific
- South America
- Brazil
- Argentina
- Rest of South America
- Middle East and Africa
- GCC
- South Africa
- Rest of Middle East and Africa
- North America
Data Sources, Market Sizing, and Validation
Desk Research
Desk work starts with building the disease and treatment context so the later sizing steps stay grounded. We used public health and statistics sources such as the World Health Organization, the US CDC, and OECD health data to understand cardiovascular and venous thromboembolism burden patterns, along with regulatory and label signals from agencies such as the US FDA and the European Medicines Agency.
To convert clinical context into market inputs, we also reviewed sources such as ClinicalTrials.gov for pipeline direction (for example, Factor XI or XII activity), and peer reviewed journals for standard of care shifts like DOAC adoption in atrial fibrillation and VTE. Additional checks were made using company annual reports, investor presentations, association websites, and reputed press for launch timing, loss of exclusivity windows, and regional access trends. Where needed, a paid subscription for company financials and a patent database were used for cross checks on revenues and exclusivity timelines. These sources are illustrative, and many other public references were also used to collect, validate, and clarify data points.
Primary Interviews and Surveys
Primary work was used to pressure test assumptions that are not cleanly visible in public datasets, especially treatment mix by indication and the pace of switching across oral and injectable therapies. We spoke with a mix of drug manufacturers, distributors, hospital pharmacy stakeholders, and clinicians across major regions so that demand signals, pricing direction, and access constraints could be confirmed and then applied consistently in the model.
Distribution of primary research fieldwork respondents
| Company type | Respondent position | Region |
|---|---|---|
| Top tier: 35% | CXOs: 17% | APAC: 46% |
| Mid tier: 43% | Functional/Unit leaders: 38% | EMEA: 33% |
| Smaller Players: 22% | Managers: 45% | Americas: 21% |
Market-Sizing & Forecasting
Sizing is anchored on a top-down demand pool build that follows the patient flow for major thrombosis linked conditions and then applies treated share, therapy choice, and annual cost patterns to reach revenue. Because utilization differs between acute events and chronic prevention, inputs are adjusted by indication level use cases that are visible in clinical practice (for example, deep vein thrombosis, pulmonary embolism, and atrial fibrillation).
Key inputs used in the model include prevalence and incidence direction for VTE and atrial fibrillation, anticoagulant versus antiplatelet mix, share shifts toward DOACs, route split between oral and injectable therapies, and average selling price movement after loss of exclusivity and generic entry. Where public data is thin, selective bottom-up checks are used, such as sampled price bands by region, limited supplier revenue disclosures, and channel checks with hospital and retail pharmacy stakeholders, which then help us adjust totals that look overstated or understated.
For forecasting, scenario analysis is applied with a core case guided by expert views on uptake curves for newer mechanisms (including emerging Factor XI or XII inhibitors), policy and reimbursement direction, and the expected timing of launches and patent expiries. When gaps remain for small countries or niche sub classes, proxying is done using similar markets with comparable access and treatment guidelines, before the totals are reconciled back to regional healthcare spend signals.
Data Validation & Update Cycle
Outputs are checked against independent signals, including therapy class growth patterns, regional prescription and access narratives from interviews, and whether implied pricing looks reasonable versus known list price and generic erosion behavior. Outliers are investigated by going back to the underlying drivers, and if needed we re-contact select respondents to confirm whether a shift is real or caused by a wrong assumption.
Before sign-off, the model and key assumptions go through multiple analyst reviews so that arithmetic, definitions, and year alignment stay consistent. The study is refreshed annually, and interim updates are made when material events occur (such as major approvals, safety changes, or high impact loss of exclusivity). Just before delivery, a final pass is completed so clients receive the most current view possible.
Mordor Intelligence's Thrombosis Drugs Market Size Compared Against Other Published Estimates
Published market values for thrombosis drugs often do not match because the market can be defined in more than one workable way, and each publisher also makes different choices on base year, class coverage, and how pricing changes are handled. Differences also show up when one estimate leans on broad cardiovascular drug spending, while another leans on narrower VTE and atrial fibrillation treatment pools.
The biggest gap drivers are usually whether antiplatelet revenue is counted alongside anticoagulants, how emerging classes (like Factor XI or XII inhibitors) are treated before meaningful sales begin, and what is assumed for post patent price erosion across oral and injectable products. Another common issue is year alignment and currency timing, since a 2024 base can look smaller or larger than a 2025 or 2026 base depending on the conversion window and how inflationary price moves are treated.
Benchmark comparison
| Source | Market Size | Gaps in Research Methodology |
|---|---|---|
| Mordor Intelligence | USD 28.2 B (2026) | |
| Global Consultancy A | USD 26.11 B (2024) | Uses an earlier base year and appears to center the sizing around a narrower class set and core indications, which can undercount hospital acute use and later stage class expansion when compared year-to-year. |
| Industry Publisher B | USD 48.15 B (2024) | Shows a much larger 2024 total, which likely comes from a broader therapeutic inclusion (for example, wider cardiovascular thrombotic therapies and age-group overlays) and a pricing approach that smooths generic erosion differently. |
The spread in the table mainly reflects base year choice and how far the scope is stretched beyond core thrombosis treatment into adjacent therapies, plus how price erosion and mix shift are applied. By keeping the count tied to treated thrombosis demand, class level uptake, and post exclusivity price steps that can be rechecked, the estimate stays more reproducible, a discipline applied by Mordor Intelligence.
Key Questions Answered in the Report
What is the current size of the thrombosis drugs market?
The thrombosis drugs market size is USD 28.2 billion in 2026.
Which drug class leads the thrombosis drugs market?
Direct oral anticoagulants hold 54.62% market share, making them the leading class.
How fast will Factor XI inhibitors grow?
Factor XI inhibitors are forecast to post an 8.24% CAGR between 2026 and 2031.
Why is pulmonary embolism the fastest-growing disease segment?
Improved CT angiography diagnostics and widespread thromboprophylaxis protocols are accelerating treatment volumes.