
Market Overview
| Study Period | 2020 - 2031 |
|---|---|
| Market Size (2026) | USD 23.25 Billion |
| Market Size (2031) | USD 28.38 Billion |
| Growth Rate (2026 - 2031) | 4.07 % |
| Fastest Growing Market | Asia Pacific |
| Largest Market | Asia Pacific |
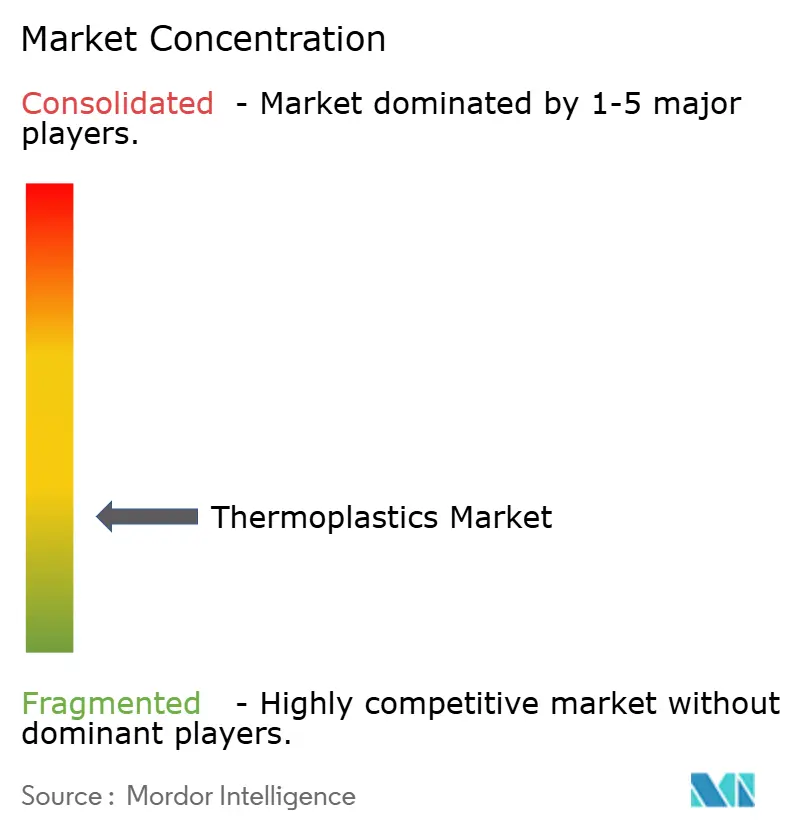
| Market Concentration | Low |
Major Players *Disclaimer: Major Players sorted in no particular order Image © Mordor Intelligence. Reuse requires attribution under CC BY 4.0. | |
Thermoplastics Market Analysis by Mordor Intelligence
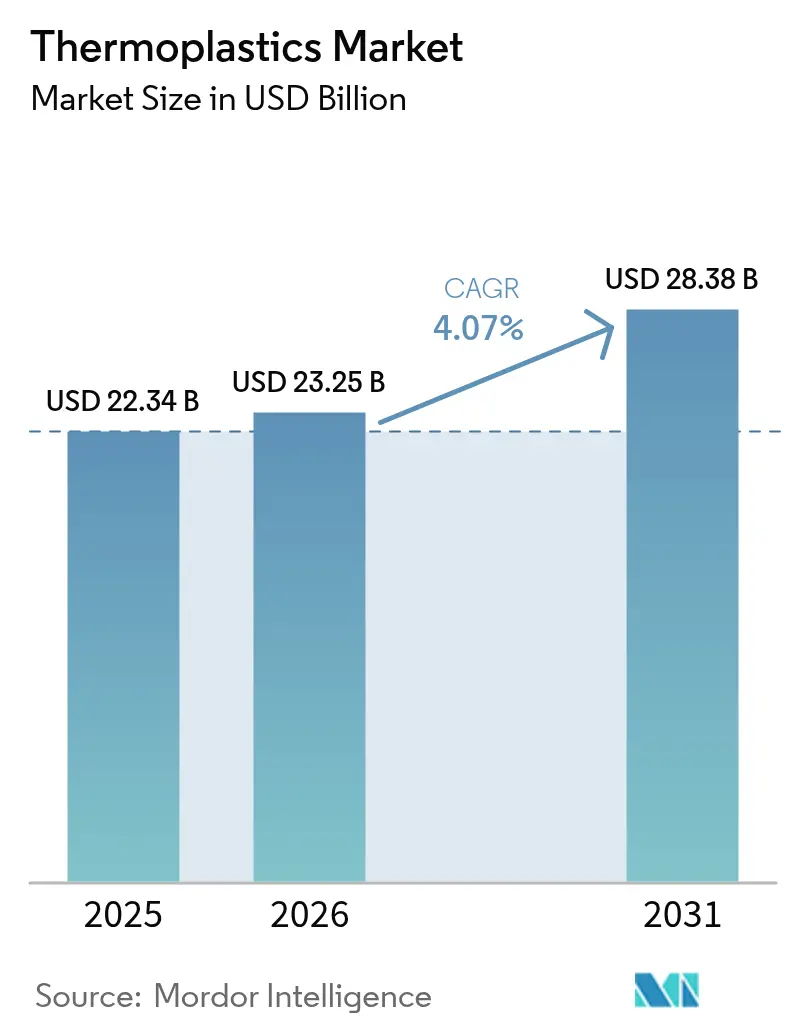
The Thermoplastics Market size is expected to grow from USD 22.34 billion in 2025 to USD 23.25 billion in 2026 and is forecast to reach USD 28.38 billion by 2031 at 4.07% CAGR over 2026-2031. This measured expansion stems from the steady migration of buyers toward engineering and high-performance grades that command margin premiums, even as polyolefin producers navigate volatile crude-linked feedstocks and tighter Extended Producer Responsibility fees. Rising medical-device approvals, accelerating electric-vehicle production, and sustained e-commerce packaging volumes underpin demand, while integrated petrochemical hubs in Asia and the Middle East shorten supply chains and compress working-capital cycles. Ongoing investments in chemical recycling infrastructure, coupled with regulatory pushes for recycled content, create new revenue streams for resin suppliers able to certify circular feedstocks. Competitive intensity remains steeper on commodity lines, where underutilized capacity and quarterly price resets keep margins thin; specialty players counter with application development services and patent portfolios that raise customer switching costs.
Key Report Takeaways
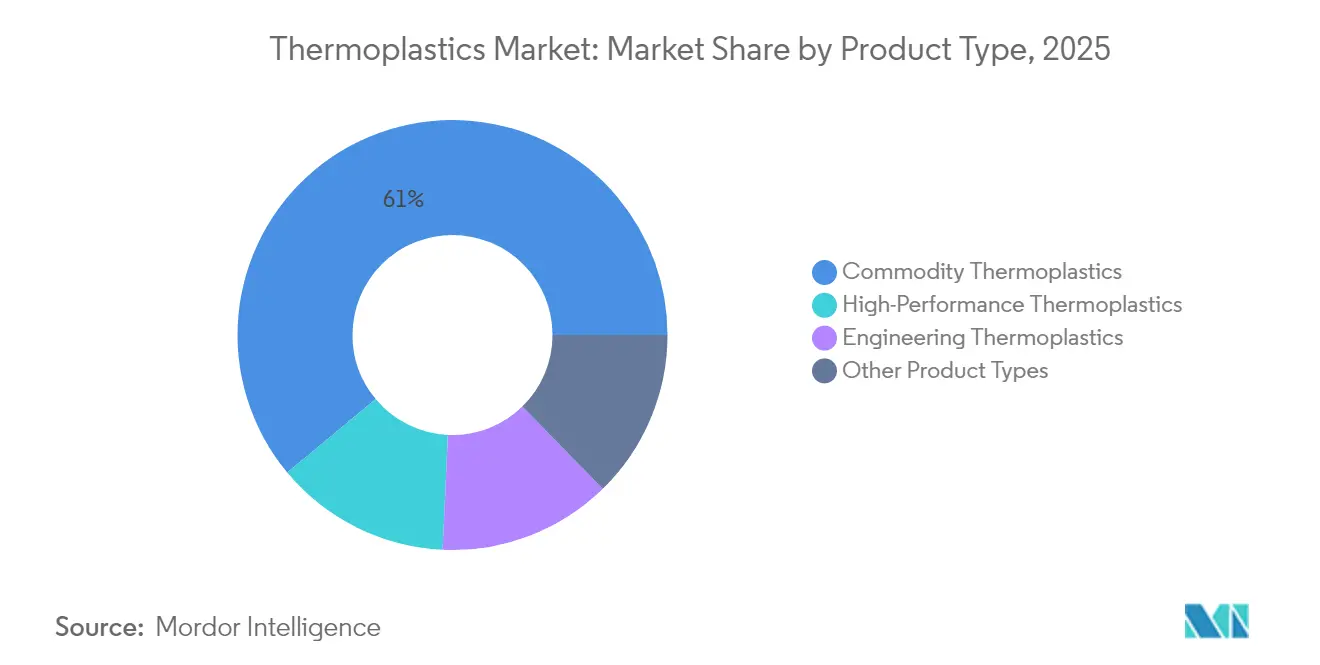
- By product type, commodity grades held 61.05% of the thermoplastics market share in 2025. High-performance polymers are projected to post the fastest growth, advancing at a 6.05% CAGR through 2031.
- By end-user industry, packaging led the demand, accounting for a 34.10% revenue share in 2025. Medical applications are forecasted to lead the field at a 5.88% CAGR through 2031.
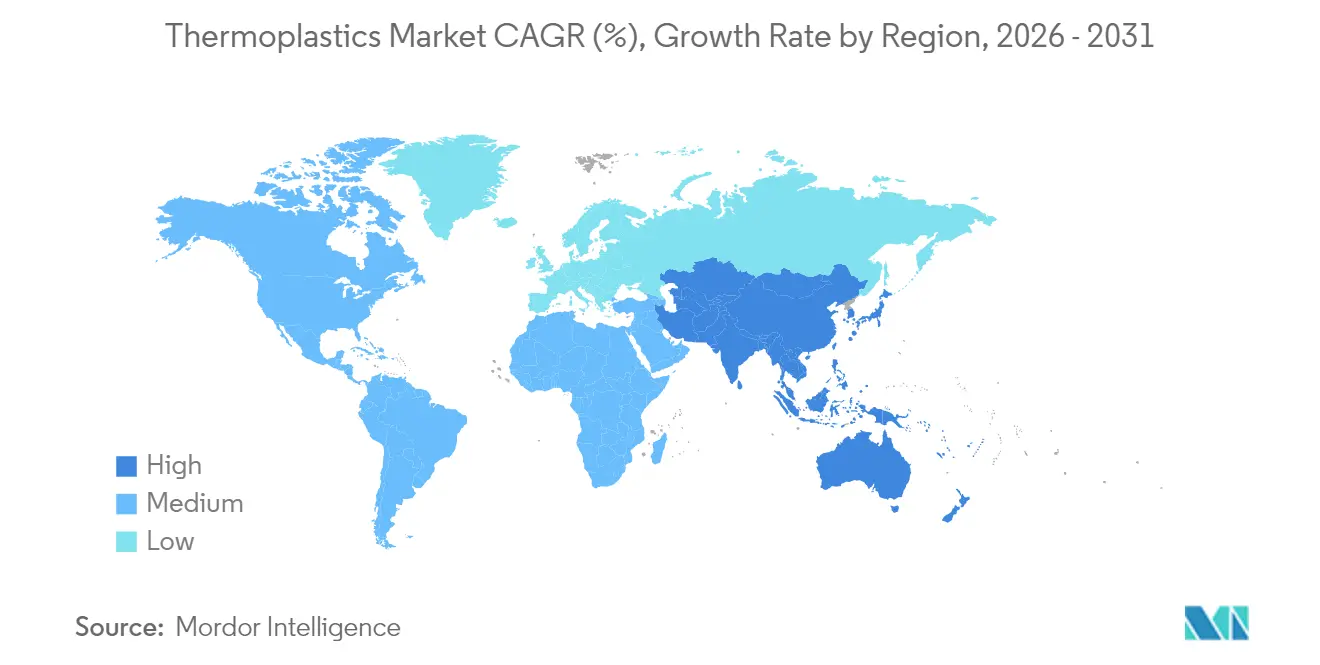
- Asia-Pacific dominated with a 50.76% share of global consumption in 2025. The Asia-Pacific region is also the fastest-growing, expected to expand at a 5.12% CAGR through 2031.
Note: Market size and forecast figures in this report are generated using Mordor Intelligence’s proprietary estimation framework, updated with the latest available data and insights as of 2026.
Market Trends and Insights
Drivers Impact Analysis of Thermoplastics Market*
| Drivers | (~) % Impact on CAGR Forecast | Geographic Relevance | Impact Timeline |
|---|---|---|---|
| Capacity additions in downstream processing hubs | +0.8% | Asia-Pacific core, spillover to Middle East | Medium term (2-4 years) |
| Accelerating e-commerce and fresh-food delivery packaging demand | +1.1% | Global, with highest intensity in North America and Asia-Pacific | Short term (≤ 2 years) |
| Automotive lightweighting and EV adoption surge | +0.9% | Europe and China, emerging in North America | Medium term (2-4 years) |
| Rapid industrial expansion in Asia-Pacific construction value chains | +0.7% | Asia-Pacific, concentrated in China, India, ASEAN | Medium term (2-4 years) |
| Scale-up of advanced chemical-recycling feedstock supply | +0.6% | Europe and North America, pilot-scale in Asia | Long term (≥ 4 years) |
| Source: Mordor Intelligence | |||
Capacity Additions in Downstream Processing Hubs
Integrated complexes in Gujarat, Jubail, and the U.S. Gulf Coast now co-locate cracking, polymerization, and compounding within a 10-kilometer radius, trimming logistics costs and enabling just-in-time resin delivery. Reliance Industries’ Jamnagar site produces polyethylene and polypropylene alongside masterbatch lines, a setup that cuts working capital. Co-sited operations also shield processors from port congestion and container shortages that inflated freight rates in 2024. Nevertheless, in Zhejiang, polypropylene plants are running at near capacity. This comes as domestic auto production levels off, underscoring that new supply additions are surpassing China's internal demand. Consequently, long-term offtake contracts are becoming the preferred risk hedge for both resin makers and converters.
Accelerating E-Commerce and Fresh-Food Delivery Packaging Demand
Online grocery penetration has increased in North America and urban China during 2024, spurring demand for multi-layer polyethylene films with water-vapor transmission rates below 2 g/m²-day. Dow’s ELITE enhanced polyethylene enables downgauging films while meeting Amazon drop-test standards, thereby reducing material usage[1]. Meal-kit providers, meanwhile, specify microwave-safe polypropylene trays certified to ISO 22000, a niche that has expanded. Divergent recycled-content mandates—California’s by 2032 versus the European Union’s by 2030—are prompting converters to secure certified post-consumer resin streams that command premiums over virgin grades. Smaller firms unable to secure such a supply are merging or exiting.
Automotive Lightweighting and EV Adoption Surge
Battery-electric vehicle production continues to grow, and each platform substitutes significant amounts of metal with glass-fiber-reinforced polyamide 6 and polycarbonate glazing. BASF’s Ultramid Advanced N polyamide, reinforced to a high modulus, enables battery enclosures that meet FMVSS 305 crash standards while trimming part weight. Covestro’s Makrolon Rx4 polycarbonate maintains impact strength at low temperatures for panoramic roofs, catering to colder markets. End-of-life recycling for such composites lags, however, raising regulatory scrutiny as Extended Producer Responsibility fees widen.
Scale-Up of Advanced Chemical-Recycling Feedstock Supply
Pyrolysis and depolymerization plants processed a significant amount of mixed plastic waste into circular feedstock in 2024. Eastman Chemical’s Kingsport unit converts polyester waste into virgin-grade monomers under ISCC PLUS mass-balance certification. LyondellBasell’s MoReTec facility in Germany produces pyrolysis oil, which serves as a substitute for naphtha in steam crackers. Although pyrolysis oil still carries a price premium over fossil naphtha, the European Union’s proposed recycled-content rule for packaging by 2030 is accelerating investment in feedstock-prep infrastructure.
Restraints Impact Analysis of Thermoplastics Market*
| Restraints | (~) % Impact on CAGR Forecast | Geographic Relevance | Impact Timeline |
|---|---|---|---|
| Escalating plastic-waste regulation and bans | -0.7% | Europe and North America, expanding to Asia-Pacific | Short term (≤ 2 years) |
| Crude-linked feedstock price volatility | -0.5% | Global | Short term (≤ 2 years) |
| EU Carbon Border Adjustment cost pass-through | -0.4% | Europe, with indirect impact on Asia-Pacific exporters | Medium term (2-4 years) |
| Source: Mordor Intelligence | |||
Escalating Plastic-Waste Regulation and Bans
Single-use plastic restrictions are now in place in many countries, yet enforcement varies and exemptions are widespread. Canada’s prohibition on polystyrene food-service items removed a significant annual outlet for foam extruders[2]. The European Union’s tethered-cap rule forces injection molders to retool, often at considerable costs per cavity. France and Germany levy Extended Producer Responsibility fees, prompting brand owners to accelerate lightweighting programs that curb absolute resin use. Mid-sized converters with limited capital for mold changes and compliance with legal requirements tend to become acquisition targets for larger peers.
Crude-Linked Feedstock Price Volatility
Naphtha traded within a fluctuating range in 2024, while quarterly polyethylene contracts locked prices for a set duration. Dow recorded an EBITDA impact from this lag during the year. Given that commodity polyethylene margins are typically narrow in stable periods, a spike in feedstock costs can significantly reduce profitability when sales prices remain fixed. Small distributors often lack the financial capacity to carry inventory through such fluctuations, pushing converters to integrate upstream or secure consignment stock.
*Our forecasts treat driver/restraint impacts as directional, not additive. The impact forecasts reflect baseline growth, mix effects, and variable interactions.
Thermoplastics Market Segment Analysis
By Product Type:
High Performance Grades Gain MomentumCommodity resins retained 61.05% of the thermoplastics market in 2025, but high-performance polymers are projected to grow at a 6.05% CAGR, underscoring the premium buyers place on heat resistance and chemical stability. Polyethylene and polypropylene dominate the volume, yet polyvinyl chloride continues to anchor rigid construction items due to its inherent flame retardancy. Polystyrene demand contracted as food service bans expanded. Engineering resins—polyamide, polycarbonate, polyethylene terephthalate, and acrylonitrile-butadiene-styrene—benefit from electric-vehicle underhood components and electronics housings that require service temperatures of up to 120 °C.
Liquid-crystal polymers expand in 5G antenna modules, where a low dielectric constant is crucial for preserving signal integrity above 28 GHz. Supply risk remains in fluoropolymers, where few producers hold a major portion of capacity, a fact highlighted by a force majeure at a major U.S. site earlier in the year.

By End-User Industry:
Medical Applications AcceleratePackaging captured 34.10% of revenue in 2025; however, growth is leveling off as lightweighting and recycled-content mandates mature. Flexible films account for a significant portion of packaging resin, with Dow INNATE grades enabling thinner pouches that meet ASTM dart-drop criteria while reducing material usage. Rigid containers face higher costs due to recycled-content laws, nudging smaller converters toward consolidation.
Medical applications represent the fastest-growing outlet, advancing at a 5.88% CAGR through 2031. Polyether ether ketone is displacing titanium in spinal implants because its modulus more closely matches that of bone, thereby improving imaging outcomes. Polycarbonate and cyclic-olefin copolymers are gaining favor in pre-filled syringes, where clarity and low extractables are crucial. Regulatory pathways remain lengthy, with average FDA 510(k) clearances taking 11 months in 2024, a delay that privileges established resin suppliers holding pre-approved master files.

Geography Analysis
APAC Thermoplastics Market
The Asia-Pacific region commanded 50.76% of global demand in 2025 and is projected to grow at a 5.12% CAGR through 2031, maintaining the thermoplastics market's focus firmly on the region. Integrated value chains in China and India reduce delivered costs and enable rapid capacity rollouts. Reliance’s greenfield line in Gujarat and SABIC’s Tianjin polycarbonate debottlenecking project exemplify the push to locate resin production close to electronics and automotive hubs.
North America Thermoplastics Market
North America maintained a significant share in 2025. Shale-gas economics still give U.S. producers a propane cost advantage; yet, coastal exporters struggle with longer transit times to Asia compared with Middle East suppliers. Canadian automotive plants standardized glass-fiber-reinforced polyamide battery casings, lifting engineering-resin uptake even as single-use bans curbed polystyrene demand. Mexico’s near-shoring trend bolstered polypropylene consumption in border maquiladoras, aided by favorable USMCA rules.
Europe Thermoplastics Market
Europe faces aggressive circular-economy mandates. The Carbon Border Adjustment Mechanism places a shadow carbon cost on imported resins, incentivizing compounding moves to Poland and Romania. The United Kingdom’s plastic-packaging tax drove a double-digit increase in post-consumer resin demand, but it strained supply, widening the price gap with virgin grades.
South America, MEA and APAC Thermoplastics Market
Brazil’s agriculture-driven polyethylene demand gained despite currency headwinds, while Argentina’s economic turmoil kept growth flat. Saudi Arabia’s latest polyethylene expansion has increased regional export capacity, providing buyers with a freight advantage in East Africa and South Asia.
Regulatory Landscape
Thermoplastics producers and converters operate under accelerating packaging-waste, recycled-content, and single-use restrictions that directly affect resin selection, labeling, and end-of-life compliance obligations. In the European Union, Regulation (EU) 2025/40 on packaging and packaging waste (PPWR) entered into force in February 2025, and the European Commission issued implementation guidance in March 2026 (C(2026) 2151 final); the regulation moves the region toward harmonized, enforceable requirements for packaging sustainability, labeling, and recyclability, reducing reliance on disparate national rules.
At the global level, the UN process for a plastics treaty remains a major policy signal but without a settled endpoint; in February 2026, the Intergovernmental Negotiating Committee (INC) elected Julio Cordano (Chile) as chair to steer completion of a global agreement on plastic pollution. With formal negotiations still contested as of mid-2026, compliance planning continues to skew toward regional programs such as EU packaging rules and national single-use measures (e.g., Canada’s restrictions on certain polystyrene food-service items), increasing the need for region-specific product stewardship, documentation, and certified circular feedstocks.
Value Chain Analysis
The thermoplastics value chain starts with hydrocarbon and alternative feedstocks (naphtha, ethane/propane, and coal-to-olefins in China), moves through crackers and monomer units to polymerization (PE, PP, PVC, engineering and high-performance resins), then compounding/additives, conversion (films, injection molding, extrusion), brand-owner specification, and end-of-life collection and recycling (mechanical and chemical routes under mass-balance schemes). Integrated production clusters compress logistics and working capital by co-locating cracking, polymerization, and compounding; a 2026 proof point is BASF's inauguration of its world-scale Verbund site in Zhanjiang, China, anchored by a 1 million ton ethylene steam cracker and downstream engineering plastics and thermoplastic polyurethane lines.
Recent disruptions reinforced the dependence of commodity chains on constrained chokepoints and tight additive supply. Reuters reported in March 2026 that conflict-related disruption around the Strait of Hormuz constrained a large share of polyethylene supply and tightened feedstock availability, while parts of Asia saw naphtha-linked outages (for example, reported stoppages at Rayong Olefins/SCG Chemicals due to feedstock breaks). Downstream, investments are shifting closer to demand and regulatory hotspots, such as Lubrizol's June 2026 USD 150 million CPVC resin facility plan in Vilayat, Gujarat (with Grasim Industries) and new polypropylene capacity construction announced in China, alongside converter efforts to secure certified post-consumer resin streams to meet recycled-content obligations.
Competitive Landscape
The thermoplastics market is fragmented. Patent activity is intensifying. Daikin and Sumitomo filed a combined fluoropolymer patents in 2024, fortifying high-barrier segments where performance specs exceed standard ISO 10993 or UL 94 V-0 ratings. Braskem captured a premium with sugar-cane-based polyethylene certified ISCC PLUS, signalling green-feedstock potential. Additive manufacturing with high-temperature polymers is moving from prototypes to serial production in aerospace and medical devices, led by material-printer ecosystems from Stratasys and 3D Systems.
Thermoplastics Industry Leaders
-
Dow
-
LyondellBasell Industries Holdings BV
-
SABIC
-
Celanese Corporation
-
BASF
- *Disclaimer: Major Players sorted in no particular order
Thermoplastics Market Companies Covered in this Report
- 3M
- Arkema
- Asahi Kasei Corporation
- BASF
- Celanese Corporation
- Chevron Phillips Chemical Company
- Covestro AG
- Daicel Corporation
- Dow
- DSM
- DuPont
- Eastman Chemical Company
- Evonik Industries AG
- INEOS
- LANXESS
- LG Chem
- LyondellBasell Industries Holdings BV
- Mitsubishi Engineering-Plastics Corporation
- Polyplastics Co. Ltd
- SABIC
- Solvay
- TEIJIN LIMITED
Market Opportunities and Future Outlook
Opportunities are concentrated where compliance-grade circularity and low-carbon production are monetized through packaging, consumer goods, and regulated applications that require traceability and consistent performance. The EU PPWR and diverging recycled-content mandates are raising the value of certified circular feedstocks and design-for-recyclability solutions, creating whitespace for resin producers and compounders that can supply verified mass-balance materials, stable-quality PCR blends, and application development to help converters retool (for example, tethered-cap and packaging redesign programs in Europe). The LyondellBasell, Mondelez International, Amcor, and Taghleef Industries collaboration announced in July 2026 on Marabou flexible packaging containing 75% recycled content illustrates how branded-packaging specifications translate into demand for circular polyolefin solutions such as CirculenRevive.
Electrification, electronics, and construction-related substitutions support higher-value thermoplastics demand alongside regional capacity realignment. Arkema's March 2026 announcement to expand PVDF capacity at Changshu, China by 20% (targeting EV battery and semiconductor markets) and BASF's March 2026 start-up of an integrated Verbund platform in Zhanjiang indicate that suppliers are adding capability close to Asia's manufacturing base while building portfolios for EV and electronics requirements. In parallel, decarbonized production and regional resilience are becoming purchase and investment criteria in North America and Europe, visible in large projects such as Dow's Path2Zero restart in Fort Saskatchewan (May 2026 update) and Borealis investments at Burghausen, Germany to scale polypropylene technologies aimed at circularity and lightweighting.
Recent Industry Developments in Thermoplastics Market
- July 2026: LyondellBasell, Mondelez International, Amcor, and Taghleef Industries introduced flexible packaging for Marabou chocolate bars containing 75% recycled content using LyondellBasell's CirculenRevive polymers. The program demonstrates how brand-owner specifications can pull certified recycled-content polyolefins through converters and film structures, strengthening demand for circular feedstock supply chains.
- May 2026: Dow confirmed the restart of its USD 7.5 billion Path2Zero polyethylene and ethylene derivatives expansion in Fort Saskatchewan, Alberta, after a construction hiatus. Restarting the project advances a major low-carbon capacity platform and supports North American supply resilience amid feedstock and trade volatility.
- November 2025: SABIC launched NORYL WM300G resin for water-management applications, an impact-modified blend of PPE and PS designed to deliver high impact strength without traditional butadiene-based modifiers. The launch broadens options for pipes and profiles via injection molding and extrusion, supporting performance-led substitution in infrastructure-related end uses.
Thermoplastics Market Report Scope and Research Methodology
Market Definition and Coverage
For this study, the thermoplastics market is defined as revenues generated from thermoplastic polymer materials sold into industrial and consumer applications, across commodity, engineering, and high-performance grades, and measured in USD at the material level.
Scope exclusions: We exclude thermoset resins, elastomers, and fabricated plastic products where the polymer value is no longer separable from conversion and finished-goods pricing.
Segments Covered in This Report
- By Product Type
- Commodity Thermoplastics
- Polyethylene (PE)
- Polypropylene (PP)
- Polyvinyl Chloride (PVC)
- Polystyrene (PS)
- Engineering Thermoplastics
- Polyamide (PA)
- Polycarbonate (PC)
- Polymethyl Methacrylate (PMMA)
- Polyoxymethylene (POM)
- Polyethylene Terephthalate (PET)
- Polybutylene Terephthalate (PBT)
- Acrylonitrile-Butadiene-Styrene (ABS) / SAN
- High-Performance Thermoplastics
- Polyether Ether Ketone (PEEK)
- Liquid Crystal Polymer (LCP)
- Polytetrafluoroethylene (PTFE)
- Polyimide (PI)
- Other Product Types (PPE, PSU, PEI, PPS, ETFE, PFA, FEP, PBI)
- Commodity Thermoplastics
- By End-user Industry
- Packaging
- Building and Construction
- Automotive and Transportation
- Electrical and Electronics
- Sports and Leisure
- Furniture and Bedding
- Agriculture
- Medical
- Other End-user Industries
- By Geography
- Asia-Pacific
- China
- India
- Japan
- South Korea
- ASEAN Countries
- Rest of Asia-Pacific
- North America
- United States
- Canada
- Mexico
- Europe
- Germany
- United Kingdom
- France
- Italy
- Spain
- Russia
- Rest of Europe
- South America
- Brazil
- Argentina
- Rest of South America
- Middle-East and Africa
- Saudi Arabia
- South Africa
- Rest of Middle-East and Africa
- Asia-Pacific
Data Sources, Market Sizing, and Validation
Desk Research
Desk research started with public production and trade signals to ground the model in the real flow of polymers across regions. We referred to sources such as UN Comtrade for import and export patterns, the World Bank and IMF for macro indicators that affect plastics demand, and the USGS for petrochemical-linked feedstock context where relevant.
To keep the end-use split realistic, we also used publicly available materials from industry associations and standards bodies, peer-reviewed journals on polymer usage trends, plus company annual reports, investor presentations, and reputable press releases on capacity additions and plant outages. A paid subscription for company financials and another for patent intelligence were used selectively to confirm product mix changes and major commercialization themes. The list above is illustrative, and other public sources were also checked for data collection, validation, and clarification.
Primary Interviews and Surveys
Primary discussions were run with resin producers, compounders, converters, distributors, and large end users across packaging, construction, automotive, and electrical applications, so gaps left by public statistics could be filled with practical inputs. We used these calls to confirm typical price bands by resin family, regional demand swings, and how substitution toward engineering or high-performance grades is showing up in real purchase decisions.
Since this is a global market, interviews were spread across major consuming and producing regions to cross-check assumptions before finalizing the market totals.
Distribution of primary research fieldwork respondents
| Company type | Respondent position | Region |
|---|---|---|
| Top tier: 28% | CXOs: 13% | APAC: 44% |
| Mid tier: 58% | Functional/Unit leaders: 31% | EMEA: 33% |
| Smaller Players: 14% | Managers: 56% | Americas: 23% |
Market-Sizing & Forecasting
Sizing was built using a top-down approach where polymer demand is reconstructed from end-use activity and resin intensity, and then translated into value through region-appropriate average selling prices. To keep the math anchored, we applied checks using selective bottom-up approximations, such as sampled supplier and channel inputs on volumes, typical ASP by resin group, and shipment patterns from trade flows. When the two views diverged beyond a reasonable range, we adjusted totals.
Key inputs used in the model included packaging output trends, building and construction activity, light vehicle production and content shift to plastics, electrical and electronics production cycles, and capacity additions or outages in major thermoplastic chains. Because resin prices can move quickly, we used an ASP progression method that reflects feedstock-linked movements and mix shift between commodity, engineering, and high-performance grades, then validated the progression through primary feedback. Forecasts were produced with scenario analysis supported by near-term demand indicators and expert expectations, and then extended using a time-series smoothing step so short shocks do not overstate long-run growth.
Where direct bottom-up data was missing in smaller countries, we applied per-capita consumption and industry mix proxies, followed by regional normalization to keep totals consistent with the wider dataset.
Data Validation & Update Cycle
Outputs were validated through triangulation across independent signals, including trade direction, capacity utilization narratives, and end-use demand markers, and then reviewed for outliers at the country and region level. When a segment result looked inconsistent, assumptions were revisited and, where needed, follow-up calls were triggered to confirm whether the change was real or an artifact of pricing or mix.
Before sign-off, the model goes through multi-step analyst reviews that check arithmetic integrity, unit consistency, and year-on-year movement against known market events. The report is refreshed on an annual cycle, with interim updates when material events occur, such as sharp feedstock price changes or major capacity disruptions. Right before delivery, a final pass is completed so clients receive the most current view available at that time.
Mordor Intelligence's Thermoplastics Market Size Versus Other Published Estimates
Published market sizes for thermoplastics can look far apart even when they sound like they cover the same topic, because the boundaries and pricing layers are not always aligned. Differences usually come from what is counted as resin value versus converted plastics value, the year and currency timing used for pricing, and whether the model is built from end-use demand signals or from broad industry revenue totals.
The benchmark table shows a much lower value than some published figures, and in Mordor Intelligence's model the scope stays at thermoplastic polymer material revenues across defined resin families and end-use demand pools, rather than adding finished plastic products, downstream conversion margins, or full value chain revenues that inflate totals.
Benchmark comparison
| Source | Market Size | Gaps in Research Methodology |
|---|---|---|
| Mordor Intelligence | USD 22.34 B (2025) | |
| Global Consultancy A | USD 25.25 B (2024) | Uses a different base year and often leans on shipments-led revenue with a broad average price assumption, which can shift the value when resin mix and regional price timing are not re-based to the same year. |
| Industry Publisher B | USD 207.50 B (2025) | Appears to include a wider plastics value layer (including conversion and processed product value) and sometimes overlaps application and end-user accounting, which can multiply-count the same resin value across steps. |
Reading the three numbers together, the spread is mainly explained by what is counted and at which pricing layer the value is captured. By keeping the scope tied to material-level demand drivers and by rechecking prices and mix through interviews, the estimate stays traceable to clear variables that can be revisited as conditions change.
Key Questions Answered in the Report
How large is the thermoplastics market in 2026, and what growth is expected?
The Thermoplastics Market size is estimated at USD 23.25 billion in 2026 and is projected to reach USD 28.38 billion by 2031, growing at a 4.07% CAGR.
Which product segment is expanding fastest?
High-performance polymers drive growth with a projected 6.05% CAGR through 2031, as medical, aerospace, and electronics applications expand.
What end-user segment drives the most demand today?
Packaging remains the largest outlet, accounting for 34.10% of 2025 revenue, although its growth is slowing as recycled-content mandates mature.
Which region dominates consumption?
The Asia-Pacific region commands 50.76% of global demand and is also the fastest-growing, supported by integrated supply chains and rising consumer spending.
How are regulations influencing material choices?
Tighter single-use bans and recycled-content rules are steering buyers toward lightweight designs and certified post-consumer resins, especially in Europe and North America.