
Thermoplastic Pipe Market Size and Share
Market Overview
| Study Period | 2021 - 2031 |
|---|---|
| Market Size (2026) | USD 4.19 Billion |
| Market Size (2031) | USD 5.23 Billion |
| Growth Rate (2026 - 2031) | 4.52 % |
| Fastest Growing Market | Asia Pacific |
| Largest Market | Asia Pacific |
| Market Concentration | Medium |
Major Players *Disclaimer: Major Players sorted in no particular order Image © Mordor Intelligence. Reuse requires attribution under CC BY 4.0. | |
Thermoplastic Pipe Market Analysis by Mordor Intelligence
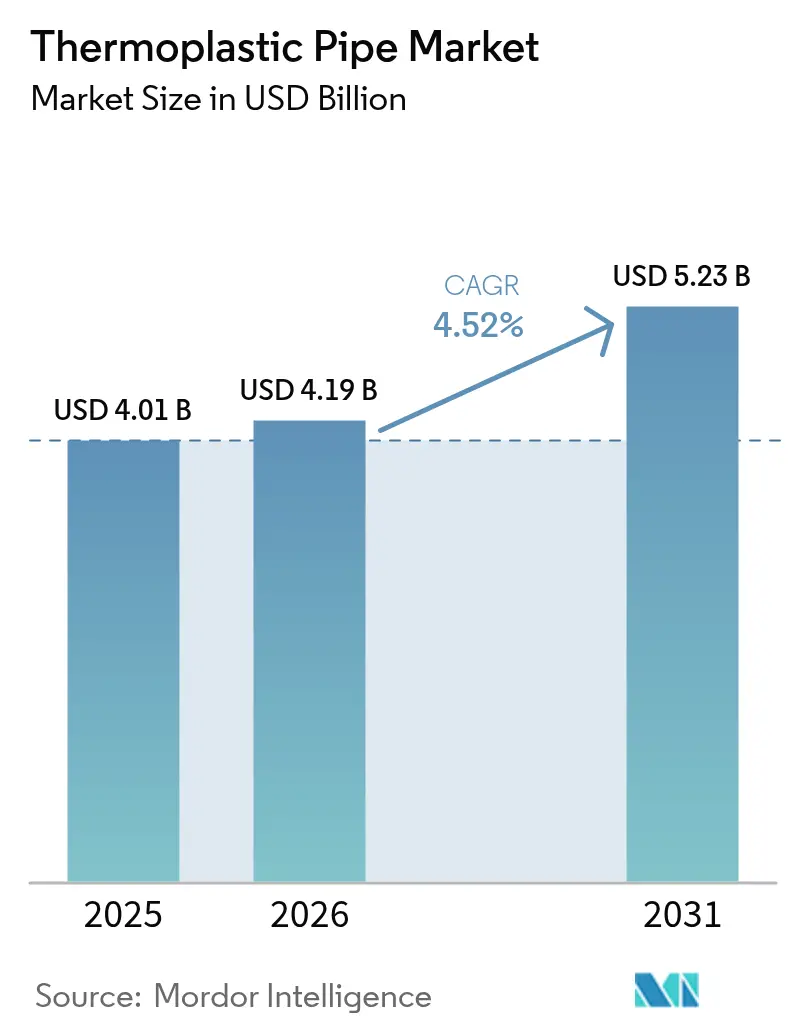
The Thermoplastic Pipe market size is expected to grow from USD 4.01 billion in 2025 to USD 4.19 billion in 2026 and is forecast to reach USD 5.23 billion by 2031 at 4.52% CAGR over 2026-2031.
As oil, gas, water, and process industry operators confront tougher corrosion-control mandates, they continue shifting capital budgets from carbon-steel pipelines toward lighter, non-corrosive polymers that shorten installation schedules and extend asset life. Policy measures such as the U.S. Department of Transportation’s new methane-leak rule and the EU’s Regulation 2024/1787 on energy-sector methane emissions accelerate the swap-out cycle by penalising fugitive emissions while rewarding materials with high joint integrity. Growing urban populations in Asia-Pacific (APAC) add another push factor: governments funnel infrastructure budgets into water and wastewater upgrades, opening large bid volumes that specify polyethylene (PE) or reinforced thermoplastic pipe (RTP). Operators in deepwater fields likewise favour thermoplastic composite pipe (TCP) because it eliminates corrosion and slashes offshore installation times by as much as 60%, a decisive benefit when daily rig costs run into USD hundreds-of-thousands. Despite these positives, adoption remains sensitive to oil-linked resin price swings and the pressure-temperature ceilings of most polymers relative to steel, a constraint that caps penetration in ultra-high-spec niches.
Key Report Takeaways
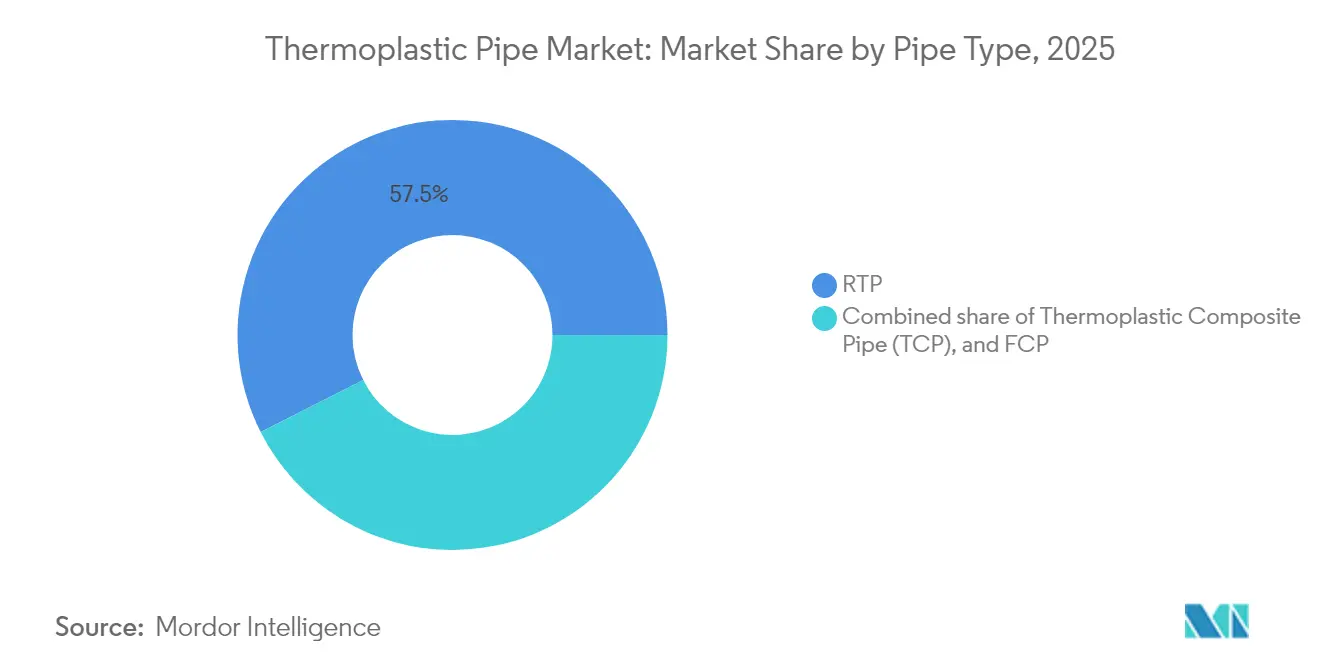
- By pipe type, reinforced thermoplastic pipe (RTP) led with 57.45% of the market share in 2025; thermoplastic composite pipe (TCP) is projected to expand at a 6.15% CAGR through 2031.
- By polymer type, polyethylene accounted for 47.60% of the thermoplastic pipe market size in 2025, while polyvinylidene fluoride (PVDF) is forecast to grow at a 6.90% CAGR between 2026-2031.
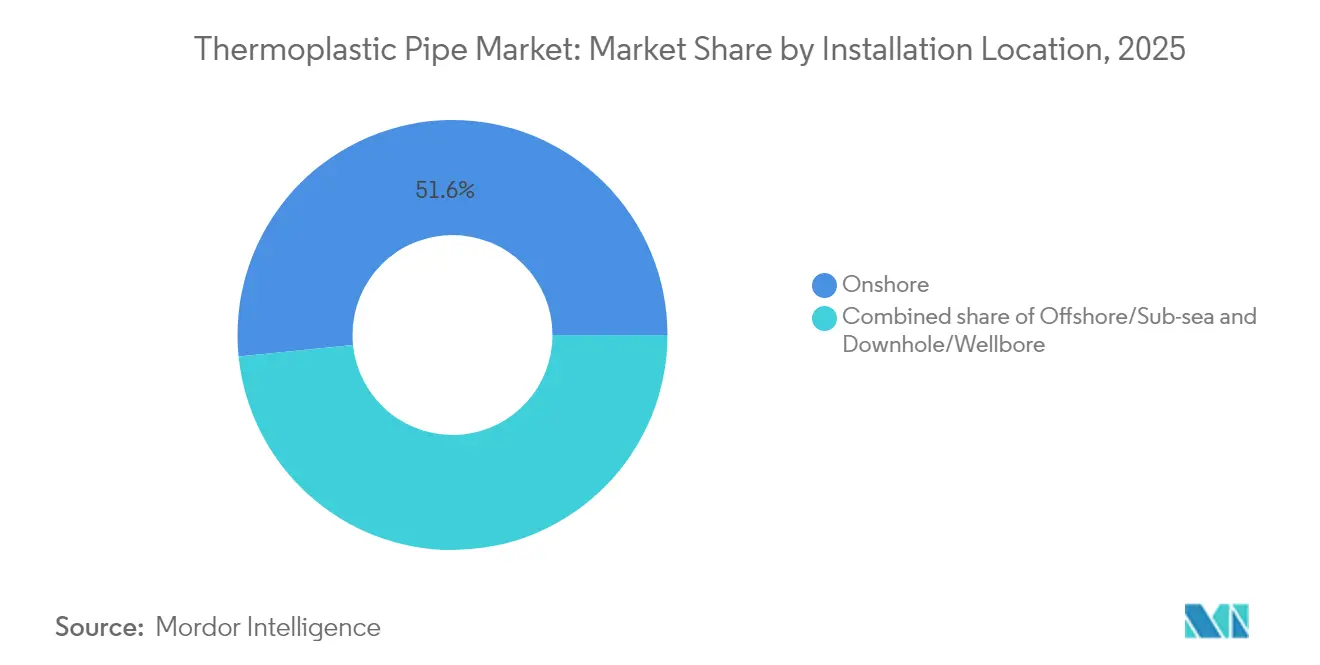
- By installation location, onshore pipelines represented 51.60% of the thermoplastic pipe market size in 2025; offshore/sub-sea installations are poised for the fastest 6.70% CAGR through 2031.
- By application, oil and gas contributed 61.30% of the thermoplastic pipe market share in 2025; chemical and process industries are expected to register a 6.40% CAGR to 2031.
- By geography, Asia-Pacific captured 45.60% revenue share in 2025, and the region is set to post a 6.30% CAGR through 2031.
Note: Market size and forecast figures in this report are generated using Mordor Intelligence’s proprietary estimation framework, updated with the latest available data and insights as of 2026.
Market Trends and Insights
Drivers Impact Analysis of Thermoplastic Pipe Market*
| Driver | (~)% Impact on CAGR Forecast | Geographic Relevance | Impact Timeline |
|---|---|---|---|
| Rapid replacement of corroded steel pipelines | +1.20% | North America & Europe; ripple effects global | Medium term (2-4 years) |
| Offshore operators’ shift to RTP/TCP | +0.80% | Gulf of Mexico, North Sea, West Africa, Brazil, Guyana | Long term (≥ 4 years) |
| Urban water & wastewater boom in APAC | +1.10% | India, Japan, Indonesia, Vietnam, Thailand | Medium term (2-4 years) |
| Tightening methane-leak regulations | +0.70% | United States and European Union | Short term (≤ 2 years) |
| Hydrogen-ready thermoplastic pilots | +0.40% | European Union & Japan | Long term (≥ 4 years) |
| Modular CCS plants adopting CO₂ lines | +0.30% | Industrialised clusters in North America, Europe, East Asia | Long term (≥ 4 years) |
| Source: Mordor Intelligence | |||
Rapid Replacement of Corroded Steel Pipelines
Municipalities and midstream operators are simultaneously confronting ageing assets installed during the 1970s-1990s construction wave; corrosion now drives roughly 46% of unplanned maintenance spending according to industry field audits.(1)Source: ASME Digital Collection, “Economic Analysis of Corrosion in Water Pipelines,” asme.org The U.S. Environmental Protection Agency estimates USD 630 billion in water system upgrades will be needed by 2045, with a USD 115 billion slice earmarked for stormwater networks—projects where PE and polypropylene (PP) pipe often deliver 30-50% installed-cost savings versus steel because lighter reels reduce crane hours and welds are replaced with electro-fusion joints. Advanced Drainage Systems’ Q1 2025 revenue rose 4.8% to USD 815.3 million, with infrastructure the standout growth driver amid Infrastructure Investment and Jobs Act funding.
Offshore Operators’ Shift to RTP/TCP for Flow-Lines
Deepwater prospects extend beyond 3,000 metres in Brazil’s pre-salt and western Atlantic acreage; pressures exceeding 10,000 psi, and carbon dioxide levels trigger stress corrosion in standard API-grade steel. In 2025, Baker Hughes secured contracts to supply 77 km of flexible pipe for Petrobras’ Búzios field, citing deployment efficiencies of 60% relative to welded steel stalks.(2)Source: Baker Hughes, “Flexible Pipe Systems Portfolio,” bakerhughes.comDutch specialist Strohm landed its largest TCP award for ExxonMobil’s Whiptail project, fabricating 24 jumpers for installation at 1,600 m water depth. Long-length spooling enables campaign execution with fewer vessel trips, while non-metallic carcasses eliminate corrosion monitoring—a benefit now quantified under new leak-detection rules.
Urban Water & Wastewater Infrastructure Boom in APAC
Rapid urbanisation stretches municipal networks beyond design capacity; India’s Jal Jeevan Mission targets 148 million rural households with tap connections by 2026, tripling pipe demand relative to 2021 levels according to Ministry of Jal Shakti tenders. Indonesia’s Medium-Term Development Plan allocates more than USD 30 billion for climate-resilient water works, prioritising high-density polyethylene (HDPE) mains able to tolerate ground movement and salt air.(3)Source: OECD, “Indonesia Climate-Resilient Infrastructure,” oecd.org Japan’s Ministry of Land, Infrastructure, Transport, and Tourism pushes digital twin upgrades, favoring PE because fusion joints can be monitored via RFID tagging for predictive maintenance. Regional chemical capacity is also set to almost double by 2030, driving ancillary pipe demand.
Hydrogen-Ready Thermoplastic Pipeline Pilots
Early distribution trials in Germany, the Netherlands, and Japan rely on PVDF or PE-RT variants certified for 100% hydrogen at 16 bar. In 2024, GF Piping Systems introduced a PVDF pipe array rated to 140 °C, noting demand from chemical producers switching to green-hydrogen feedstocks. Successful pilot completions accelerate broader network retrofits over the coming decade.
Restraints Impact Analysis of Thermoplastic Pipe Market*
| Restraint | (~)% Impact on CAGR Forecast | Geographic Relevance | Impact Timeline |
|---|---|---|---|
| Volatile crude-linked polymer prices | -0.90% | Global | Short term (≤ 2 years) |
| Pressure/temperature limits vs steel | -0.60% | High-spec regions worldwide | Medium term (2-4 years) |
| Slow deep-water qualification cycles | -0.30% | Gulf of Mexico, Brazil, West Africa | Long term (≥ 4 years) |
| Micro-plastics compliance on some resins | -0.20% | EU & North America, spreading to APAC | Medium term (2-4 years) |
| Source: Mordor Intelligence | |||
Volatile Crude-Linked Polymer Prices
Resin costs track naphtha and ethane feedstocks, and 2025 has already delivered month-on-month swings above 15% for PE and PP in North America amid plant outages and freight bottlenecks. Sekisui Chemical therefore announced 15% list-price hikes for potable-water PE pipe from April 2026. Such volatility compresses contractor margins and often triggers bid delays.
Pressure / Temperature Limits vs Steel
Standard PE grades derate sharply beyond 60 °C and seldom operate above 16 bar, restricting use in steam, geothermal, or ultra-deepwater risers where steel remains dominant. Even new PE4710 maxes at 1,000 psi design stress versus steel’s multithousand-psi ceiling.
*Our forecasts treat driver/restraint impacts as directional, not additive. The impact forecasts reflect baseline growth, mix effects, and variable interactions.
Thermoplastic Pipe Market Segment Analysis
By Pipe Type:
RTP Dominance Faces TCP Innovation ChallengeRTP captured 57.45% of the thermoplastic pipe market share in 2025 due to its long track record for medium-pressure hydrocarbon service. Demand is underpinned by shale gathering-line replacements in North America and water injection loops onshore Middle East. TCP, though newer, posts a 6.15% CAGR through 2031 as deepwater developers lock in its corrosion immunity and low carbon footprint. The thermoplastic pipe market size for TCP is projected to reach USD 1.69 billion by 2031 after starting from a USD 1.18 billion base in 2025. DNV’s 2024 hybrid composite flexible-pipe standard ST-F207 launch further legitimises TCP for high-tension riser duty. Flexible composite pipe (FCP) remains a niche solution for dynamic well intervention and subsea umbilical jumpers.
In markets where total installed cost is the decisive criterion, RTP maintains an edge because spoolable coils eliminate many flanges and welds, lowering field labour by up to 35%. Yet when performance in sour, high-pressure, or high-temperature conditions trumps capex, TCP increasingly secures the purchase order. Operators also value its lifecycle carbon reduction—studies show a 50 % smaller footprint than carbon-steel equivalents due mainly to lighter vessel loads and fewer fabrication steps. Over the forecast horizon, competitive pricing and third-party insurance relationships will determine how quickly TCP clips RTP’s lead.


By Polymer Type:
PE Stability Meets PVDF InnovationPolyethylene’s 47.60% share of the thermoplastic pipe market income 2025 rested on ubiquitous availability and straightforward fusion techniques. In water networks, PE-100 adopts electro-fusion couplers that finish joints in minutes, cutting leak potential and permitting trenchless installations beneath busy roadways. Nonetheless, the value growth story lies in PVDF, clocking a 6.90% CAGR on the back of hydrogen-ready trials and semiconductor clean-room piping. The thermoplastic pipe market size attributable to PVDF is slated to rise from USD 505 million in 2025 to USD 752 million by 2031. PVDF tolerates 140 °C, resists aggressive acids, and displays very low gas permeability, attributes showcased in GF Piping Systems’ SYGEF brand.
Polypropylene and PVC/CPVC occupy middle tiers, servicing districts such as hot-water supply and mining slurry where temperature or abrasion surpass PE’s comfort zone but not enough to justify PVDF or polyphenylene sulfide (PPS). Syensqo’s 2025 debut of extrudable PPS marks the first real challenger in 200 °C service, though early uptake remains confined to specialty downhole gas-lift lines. Material selection is thus moving away from one-size-fits-all toward application-specific blends, rewarding suppliers that can pair polymers with installation tooling and digital inspection protocols.
By Installation Location:
Onshore Stability Versus Offshore GrowthOnshore systems typically replace corroded legacy steel in gathering, distribution and water-supply grids; they supplied 51.60% of 2025 revenue, yet their CAGR lags at 3.7%. In contrast, offshore/sub-sea lines, currently 38.40% of spend, expand at 6.70% as IOC and NOC field-development plans concentrate on deepwater and high-CO₂ reservoirs. The thermoplastic pipe market size for offshore service is forecast to approach USD 2.26 billion by 2031, driven by Petrobras, ExxonMobil and TotalEnergies work programs that specify TCP jumper spools, dynamic risers and gas-lift flowlines. Baker Hughes’ PythonPipe portfolio illustrates the appeal—API 15S qualification up to 3,000 psi and 60% quicker lay times. Downhole/wellbore pipe rounds out demand, serving mechanical lift or chemical injection duties where small diameters and elevated temperatures prevail.
Component suppliers increasingly bundle pipe, couplings, bend stiffeners and digital tagging as pre-fabricated “line packages,” a model that compresses commissioning schedules. As EPC contractors adopt this methodology, the share of offshore thermoplastic packages relative to onshore replacements widens further.
By Application:
Oil & Gas Leadership Faces Chemical Industry AccelerationOil and gas consumed 61.30% of total metres in 2025 but records only a 3.9% CAGR as upstream capital shifts toward cash-flow discipline and decarbonisation. By contrast, the chemical and process sector posts a 6.40% CAGR, from USD 350 million today to USD 508 million in 2031, on surging demand for corrosion-proof pipe in battery-material plants, semiconductor fabs, and modular CCS units. This is where the thermoplastic pipe industry sees the fastest adjacency-led growth. Water & wastewater keep a steady 4.9% CAGR, benefiting from stimulus programs in the United States, India, and Indonesia. District heating and cooling, alongside mining slurry, remain smaller but strategically important niches that rely on thick-wall PP-R or high-density PE for abrasion resistance.
In CCS, operators must move dense-phase CO₂ that contains O₂, H₂S, and NOx impurities; laboratory testing has shown TCP retains tensile strength with no blistering after 10,000 hours at 80 °C and 100 bar. Such performance and the material’s low friction factor enhance volumetric efficiency and align with net-zero commitments.
Geography Analysis
APAC Thermoplastic Pipe Market
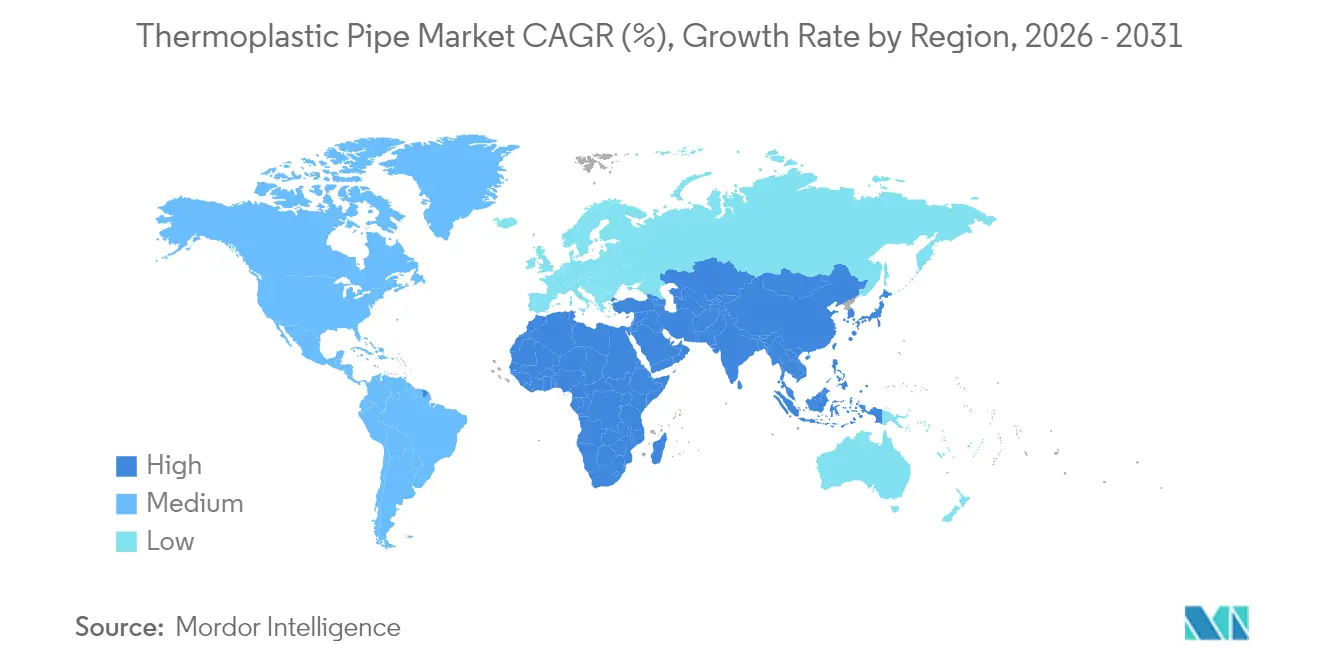
Asia-Pacific held 45.60% of revenue in 2025 and remains the demand locomotive with a 6.30% CAGR to 2031. APAC's thermoplastic pipe market size is projected to top USD 2.64 billion by 2031. India alone is letting water-sector tenders topping USD 2.8 billion for 2025, while Southeast Asian chemical output is set to approach USD 448 billion by 2030, doubling pipe requirements for process cooling loops. Vietnam is emblematic: SCG Chemicals has invested USD 700 million to bolster Long Son Petrochemicals, creating a local resin supply for pipe converters.
North America and Europe Thermoplastic Pipe Market
North America ranks second, powered by shale gathering upgrades and federal methane fees that make fused-joint PE an economic imperative. Advanced Drainage Systems’ sales trajectory underscores the volume, and U.S. stimulus bills funnel capital into stormwater retention and coastal resilience. Europe’s market matures along replacement cycles but gains a regulatory kicker from 2024/1787 and the Drinking Water Directive’s positive-list requirement.
MEA and South America Thermoplastic Pipe Market
South America, the Middle East, and Africa, are being served by deepwater activities in Brazil and West Africa and desalination pipelines around the Gulf. Funding models and qualification protocols remain hurdles, yet EPC contractors prefer spoolable RTP to remote oilfields where maintenance logistics cost premiums.

Regulatory Landscape
In the United States, PHMSA regulates pipeline materials for gas distribution under 49 CFR Part 192, with compliance reinforced through the periodic incorporation by reference of consensus standards for plastic pipe systems. In July 2025, PHMSA took actions to incorporate PPI TR-4 (hydrostatic design basis listings for thermoplastic piping materials), and in 2026 it issued direct final rules that update references to ASTM D2513 for polyethylene (PE) gas pressure pipe and incorporate ASTM F1973 for factory-assembled anodeless risers and transition fittings used with PE and PA11/PA12 systems.
Internationally, the standards framework keeps expanding thermoplastic pipe use-cases in oil and gas beyond conventional distribution networks. ISO/PAS 16846:2025 (published July 2025) sets requirements for downhole thermoplastics lined tubing (TLT), including polymers such as PE, PE-RT, PP, and PVDF, while offshore qualification pathways increasingly rely on third-party design and verification frameworks that operators and EPCs apply for composite and reinforced thermoplastic systems.
Competitive Landscape
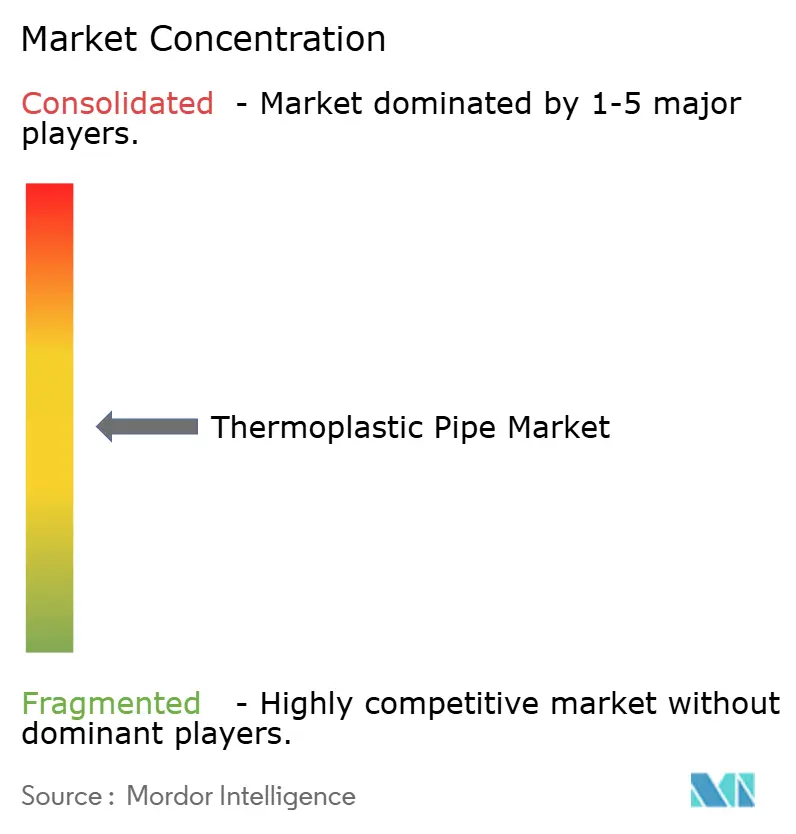
The thermoplastic pipe market is characterised by moderate fragmentation; the top five suppliers collectively hold about 28%, yielding room for regional specialists and vertically integrated EPCs. TechnipFMC, Baker Hughes, Shawcor, Prysmian, and GF Piping Systems use proprietary material blends, rapid spool bases, and turnkey installation services as entry barriers. Georg Fischer’s 2025 purchase of VAG Group broadened its valve line-up, enabling packaged water-utility solutions under the newly formed GF Uponor division. Prysmian’s USD 950 million acquisition of Channell Commercial adds thermoplastic enclosures to its fibre-optic cable roster, reinforcing cross-selling to telco civil works.
Baker Hughes pushes technology boundaries through its SureCONNECT FE fibre-optic wet-mate system, opening downhole data-rich strings compatible with PythonPipe reinforced thermoplastics. Advanced Drainage Systems focuses on municipal stormwater with acquisitions such as Orenco Systems, capturing the fragmented onsite septic niche. Meanwhile, Strohm pioneers fully recyclable TCP manufacturing using circular resins, a differentiator for ESG-minded IOCs.
Cost leadership remains pivotal, but customers now score bids on lifecycle emissions and digital-readiness—traitsfavoringr companies offering bio-based PE or embedded RFID tags for asset tracking. Because documentation and compliance weigh heavily in pipeline tenders, suppliers with robust test data and third-party certifications win a disproportionate share of high-spec projects.
Thermoplastic Pipe Industry Leaders
Pipelife Nederland BV
Airborne Oil & Gas BV
Master Tech Company FZC
Future Pipe Industries
AMIANTIT Service GmbH
- *Disclaimer: Major Players sorted in no particular order
Thermoplastic Pipe Market Companies Covered in this Report
- TechnipFMC
- Pipelife Nederland BV
- Advanced Drainage Systems (ADS)
- Shawcor - Flexpipe Systems
- Future Pipe Industries
- National Oilwell Varco (NOV) - Fiberglass Systems
- Baker Hughes - Composite Pipe Solutions
- Prysmian - Subsea Composite Lines
- Polyflow LLC
- Magnum RTP
- Airborne Oil & Gas
- GF Piping Systems
- Wavin
- ALFAGOMMA Industrial Piping
- Simtech Process Systems
- Tianjin Jingtong Pipe Industry
- Cosmoplast
- Astral Limited
- IPEX Inc.
- Uponor

Market Opportunities and Future Outlook
Subsea and offshore projects remain a visible white space where corrosion management and installation logistics drive total cost, and recent contract awards reinforce demand for thermoplastic composite pipe (TCP). In May 2026, Strohm secured a TCP flowline contract for the West Delta Deep Marine gas project offshore Egypt, and in March 2026 it received an award to supply insulated TCP production jumpers for an offshore Sabah, Malaysia field extension, pointing to continued procurement of deepwater-capable, spoolable non-metallic line packages that can be installed using multi-purpose vessels.
Opportunities are also showing up as operators push thermoplastic performance into higher-pressure and more chemically aggressive service through qualification programs and hybrid designs. Baker Hughes and Strohm announced a partnership (May 2026) to develop a hybrid flexible pipe aimed at ultradeepwater flowline and riser applications, while standards-based design and verification frameworks (including DNV guidance used for thermoplastic composite pipe design and analysis) help support procurement confidence for subsea and riser-duty deployments. In parallel, onshore applications in chemical and process settings, supported by reported commercial deployment of bonded composite pipe for rich monoethylene glycol transport in gas processing systems, widen the addressable use beyond traditional gathering and municipal networks.
Recent Industry Developments in Thermoplastic Pipe Market
- May 2026: Strohm secured a contract to supply a 2,000 m carbon fiber-reinforced PA12 thermoplastic composite pipe flowline for the West Delta Deep Marine gas project offshore Egypt, operated by Burullus Gas Company. The award reflects continued operator shift toward non-metallic subsea flowlines for corrosion resistance and faster installation using horizontal lay methods from multi-purpose vessels.
- June 2025: Prysmian completed its acquisition of Channell Commercial Corporation for a base purchase price of USD 950 million. The deal expands Prysmian's presence in thermoplastic enclosure and management solutions used across infrastructure builds, supporting broader cross-selling into civil and utility project pipelines where plastic systems are specified.
- November 2024: SCG Chemicals announced a USD 700 million investment to enhance ethane usage at Vietnam's Long Son Petrochemicals complex. The investment strengthens regional resin supply fundamentals for downstream plastic conversion, improving local availability of feedstocks that support thermoplastic pipe manufacturing in Asia-Pacific.


Thermoplastic Pipe Market Report Scope and Research Methodology
Market Definition and Coverage
This market covers the revenue generated from thermoplastic pipes that are manufactured and sold for fluid and gas conveyance across industrial, energy, and utility uses, counted at the first point of sale in each geography.
Scope exclusions: We exclude installation labor and broader project EPC value. We also exclude fittings and accessories when they are priced and sold as separate line items.
Segments Covered in This Report
- By Pipe Type
- Reinforced Thermoplastic Pipe (RTP)
- Thermoplastic Composite Pipe (TCP)
- Flexible Composite Pipe (FCP)
- By Polymer Type
- Polyethylene (PE)
- Polypropylene (PP)
- Polyvinylidene Fluoride (PVDF)
- Poly Vinyl Chloride (PVC/CPVC)
- Others (PA, PPS, etc.)
- By Installation Location
- Onshore
- Offshore/Sub-sea
- Downhole/Wellbore
- By Application
- Oil and Gas
- Water and Wastewater
- Chemical and Process Industries
- Mining and Slurry
- District Heating and Cooling
- By Geography
- North America
- United States
- Canada
- Mexico
- Europe
- Germany
- United Kingdom
- France
- Italy
- Russia
- Rest of Europe
- Asia-Pacific
- China
- India
- Japan
- South Korea
- ASEAN Countries
- Rest of Asia-Pacific
- South America
- Brazil
- Argentina
- Rest of South America
- Middle East and Africa
- Saudi Arabia
- United Arab Emirates
- South Africa
- Egypt
- Rest of Middle East and Africa
- North America
Data Sources, Market Sizing, and Validation
Desk Research
Desk work starts with building a clean fact base on how thermoplastic pipe demand typically moves across construction, municipal networks, and energy projects. We review public sources such as US Census Bureau construction spending series, USGS materials statistics (as a proxy for upstream polymer and additives), UN Comtrade trade flows for plastic pipes and related HS codes, and customs and port statistics published by national agencies.
To ground the industry structure, we also refer to company annual reports, investor presentations, and press releases. We then cross-check standards body content such as ASTM and ISO publications that clarify relevant pipe grades and performance classes. Patent databases are used selectively to understand adoption of reinforced thermoplastic designs and multilayer constructions, which helps avoid mixing adjacent product families. This list is illustrative only, and many other public sources were also used to collect data, validate assumptions, and clarify unclear points during the study.
Primary Interviews and Surveys
Primary inputs were taken from interviews and structured surveys with manufacturers, distributors, EPC-linked stakeholders, and large end users who influence specifications and purchasing. We used these conversations to confirm application mix, regional price bands, and how project-driven demand translates into ordering schedules, so desk signals could be converted into usable sizing inputs across APAC, EMEA, and the Americas.
Distribution of primary research fieldwork respondents
| Company type | Respondent position | Region |
|---|---|---|
| Top tier: 37% | CXOs: 14% | APAC: 43% |
| Mid tier: 48% | Functional/Unit leaders: 39% | EMEA: 34% |
| Smaller Players: 15% | Managers: 47% | Americas: 23% |
Market-Sizing & Forecasting
The market is sized using a top-down build that starts from end-use demand pools and infrastructure activity, and then converts them into pipe consumption using adoption and replacement logic. In practice, we map indicators such as municipal water and wastewater capex, oil and gas pipeline and flowline activity, building starts, and industrial expansion signals to likely pipe meters installed, which are then valued using application-specific average selling prices.
To keep the totals realistic, the outputs are corroborated with selective bottom-up approximations, including manufacturer capacity and utilization checks, sampled project bills of materials, and channel feedback on volumes and pricing. Where the two views do not align, we adjust assumptions and rerun the conversion steps. Inputs that typically move the model include polymer price trends and pass-through timing, diameter mix shifts, pressure rating upgrades, share of reinforced thermoplastic pipe within energy uses, and import penetration where trade data indicates supply gaps. When coverage is limited in certain countries, gaps are handled by using benchmark consumption per unit of construction activity and tuning it with local interview feedback.
For forecasting, scenario analysis is used to reflect different capex timing and energy project sanctioning cycles. The scenarios are then anchored to an expected-case path agreed with primary respondents. Year-by-year values are kept consistent with macro signals, and pricing is treated separately from volume so the model does not overstate growth during resin price swings.
Data Validation & Update Cycle
Validation is done through stepwise checks where modeled demand is compared with independent signals, including trade flows, public construction spending series, and upstream polymer availability cues. Outliers are flagged and reviewed, and follow-up calls are triggered when price bands, application mix, or regional growth rates fall outside what respondents described.
Before sign-off, the work is reviewed in multiple analyst passes so assumptions, conversions, and currency handling remain consistent across countries and years. The report is refreshed annually, and interim updates are made when material events occur, such as sharp resin price changes, large project delays, or policy-driven infrastructure funding shifts. Right before delivery, we do a fresh data pass so clients receive the most current view that can be supported by traceable inputs.
Mordor Intelligence's Thermoplastic Pipe Market Estimate Compared With Other Published Estimates
Published market numbers for thermoplastic pipe often do not match because the scope lines are drawn differently and the starting year is not always the same. Differences also show up when studies treat reinforced thermoplastic pipe and composite variants as either core scope or an adjacent add-on. Additional gaps arise when currency timing and price progression rules are handled in different ways.
The benchmark table shows a noticeable spread, and in Mordor Intelligence's model the total is tied to thermoplastic piping revenues with segmentation by pipe type, polymer type, installation location, application, and geography, rather than folding in broader plastic piping systems or project-installed value. Gaps usually come from mixing fittings into the pipe number, using more aggressive resin pass-through assumptions to lift ASPs, and relying on older base-year pricing without a clear refresh point, which can shift the current-year value up or down even if volumes are similar.
Benchmark comparison
| Source | Market Size | Gaps in Research Methodology |
|---|---|---|
| Mordor Intelligence | USD 4.19 B (2026) | |
| Global Consultancy A | USD 4.56 B (2026) | Uses a higher 2026 value that is consistent with a broader product interpretation, where reinforced thermoplastic and composite variants are more fully blended across applications, and ASP uplift appears to be carried forward from a different base-year pricing set. |
| Industry Publisher B | USD 2.83 B (2024) | Anchors sizing on a 2024 base year and a narrower captured revenue pool, which can understate the market when newer energy and municipal projects are not fully reflected and when cross-region currency conversion is applied earlier in the time series. |
Taken together, the comparison mainly reflects scope and year alignment, not a simple disagreement on growth direction. By keeping the model tied to clear demand drivers like municipal capex, energy activity, and application-level price bands, the resulting number stays easier to reproduce and update when inputs shift.


Key Questions Answered in the Report
What is the current size of the thermoplastic pipe market?
The thermoplastic pipe market was valued at USD 4.19 billion in 2026 and is forecast to reach USD 5.23 billion by 2031 at a 4.52% CAGR.
Which region leads global demand?
Asia-Pacific accounts for 45.60% of 2025 sales and is expanding at a 6.30% CAGR thanks to large-scale water and infrastructure projects.
Which pipe type is growing fastest?
Thermoplastic composite pipe (TCP) shows the strongest 6.15% CAGR through 2031, propelled by offshore deep-water projects.
How do recent methane regulations affect adoption?
U.S. and EU leak-detection mandates raise penalties on fugitive emissions, pushing operators toward fused-joint thermoplastic systems that inherently reduce leaks.
What raw-material risks exist for buyers?
Polymer prices move with crude-oil feedstocks, and 2025 resin price swings above 15% highlight the importance of long-term supply contracts and strategic inventory.
Page last updated on:


 Your data is secure and never sold or shared.


