
Thermoform Packaging Market Size and Share
Market Overview
| Study Period | 2020 - 2031 |
|---|---|
| Market Size (2026) | USD 49.55 Billion |
| Market Size (2031) | USD 61.77 Billion |
| Growth Rate (2026 - 2031) | 4.51 % |
| Fastest Growing Market | Asia Pacific |
| Largest Market | Asia Pacific |
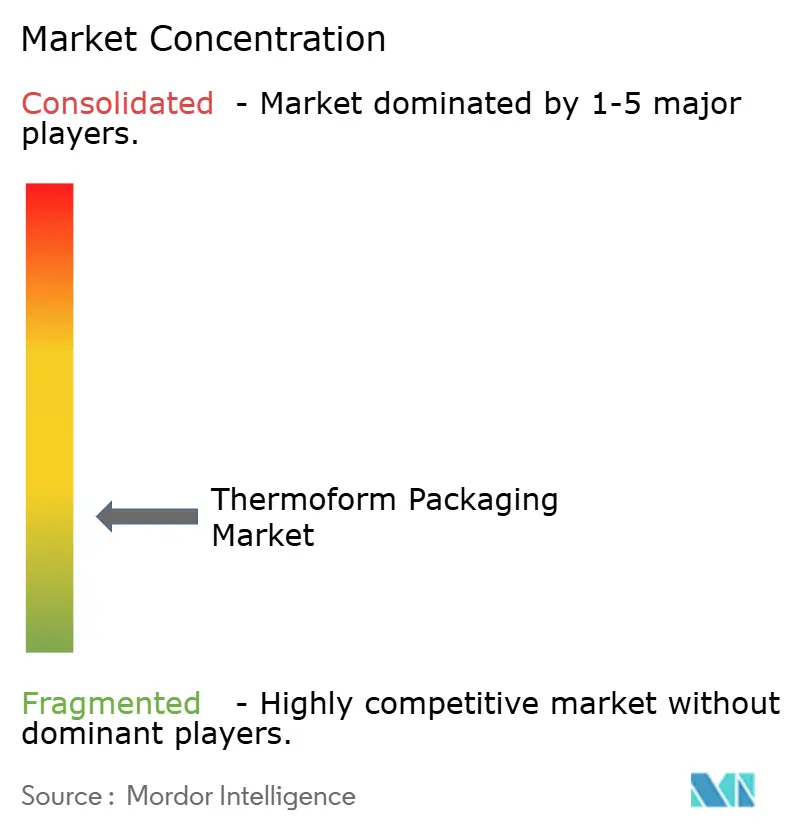
| Market Concentration | Low |
Major Players *Disclaimer: Major Players sorted in no particular order Image © Mordor Intelligence. Reuse requires attribution under CC BY 4.0. | |
Thermoform Packaging Market Analysis by Mordor Intelligence
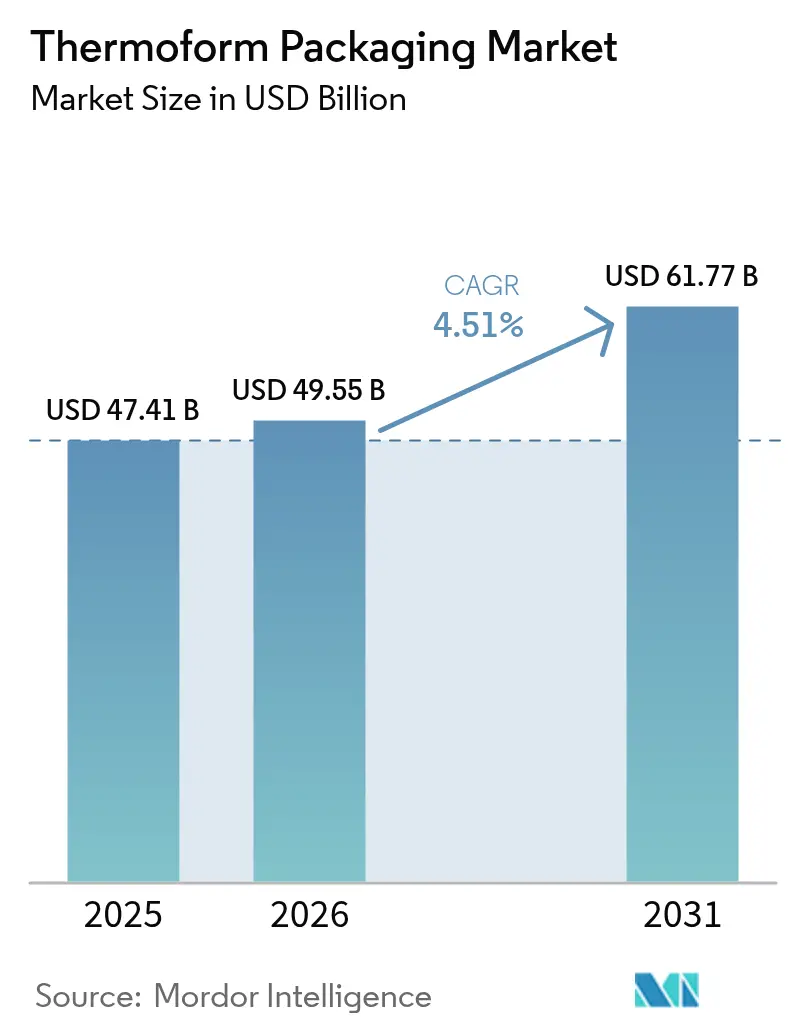
Thermoform packaging market size in 2026 is estimated at USD 49.55 billion, growing from 2025 value of USD 47.41 billion with 2031 projections showing USD 61.77 billion, growing at 4.51% CAGR over 2026-2031. Demand is underpinned by regulatory mandates for recyclable formats, steady penetration of Industry 4.0 production lines and sustained consumer preference for convenient, portion-controlled packs. Mono-material tray designs, meal-kit proliferation and the switch from glass vials to polymer blisters in injectables are reshaping product specifications, while automation‐enabled short runs are widening customer choice. Producers are balancing energy-intensive PET and polypropylene cycles with rPET and bio-resins, seeking cost offsets from eco-modulated fees. Strategic acquisitions—most notably Toppan’s purchase of Sonoco’s thermoforming assets and the Amcor–Berry merger—signal a race for scale, broader geographic reach and deeper material science capabilities.
Key Report Takeaways
- By material, plastics retained 62.07% share of the thermoform packaging market size in 2025, while bio-based and biodegradable polymers are set to grow at an 8.21% CAGR to 2031.
- By product type, blisters led with 37.05% of revenue in 2025; trays and lids represent the fastest-growing segment at 7.6% CAGR.
- By packaging thickness, ≤200 µm held 59.85% share of the thermoform packaging market size in 2025, whereas the 200–500 µm band is advancing at an 7.95% CAGR.
- By end-user industry, food and beverage contributed 50.06% of 2025 sales; pharmaceuticals and medical applications are growing the quickest at 9.04% CAGR.
- By technology, vacuum forming accounted for 44.8% of revenue in 2025, while pressure forming is expanding at 8.29% CAGR.
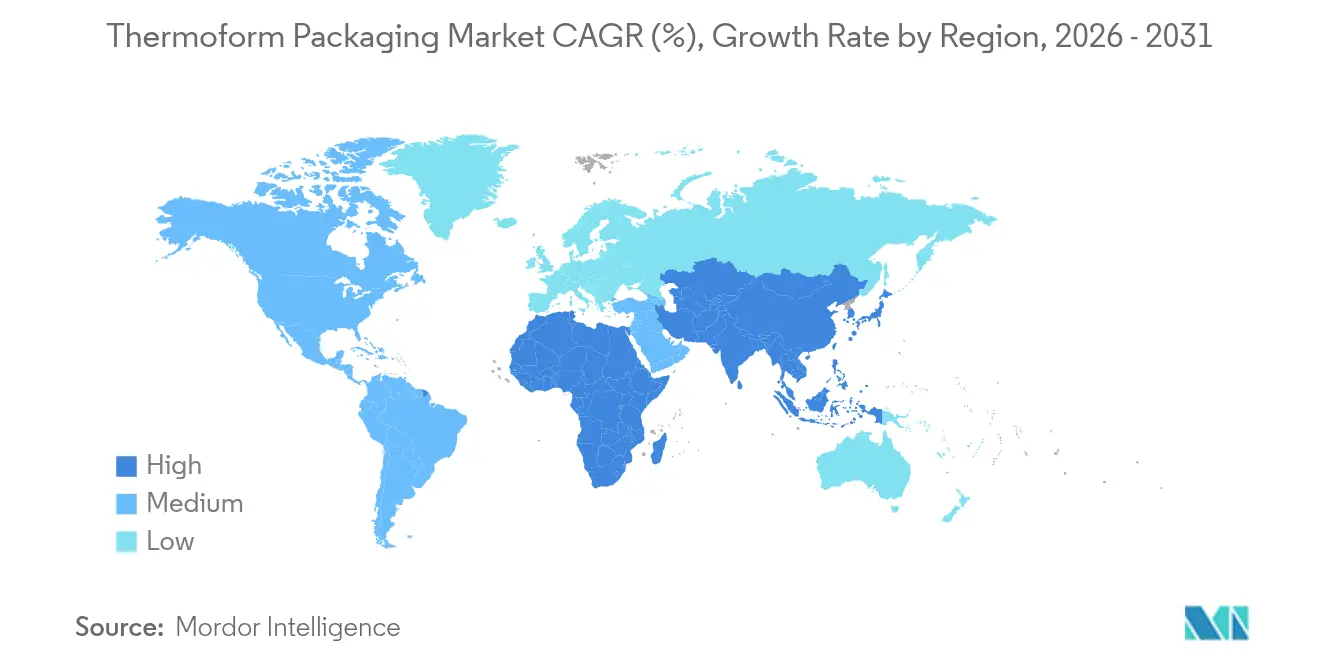
- By geography, Asia-Pacific commanded 39.76% of the thermoform packaging market share in 2025; the region is projected to expand at a 7.05% CAGR through 2031.
Note: Market size and forecast figures in this report are generated using Mordor Intelligence’s proprietary estimation framework, updated with the latest available data and insights as of 2026.
Market Trends and Insights
Drivers Impact Analysis of Thermoform Packaging Market*
| Driver | (~) % Impact on CAGR Forecast | Geographic Relevance | Impact Timeline |
|---|---|---|---|
| Surge in demand for mono-material recyclable trays | +1.2% | Global, with EU and North America leading | Medium term (2-4 years) |
| Growth of fresh meal-kit delivery startups | +0.8% | North America & EU, expanding to APAC | Short term (≤ 2 years) |
| Per-capita rise in single-serve convenience foods | +0.9% | Global, particularly urban centers | Medium term (2-4 years) |
| Shift from glass vials to thermoform blister packs in injectables | +0.7% | Global, with APAC and North America core | Long term (≥ 4 years) |
| Automation lowering tooling-changeover cost (Industry 4.0 lines) | +0.6% | North America & EU, spill-over to APAC | Long term (≥ 4 years) |
| Government stimulus for on-shore pharmaceutical packaging | +0.5% | National, with early gains in US and EU | Medium term (2-4 years) |
| Source: Mordor Intelligence | |||
Surge in demand for mono-material recyclable trays
Circular-economy rules are steering converters toward PET- or PE-only tray structures that pass curbside sortation tests. Graphic Packaging International’s Ecoflex™ PET line, for instance, meets the EU 2030 recyclability requirement while preserving top-seal integrity for chilled foods. Lower eco-modulated fees in Europe, coupled with brand owner commitments, boost the business case despite thicker walls needed to replicate multilayer barriers. ExxonMobil and Alpine jointly validated all-PE thermoforms that sustain oxygen barriers after nine recycling loops, underscoring material science advances.
Growth of fresh meal-kit delivery startups
HelloFresh and peer platforms have scaled to tens of millions of weekly servings, forcing packagers to optimize freshness over multiday transit, curb mass and hit carbon targets. Barrier-enhanced polypropylene trays paired with recyclable film lidding are proliferating, while vacuum-skin formats suppress drip loss and extend shelf life. Temperature sensors and QR-based provenance tags embedded into lids are emerging differentiators, fostering premium pricing.
Per-capita rise in single-serve convenience foods
Urban households prioritizing portion control translate into higher unit volumes per tonne of product. Berry Global’s 125 g PP dessert cups illustrate the shift, offering clarity and leak-proof seals for rail-commuter snacking. The dynamic also spills into over-the-counter pharmaceuticals, where unit-dose blisters support adherence.
Shift from glass vials to thermoform blister packs in injectables
Biologic therapies benefit from shatter-free polymer blisters that minimize particulate risk and lower cold-chain weight. US FDA fast-track pathways for advanced manufacturing further de-risk adoption. Brand owners report double-digit falls in breakage-related rejects after switching.
Restraints Impact Analysis of Thermoform Packaging Market*
| Restraint | (~) % Impact on CAGR Forecast | Geographic Relevance | Impact Timeline |
|---|---|---|---|
| Accelerating plastic-use taxation in EU and North America | -0.9% | EU and North America, expanding globally | Short term (≤ 2 years) |
| Sporadic supply of medical-grade PP and PET sheets | -0.6% | Global, with APAC manufacturing hubs affected | Medium term (2-4 years) |
| High energy intensity vs. molded-fiber forming | -0.4% | Global, particularly energy-intensive regions | Medium term (2-4 years) |
| Limited barrier performance for oxygen-sensitive SKUs | -0.3% | Global, affecting food and pharmaceutical applications | Long term (≥ 4 years) |
| Source: Mordor Intelligence | |||
Accelerating plastic-use taxation in EU and North America
Italy’s levy of EUR 0.45/kg on virgin polymers joined the UK’s recycled-content tax in 2024, slicing converter margins unless material mixes exceed 30% recyclate. [1]EY, “Italy’s Plastic Tax Will Enter into Force on 1 July 2024,” ey.com Registered UK businesses remitted more than GBP 200 million in the first 18 months, highlighting fiscal bite.[2]MHA, “ESG & the Impact of Plastic Packaging Tax,” mha.co.uk
Sporadic supply of medical-grade PP and PET sheets
Resin rationing during 2024–2025 constrained healthcare converters. Kaysun’s database expansion and INVISTA’s MedSelect PP grades mitigated shortages but added qualification lead times.
*Our forecasts treat driver/restraint impacts as directional, not additive. The impact forecasts reflect baseline growth, mix effects, and variable interactions.
Thermoform Packaging Market Segment Analysis
By Material:
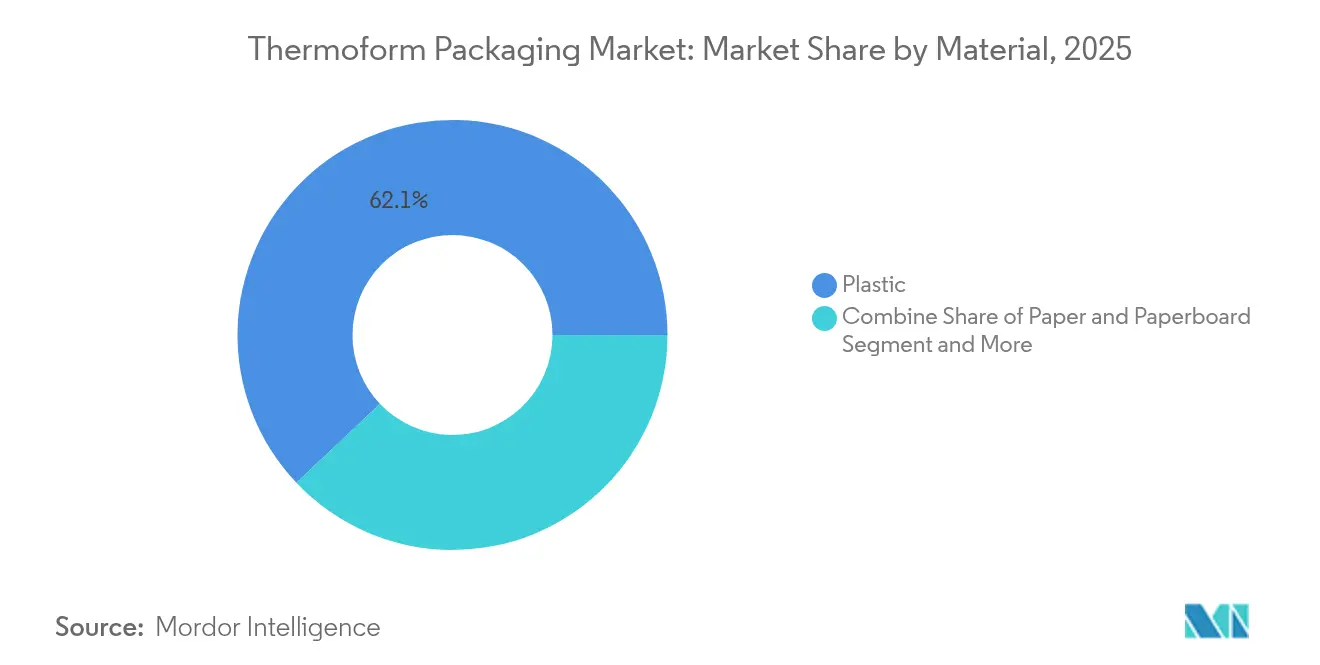
Plastic dominance faces bio-based challengePlastics delivered 62.07% of 2025 sales, equating to the largest slice of the thermoform packaging market. rPET trays and PP cups stay competitive on barrier metrics and line efficiency, while price spikes in prime resin strengthen recyclate economics. Bio-based polymers, led by PLA blends, chart an 8.21% CAGR and benefit from policy carrots such as EU compostability labeling. The thermoform packaging market size for bio-based grades is projected to triple between 2025 and 2030 as high-volume food service chains lock in low-carbon packaging contracts. Scaling hurdles persist around feedstock supply continuity and heat-distortion thresholds beyond 60 °C.
In contrast, paperboard thermoforms carve niche demand in bakery and ready-meal lids where grease resistance can be engineered with plant-based coatings. Aluminum retains service in airline catering owing to lightweight-to-strength ratios but its share inches downward on cost volatility and recycling energy load. Cascades’ 100% rPET rolled-edge tray underlines how incumbent polymers evolve to satisfy rising recycled-content quotas.


By Product Type:
Blisters lead while trays accelerateBlister packs captured 37.05% of 2025 turnover, leveraging tamper evidence and unit-dose accuracy for OTC medicines and nutraceuticals. Volume growth aligns with ageing demographics and strict drug compliance rules. Trays and lids, however, are the fastest climber at 7.6% CAGR, with meal-kit firms standardizing portioned protein and produce cells. The thermoform packaging market size for trays surpassed USD 15.6 billion in 2026, supported by supermarket delis converting from EPS to clear PET. Pressure-formed dual-compartment inserts appeal to premium confectionery seeking elevated shelf presence without secondary cartons.
Blister innovators embed digital watermarking for authentication, while trays undergo design-for-recycling audits to shave EPR fees. Recloseable clip-on lids boost consumer convenience, encouraging reuse and aligning with brand waste-reduction pledges.
By Packaging Thickness:
Thin-wall dominance drives efficiencyThin-wall formats ≤200 µm secured 59.85% revenue in 2025, driven by cost avoidance and lightweighting mandates. They support high-speed fill-seal lines in yogurt and dessert operations. Yet the 200–500 µm bracket is pacing at 7.95% CAGR on strength needs in surgical kit blisters and returnable e-commerce inserts. Above 500 µm applications revolve around industrial dunnage where cycle durability overrides material spend. ALPLA’s rePETec containers prove 0.2 mm walls can survive hot-fill conditions, slashing polymer use 25% per unit.
By End-User Industry:
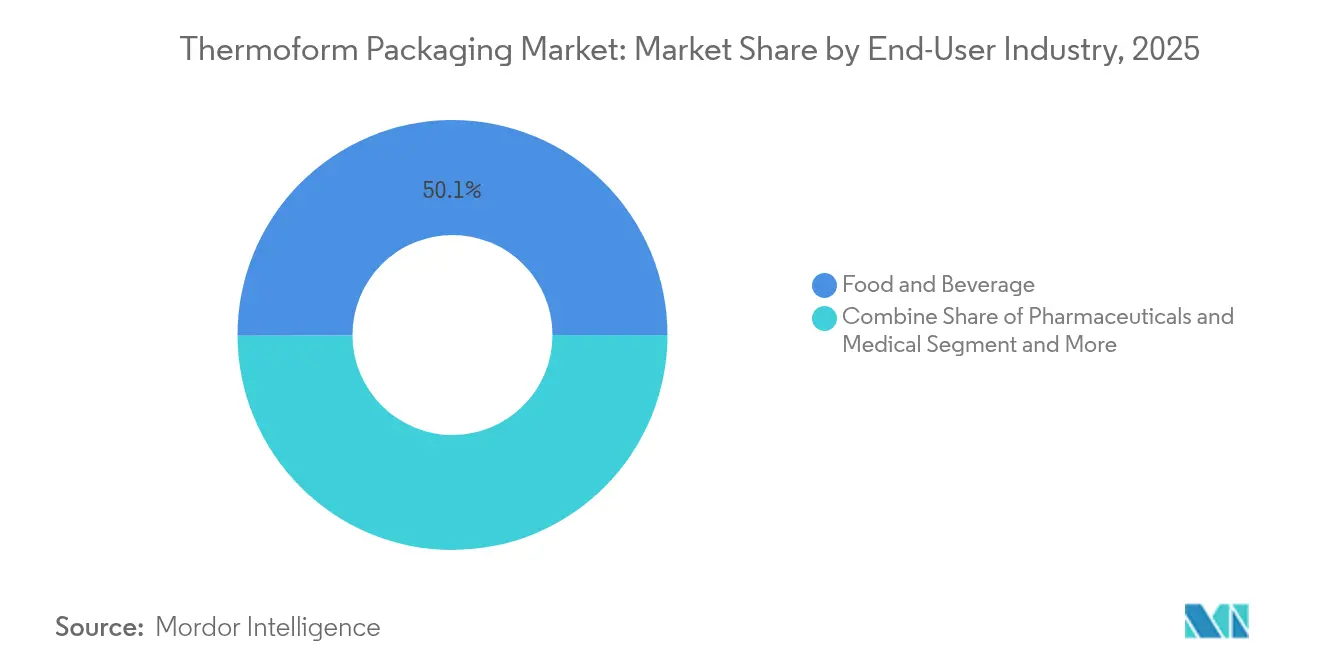
Food leads, pharmaceuticals surgeFood and beverage delivered 50.06% of receipts in 2025, anchored by chilled ready meals and on-the-go snacks. However, pharma and medical packs are racing ahead at 9.04% CAGR. Single-dose biologics, self-administered injectables and diagnostics test cassettes all pivot toward form-fill-seal blistering that assures sterility. The thermoform packaging industry is also courting personal-care brands seeking Instagram-ready clamshells that protect fragile glass while amplifying shelf appeal.
By Thermoforming Technology:
Vacuum forming dominates, pressure forming advancesVacuum forming occupied 44.8% of 2025 value, prized for tooling economy and rapid prototyping. Enhanced ceramic heater arrays now tighten sheet temperature windows, cutting scrap below 3%. Pressure forming shows greatest upside at 8.29% CAGR, supplying finely grained fascia in automotive interiors and boutique electronics. AI-directed plug-assist systems modulate force vectors, yielding wall-thickness uniformity within ±3%, a leap from the 8% variance common five years ago.
Geography Analysis
APAC Thermoform Packaging Market
Asia-Pacific’s 39.76% hold on the thermoform packaging market is fortified by vertically integrated resin hubs in China and India coupled with rising disposable incomes. Government-led pharma parks and e-commerce booms in tier-2 cities sustain a 7.05% regional CAGR. Indian converters leverage Extended Producer Responsibility credits to co-invest in PET flake plants, boosting rPET tray output for quick-service restaurants.
North America Thermoform Packaging Market
North America presents a mature but innovation-hungry landscape. Four US states have enacted EPR statutes compelling brand owners to bankroll end-of-life programs; converters thus pilot colorant-free PET and digital watermarks to ease sorting. FDA advanced manufacturing incentives accelerate domestic blister capacity, supporting on-shoring of critical drug packaging.
Europe Thermoform Packaging Market
Europe enforces the strictest regime, with the 2030 recyclability rule and graduated recycled-content thresholds pushing rapid material reformulation. Plastic levies in Italy and Spain raise virgin-polymer costs by as much as USD 550/tonne equivalent, hastening adoption of recyclable PP and PET blends. Faerch’s pledge to incorporate 100,000 t/yr of post-consumer PET into food trays exemplifies region-specific circularity scale-ups.
LATAM and MEA Thermoform Packaging Market
Latin America and the Middle East & Africa trail in market size yet post stable mid-single-digit growth on back of urbanization and food retail modernization. Local players invest in rPET sheet extrusion capacity to circumvent import tariffs and adhere to emerging regional waste policies.

Regulatory Landscape
Thermoform packaging regulation is increasingly shaped by recyclability and labeling mandates in Europe and food-contact safety oversight in the United States. In the EU, the Packaging and Packaging Waste Regulation, Regulation (EU) 2025/40 (PPWR), entered into force in February 2025, with general application on 12 August 2026. The update tightens requirements around packaging sustainability, design-for-recyclability, and labeling across materials used in thermoformed trays, cups, and blisters.
For food-contact materials, US requirements continue to hinge on FDA oversight under Title 21, including 21 CFR Part 177 for indirect food additives. Where recycled-content is used in food-contact thermoforms, it is typically gated by FDA process-specific assessments such as No Objection Letters for post-consumer recycled plastics. During 2026, FDA updates and communications, including Threshold of Regulation list updates and food-contact related evaluations such as those covering certain phthalates, reinforced compliance attention on authorized chemistries and recycling process controls for PCR polymers used in thermoformed packaging.
Competitive Landscape
The thermoform packaging market is fragmented. Scale plays dominate M&A headlines—Toppan’s USD 1.8 billion purchase of Sonoco’s thermoform assets deepens its North American footprint. Amcor’s all-stock merger with Berry Global forms a USD 24 billion revenue giant intent on extracting USD 650 million in annual synergies via resin pooling and shared R&D centers.
Technology differentiation is rising. Firms retrofit presses with vision-guided robotic stackers to cut labor cost per 1,000 packs by 25%. Investment in bio-resin compounding lines positions converters to meet retailer-imposed carbon ceilings. Disruptors such as Dart Container’s molded-fiber venture with PulPac claim 80% CO₂ savings, targeting quick-service clamshells.
Raw-material integration also shapes strategy. rPET sheet extruders partner with deposit-scheme operators to lock feedstock streams, insulating against pellet volatility. Patent filings on oxygen-scavenging mono-PET are climbing, signaling focus on barrier innovation that maintains recyclability without multilayer adhesives.
Thermoform Packaging Industry Leaders
Amcor PLC
Sonoco Products Company
Anchor Packaging, Inc.
Mondi Group
Smurfit WestRock
- *Disclaimer: Major Players sorted in no particular order
Thermoform Packaging Market Companies Covered in this Report
- Amcor PLC
- Sonoco Products Company
- International Paper
- Placon Corporation
- Display Pack Inc.
- Smurfit WestRock
- Tekni-Plex Inc.
- Anchor Packaging Inc.
- D&W Fine Pack
- Sealed Air Corporation
- Mondi Group
- Huhtamaki Oyj
- Pactiv Evergreen Inc.
- Fabri-Kal LLC
- Dart Container Corp.
- Sabert Corporation
- Genpak LLC
- Silgan Plastics
- Rompa Group

Market Opportunities and Future Outlook
Compliance-driven redesign under the EU PPWR, with general application from 12 August 2026, creates whitespace for suppliers that can deliver mono-material thermoforms aligned to sorting and recycling constraints while maintaining barrier and seal integrity for ready meals, dairy, and chilled foods. Commercial activity is already moving in this direction, including recycle-ready PET and PE structures and barrier solutions. Converters are also aligning around design guidance through industry initiatives such as PET thermoform recycling working groups.
Food-grade recycled resin access and regulatory acceptance remain a practical constraint, which in turn defines where adoption can accelerate. Companies that secure PCR feedstock and demonstrate compliant food-contact performance can expand higher recycled-content trays and cups, while lowering exposure to eco-modulated EPR fees and plastic taxes. Collaboration on recycled-resin integration into thermoformed packaging was highlighted publicly in 2026 by PureCycle Technologies and Toppan, pointing to continued commercialization of recycled-content formulations for thermoformed formats and adjacent flexible lidding structures. Beyond traditional food and pharma, heavy-gauge thermoforming for reusable industrial logistics, such as transport packaging uses including battery logistics trays, is also gaining attention due to durability and returnability requirements that differ from thin-wall consumer packs.
Recent Industry Developments in Thermoform Packaging Market
- March 2026: Amcor launched a lightweight UniPak 1 kg polypropylene pot for dairy, paired with a compression-molded tamper-evident lid. The product targets downgauging and material efficiency while retaining line performance, reinforcing a focus on mono-material formats that fit recyclability-driven procurement.
- October 2025: Amcor introduced AmSecure APET-based thermoformed trays and rollstock for healthcare applications. The introduction broadened its thermoformed healthcare portfolio and strengthened positioning in regulated medical packaging, where material traceability and consistent forming quality are key.
- December 2024: Toppan Holdings acquired Sonoco's Thermoformed and Flexible Packaging unit for USD 1.8 billion. The acquisition expanded Toppan's footprint in thermoformed and flexible packaging in the Americas and increased scale for sustainable-material and recycling-oriented product development.


Thermoform Packaging Market Report Scope and Research Methodology
Market Definition and Coverage
This market covers the revenues generated from thermoformed packaging, where a sheet is heated and shaped into packs used for protecting, transporting, and displaying products across industries.
Scope exclusions: We exclude non-thermoformed packaging formats (such as injection molded rigid packs, flexible laminates, and paperboard-only cartons) even if they compete for the same end uses.
Segments Covered in This Report
- By Material
- Plastic
- Paper and Paperboard
- Aluminum
- Bio-based/Biodegradable Polymers
- By Product Type
- Blisters
- Clamshells
- Trays and Lids
- Cups and Bowls
- Other Product Type
- By Packaging Thickness
- Up to 200 µm
- 200–500 µm
- Above 500 µm
- By End-user Industry
- Food and Beverage
- Pharmaceuticals and Medical
- Personal Care and Cosmetics
- Consumer Electronics
- Other End-user Industry
- By Thermoforming Technology
- Vacuum Forming
- Pressure Forming
- Mechanical Forming
- Plug-Assist Forming
- By Geography
- North America
- United States
- Canada
- Mexico
- Europe
- Germany
- United Kingdom
- France
- Italy
- Spain
- Russia
- Rest of Europe
- Asia-Pacific
- China
- India
- Japan
- South Korea
- Australia and New Zealand
- Rest of Asia-Pacific
- Middle East and Africa
- Middle East
- United Arab Emirates
- Saudi Arabia
- Turkey
- Rest of Middle East
- Africa
- South Africa
- Nigeria
- Egypt
- Rest of Africa
- Middle East
- South America
- Brazil
- Argentina
- Rest of South America
- North America
Data Sources, Market Sizing, and Validation
Desk Research
Desk research was used to build a realistic demand and supply picture before assumptions were set. We relied on public sources such as packaging and plastics industry association releases, government trade and production statistics, customs and tariff schedules for polymer resins, and peer-reviewed journals covering barrier performance and recyclability.
To ground the model in real business conditions, we also reviewed annual reports, investor presentations, and press releases from packaging converters and resin suppliers, along with reputable business news coverage of capacity additions and regulation changes. In a few places, paid subscriptions for company financials and patent databases were used to verify plant footprints and technology direction where public disclosure was thin. The desk sources listed here are illustrative, and many other public references were used for data collection, cross-checks, and clarification.
Primary Interviews and Surveys
Primary work centered on interviews and short surveys with packaging converters, raw material suppliers, machinery and tooling participants, and procurement or packaging development roles at end users (especially food and pharma). Since demand and resin pricing vary widely by region, inputs were checked across APAC, EMEA, and the Americas, and then reconciled with channel feedback to close gaps left by public data.
Distribution of primary research fieldwork respondents
| Company type | Respondent position | Region |
|---|---|---|
| Top tier: 27% | CXOs: 16% | APAC: 48% |
| Mid tier: 54% | Functional/Unit leaders: 34% | EMEA: 30% |
| Smaller Players: 19% | Managers: 50% | Americas: 22% |
Market-Sizing & Forecasting
The core sizing uses a top-down build that reconstructs thermoform packaging demand from end-use packaging intensity and production signals, followed by region-level allocation using trade, consumption, and capacity indicators. Where the model looked too high or too low, we corroborated it with selective bottom-up checks such as sampled converter revenue ranges, channel checks on volume movement, and typical ASP by format and material.
Key inputs used as market fingerprints included resin and sheet price direction (PET, PP, PS and recycled variants), mix shifts between blisters, clamshells, trays, cups, and related formats, thickness ranges that influence material consumption, adoption of vacuum versus pressure forming for specific applications, and end-market output trends in packaged foods and pharmaceuticals. When a data point was missing for smaller countries, proxies were applied using regional packaging output and import dependence, and then adjusted after expert feedback.
For forecasting, scenario analysis was used around resin price movement, recycled content adoption pace, and food and pharma packaging growth, and the selected path was then aligned to what primary respondents expected for the next few years. Assumptions were kept transparent so the forecast can be repeated when new public indicators become available.
Data Validation & Update Cycle
Each major calculation step is checked against at least one independent signal, which includes resin price trends, reported packaging output indicators, and announced capacity changes. If a region shows an unusual jump, the drivers are traced back to mix, price, or end-use changes, and then the assumptions are re-tested with follow-up calls.
Before sign-off, the model and narrative go through multi-step analyst review so arithmetic, scope alignment, and logic consistency are confirmed. The report is refreshed annually, and interim updates are triggered when material events occur, such as regulation shifts, major capacity additions, or sharp currency and feedstock swings. Right before delivery, a final data pass is completed so the view reflects the latest available information.
Mordor Intelligence's Thermoform Packaging Market Size Versus Other Published Estimates
Published market sizes for thermoform packaging do not always match, and the differences usually come from what is counted, which year is treated as the base, and how price is translated into USD. The spread can also widen when one estimate assumes a faster price pass-through from resins than what converters actually achieve.
In this study, quarterly refresh checks on resin-linked ASP movement and exchange-rate timing were used to avoid overstating value during short-lived price spikes, a step that was applied consistently by Mordor Intelligence before final totals were locked.
Benchmark comparison
| Source | Market Size | Gaps in Research Methodology |
|---|---|---|
| Mordor Intelligence | USD 49.55 B (2026) | |
| Global Consultancy A | USD 57.63 B (2026) | Often uses a higher assumed ASP level for 2026 and a quicker pass-through of resin inflation across formats, which can lift value even when unit demand is steady. |
| Industry Publisher B | USD 65.29 B (2026) | May include adjacent rigid packaging categories beyond thermoforming and applies broader regional currency conversion timing, which can inflate the USD total in volatile periods. |
The table shows that most gaps are explainable when you line up scope boundaries, the timing of currency conversion, and how ASP is carried forward from resin and mix changes. By keeping those drivers explicit and re-checking them through interviews, the estimate stays traceable to clear demand and pricing inputs that can be updated each year without changing the logic.


Key Questions Answered in the Report
What is the current value of the thermoform packaging market?
The thermoform packaging market size is USD 49.55 billion in 2026 and is projected to reach USD 61.77 billion by 2031 at a 4.51% CAGR.
Which region leads global demand?
Asia-Pacific holds 39.76% of 2025 revenue and remains the fastest-growing region at a 7.05% CAGR through 2031.
Which material segment is expanding the fastest?
Bio-based and biodegradable polymers are climbing at an 8.21% CAGR as regulations and brand sustainability targets intensify.
How are taxes affecting plastic thermoformers?
Plastic-use levies in the EU and North America inflate virgin polymer costs, pushing converters toward recycled and mono-material solutions to avoid penalties.
Why is pressure forming gaining popularity?
Pressure forming achieves finer surface detail and tighter tolerances than vacuum forming, supporting premium electronics and automotive parts, and is advancing at an 8.29% CAGR.
What impact will the Amcor–Berry merger have?
The combined entity commands USD 24 billion in revenue and targets USD 650 million in synergies, likely accelerating investment in sustainable materials and Industry 4.0 production assets.
Page last updated on:


 Your data is secure and never sold or shared.


