
Thermal Paper Market Size and Share
Market Overview
| Study Period | 2020 - 2031 |
|---|---|
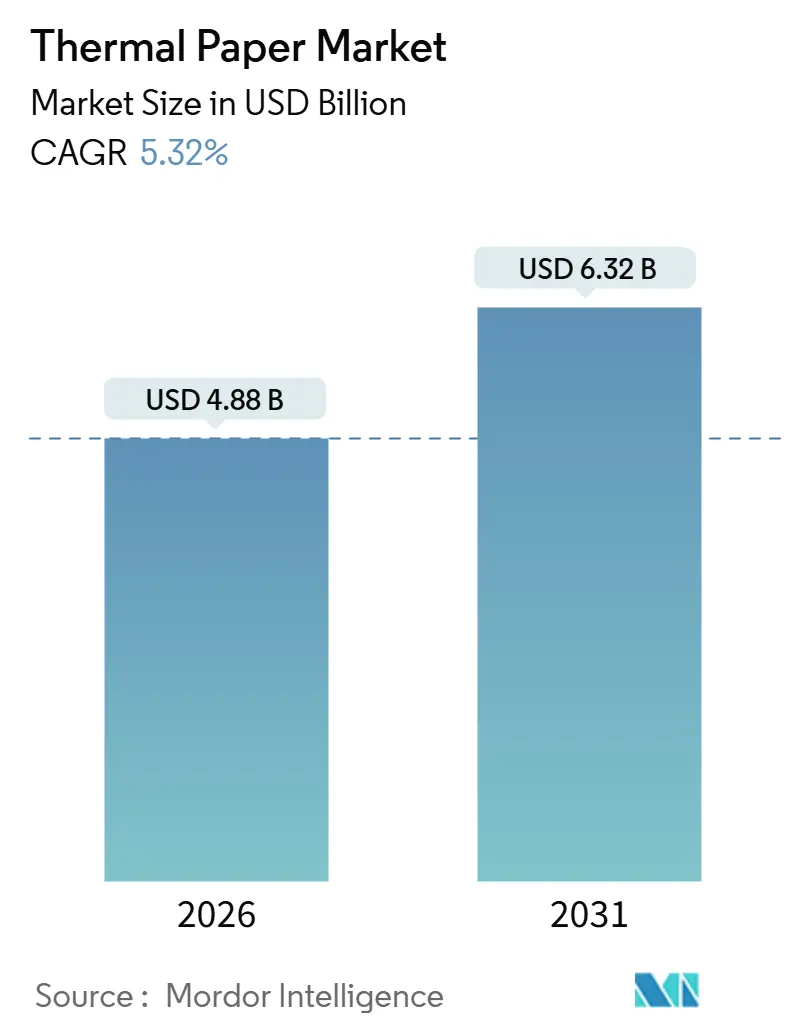
| Market Size (2026) | USD 4.88 Billion |
| Market Size (2031) | USD 6.32 Billion |
| Growth Rate (2026 - 2031) | 5.32 % |
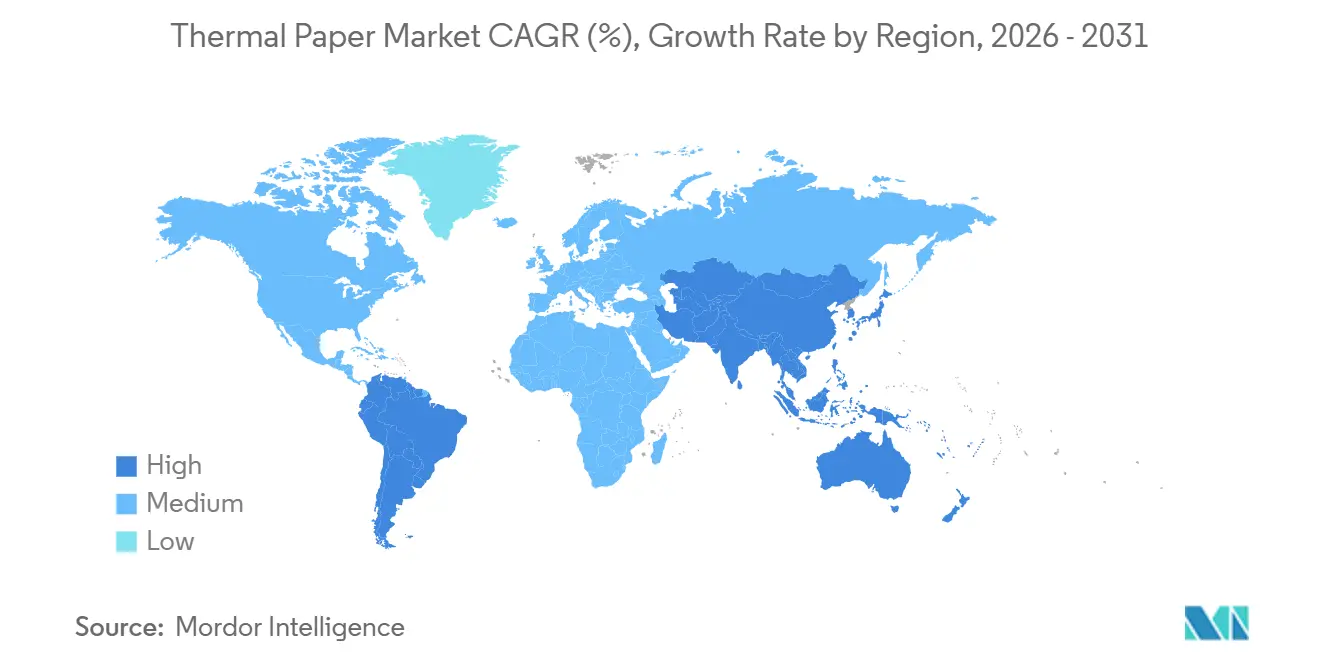
| Fastest Growing Market | South America |
| Largest Market | Asia Pacific |
| Market Concentration | Medium |
Major Players.webp) *Disclaimer: Major Players sorted in no particular order Image © Mordor Intelligence. Reuse requires attribution under CC BY 4.0. | |
Thermal Paper Market Analysis by Mordor Intelligence
The thermal paper market size reached USD 4.88 billion in 2026 and is projected to attain USD 6.32 billion by 2031, expanding at a 5.32% CAGR. Regulatory bans on bisphenol compounds are pushing mills toward phenol-free chemistries, while global serialization mandates are bolstering demand for durable, high-resolution labels. Asia-Pacific continues to anchor unit volumes thanks to accelerated adoption of electronic payments, whereas South America is adding incremental growth as retail modernization programs roll out. Europe and North America are experiencing margin compression due to pulp price swings and e-invoicing requirements, but specialty ticket and RFID-embedded grades are opening premium niches. Competitive intensity is rising as Asian producers expand capacity, yet technology-led differentiation around sensor integration, food-contact safety, and recyclability is allowing established mills to defend share.
Key Report Takeaways
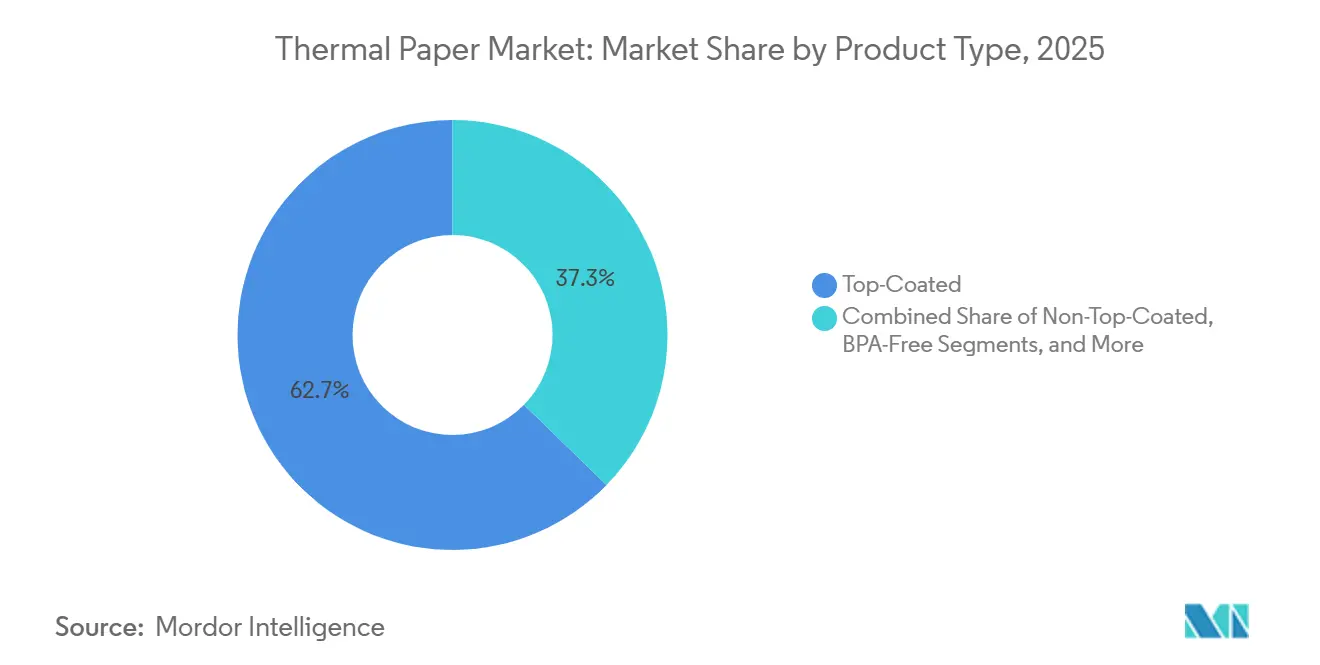
- By product type, top-coated grades led with 62.70% revenue share in 2025; BPA-free formulations are advancing at a 7.90% CAGR through 2031.
- By basis weight, ≤55 gsm captured 45.80% of the thermal paper market share in 2025, while 56-70 gsm is forecast to grow at a 6.50% CAGR to 2031.
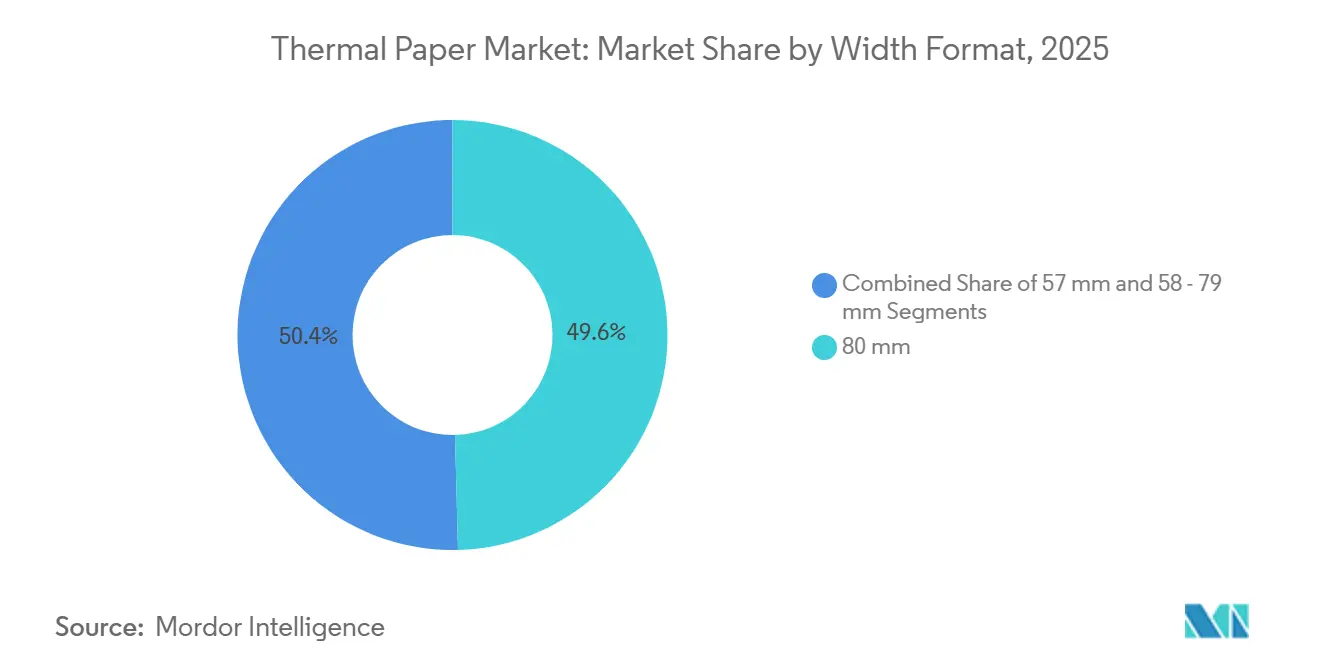
- By width format, 80 mm rolls commanded 49.60% of the thermal paper market size in 2025 and 57 mm rolls are expanding at a 6.80% CAGR to 2031.
- By end-user industry, retail accounted for 67.40% demand in 2025, while logistics is accelerating at an 8.32% CAGR through 2031.
- By geography, Asia-Pacific contributed 47.23% revenue in 2025; South America is the fastest-growing region at a 6.41% CAGR to 2031.
Note: Market size and forecast figures in this report are generated using Mordor Intelligence’s proprietary estimation framework, updated with the latest available data and insights as of January 2026.
Market Trends and Insights
Drivers Impact Analysis of Thermal Paper Market*
| Driver | (~) % Impact on CAGR Forecast | Geographic Relevance | Impact Timeline |
|---|---|---|---|
| Retail-POS Expansion in Emerging Economies | +1.2% | Asia-Pacific core, spill-over to South America and the Middle East | Medium term (2-4 years) |
| Growth of Logistics and E-commerce Label Demand | +1.5% | Global, concentrated in North America, Europe, and the Asia-Pacific | Long term (≥ 4 years) |
| Mandatory Pharma Serialization and Cold-Chain Labeling | +0.9% | North America and Europe, expanding to the Asia-Pacific | Medium term (2-4 years) |
| Shift to BPA-Free and Phenol-Free Formulations | +1.1% | Europe and North America, regulatory spill-over to the Asia-Pacific | Short term (≤ 2 years) |
| Integration of RFID-Embedded Smart Thermal Tags | +0.6% | North America and Europe, pilot deployments in the Asia-Pacific | Long term (≥ 4 years) |
| Temperature-Indicating (TTI) Ticket Innovation | +0.4% | Global, early adoption in the pharmaceutical and food cold-chain | Medium term (2-4 years) |
| Source: Mordor Intelligence | |||
Retail-POS Expansion In Emerging Economies
Rapid growth in electronic-payment ecosystems is stimulating fresh hardware installations and recurring roll consumption. India’s installed base rose to 11.2 million terminals by January 2025, a 29% jump that paralleled a surge in QR-based transactions, yet printed receipts remain mandatory for goods-and-services tax compliance[1]Source: Reserve Bank of India, “Payment System Indicators,” rbi.org.in. Similar patterns in Indonesia, Vietnam, and the Gulf Cooperation Council are locking in high-volume orders for low-cost grades even as digital channels proliferate. Equipment vendors bundling receipt rolls with service contracts are reinforcing mill-converter relationships, and subsidies for small-merchant onboarding amplify incremental tonnage. Consequently, the thermal paper market is witnessing channel diversification into micro-merchant segments that historically relied on handwritten invoices.
Growth Of Logistics And E-commerce Label Demand
Fulfillment centers are scaling label consumption faster than retail receipts as parcel throughput rises. Warehouse-automation outlays are forecast to lift global spend from USD 26.5 billion in 2024 to USD 116 billion by 2034, translating into exponential printer deployments per facility. GS1’s roadmap to migrate from 1-D to 2-D codes by 2031 necessitates tighter coating uniformity and higher image resolution. Label failure penalties in last-mile operations incentivize converters to specify mid-range 56-70 gsm grades with robust top coats, steering revenue toward mills capable of consistent caliper control. The logistics pull, combined with e-grocery expansion, is turning the segment into the primary growth engine of the thermal paper market.
Mandatory Pharma Serialization And Cold-Chain Labeling
The U.S. FDA’s Drug Supply Chain Security Act now obliges unit-level identifiers that withstand freeze-thaw cycles and multiple scans. Europe’s analogous Falsified Medicines Directive extends comparable obligations. Labels must resist condensation and sub-zero temperatures, prompting pharmaceutical packagers to adopt phenol-free, top-coated stocks validated for −30 °C performance. GS1 EPCIS 2.0 further boosts demand for sensor-enabled stickers that pair with blockchain ledgers, enhancing traceability. Mills offering low-migration developers and anti-curl bases are securing long-term supply agreements with contract packagers.
Shift To BPA-Free And Phenol-Free Formulations
European Regulation 2024/3190 bans bisphenol A in food-contact substrates from January 2025, triggering global brand audits. Retailers wary of litigation under California Proposition 65 are replacing legacy grades. Appvion’s “no added phenols” platform and Mitsubishi HiTec’s certified THERMOSCRIPT lines are gaining traction, commanding 10-15% price premiums. Although initial changeover costs challenge small converters, risk mitigation and corporate sustainability agendas outweigh the financial burden, accelerating a structural pivot across the thermal paper industry.
Restraints Impact Analysis of Thermal Paper Market*
| Restraint | (~) % Impact on CAGR Forecast | Geographic Relevance | Impact Timeline |
|---|---|---|---|
| Volatile Pulp and Leuco-Dye Input Prices | −0.8% | Global, acute in Europe and North America | Short term (≤ 2 years) |
| Digital Receipts and E-Invoicing Uptake | −1.0% | Europe and North America, expanding to the Asia-Pacific | Medium term (2-4 years) |
| Regulatory Scrutiny on Bisphenol Chemicals | −0.5% | Europe and North America, spill-over to the Asia-Pacific | Short term (≤ 2 years) |
| EU Carbon-Border Taxes on Asian Thermal Rolls | −0.3% | Europe, impacting Asian exporters | Medium term (2-4 years) |
| Source: Mordor Intelligence | |||
Volatile Pulp And Leuco-Dye Input Prices
Producer price indices for wood pulp hit 213.2 in November 2025, while converted-paper indices climbed even higher, squeezing downstream profitability. Specialty leuco dyes depend on metal catalysts now subject to Chinese export curbs, amplifying chemical cost spikes. European mills confronted by elevated energy tariffs and tighter emission caps face the sharpest margin erosion. Hedging strategies and backward-integration into pulp have become critical, yet small and mid-sized players lack scale, accelerating consolidation within the thermal paper market.
Digital Receipts And E-Invoicing Uptake
Governments across the European Economic Area and the United Kingdom have scheduled mandatory electronic VAT invoicing before 2030, signaling a structural decline in low-margin receipt rolls[2]Source: UK Government, “Making Tax Digital for VAT,” gov.uk. Financial institutions and big-box retailers now default to emailed proof of purchase, citing 60-80% cost savings and sustainability goals. Although emerging economies still mandate paper trails, the trajectory is clear: mature markets will see secular volume attrition. Mills are offsetting the erosion by pivoting toward logistics and smart-label applications, but the headwind remains material to overall demand curves.
*Our forecasts treat driver/restraint impacts as directional, not additive. The impact forecasts reflect baseline growth, mix effects, and variable interactions.
Thermal Paper Market Segment Analysis
By Product Type:
Phenol-Free Grades Expand Premium TiersTop-coated variants dominated 2025 revenue, a reflection of stringent print-quality needs at checkout counters. BPA-free lines, however, are achieving a 7.90% growth clip as leading retailers align with food-contact legislation in Europe and California. Phenol-free technology from Appvion and Mitsubishi HiTec is carving premium shelf space, supported by ISEGA and FDA food-safety validations. Specialty security grades employ ultraviolet fibers and tamper indicators favored by lotteries and ticketing bodies, retaining niche demand even as commoditized non-top-coated stock loses share. The thermal paper market size for phenol-free sub-segments is expected to scale steadily through 2031 as additional jurisdictions copy EU norms.
Competitive positioning is bifurcating as integrated pulp-to-paper majors capitalize on chemistry know-how to certify safer products, whereas converters relying on third-party jumbo rolls risk customer churn. Elevated certification fees, though significant, grant early movers defensible advantages, allowing them to negotiate multi-year contracts with global quick-service-restaurant chains keen on chemical-compliant supplies.


By Basis Weight:
Mid-Range Grades Balance Cost And Durability≤55 gsm rolls continue to drive volumes in grocery and discount retail because reduced basis cuts direct material outlay and extends printer uptime. However, order books show a migration toward 56-70 gsm material in omnichannel fulfillment centers, where mechanical handling demands tear resistance and barcode clarity. The thermal paper market share of this mid-weight band will keep rising as shippers standardize on thicker substrates that lower mis-sort incidents. GS1 surveys reveal weekly readability failures in 70% of warehouses, prompting procurement teams to prioritize robust coatings.
Above-70 gsm super-durable grades remain indispensable in container-terminal stickers and airline baggage tags. Mitsubishi’s linerless LL 77 series exemplifies how heavier constructions can offset adhesive costs while eliminating siliconized liners, boosting sustainability credentials. For mills, elasticity in caliper and moisture control across a wide weight span offers an avenue to deepen wallet share among converters seeking a single supplier for multiple label classes within the thermal paper market.
By Width Format:
Compact Rolls Gain Traction In Transit And ParkingThe 80 mm width remains the workhorse of retail printing but its proportional dominance is edging downward as urban infrastructures shift toward compact devices. Bus validators, parking meters, and handheld restaurant order tablets increasingly specify 57 mm rolls to minimize cabinet depth, and India’s UPI-driven micro-merchant readers mirror that preference. Consequently, mills with multi-width slitters can maximize uptime by flipping between 57 mm and 80 mm master rolls, a flexibility smaller plants lack.
Meanwhile, intermediate 58-79 mm formats are losing favor, prompting rationalization of SKUs in converter catalogs. Retailers consolidating hardware fleets exploit volume rebates by standardizing paper width, squeezing margins for any supplier unable to match the dominant form factors. The thermal paper market size attached to 57 mm rolls is growing off a lower base but will capture a rising portion of incremental unit sales through 2031.
By End-User Industry:
Logistics Outpaces Retail GrowthRetail still delivered 67.40% of total demand in 2025, yet its trajectory is flattening under the twin pressures of e-receipt programs and omnichannel blending. Logistics, on the other hand, is compounding at 8.32% thanks to escalating e-commerce penetration, which topped 15.9% of U.S. retail sales in late-2024. Serialized cold-chain labels mandated by the FDA intensify material specification complexity, ratcheting up margins for compliant suppliers. Banking, previously a stable outlet for ATM journal rolls, is contracting fastest as mobile deposits and cardless withdrawals reduce paper output.
Ticketing and gaming applications preserve steady volumes because regulators often demand auditable proof of play, but rising adoption of mobile wallets is beginning to nip at this base. Overall, end-user mix is tilting toward sectors where package tracking and environmental resilience matter, reinforcing the premiumization drift within the thermal paper industry.
Geography Analysis
APAC Thermal Paper Market
Asia-Pacific retained a commanding 47.23% revenue slice in 2025. India’s surging POS footprint and China’s vertically integrated supply chain anchor scale economics, while Japan and South Korea absorb high-spec pharma and electronics grades. Government programs that incentivize digital but printable proof of purchase preserve baseline consumption even as fintech apps spread. Australia and New Zealand pursue sustainability goals that favor recycled fibers, yet volume attrition is mitigated by tourism-related kiosk printing.
South America Thermal Paper Market
South America is the fastest climber, clocking a 6.41% CAGR through 2031 as Brazil and Argentina transition from cash to card-plus-QR ecosystems. Mandated electronic invoicing complements, not cannibalizes, thermal label usage because outbound parcels still require adhesive identifiers. Domestic mills hedge freight volatility, but Asian imports remain competitive on pure cost, pressuring local producers to focus on service agility.
Europe Thermal Paper Market
Europe’s outlook is more muted. The bisphenol-A prohibition effective 2025 catalyzed costly reformulation across the continent, while pulp input volatility and stringent recyclability rules weigh on profitability. Germany hosts two of the largest phenol-free lines worldwide, maintaining a technology edge. The United Kingdom’s 2029 electronic VAT schema forebodes further decline in receipt volumes, though logistics hubs around Rotterdam and Antwerp continue to soak up label stocks.
North America Thermal Paper Market
North America mixes maturity with innovation. FDA serialization is driving pharmaceutical label upgrades, and e-commerce keeps parcel sticker volumes buoyant. Yet retail divisions are piloting QR-code-only receipts delivered via SMS, trimming downstream roll orders. Supply-chain localization inside Mexico is injecting fresh converter investments to serve nearshoring factories.
MEA and Turkey Thermal Paper Market
The Middle East and Africa remain nascent but promising. Gulf Cooperation Council states invest in smart-city transit systems requiring compact 57 mm tickets, and Turkey’s export-oriented mills leverage proximity to Europe. Sub-Saharan Africa faces import-duty complexities, but mobile-money kiosks are seeding grass-roots demand that will compound as infrastructure solidifies.

Regulatory Landscape
Regulation of thermal paper continues to tighten around bisphenols and food-contact safety, accelerating reformulation toward BPA-free and phenol-free chemistries. In the European Union, REACH restrictions (Regulation (EU) 2016/2235 amending REACH) prohibit placing thermal paper on the market with BPA at or above 0.02% by weight, in force since January 2, 2020, and this stance continues to shape global retailer specifications and audits.
In the United States, food-contact compliance for paper and paperboard components is governed through FDA frameworks such as 21 CFR 176.170 and 21 CFR 176.180, which reinforce authorization and suitability requirements for substances used in materials that contact food. State-level actions add further momentum, including Washington State restrictions effective January 1, 2026 that prohibit manufacture, sale, or distribution of thermal paper containing bisphenols (including BPA and BPS), while California Proposition 65 warning risk continues to influence procurement decisions in retail and hospitality supply chains.
Value Chain Analysis
The thermal paper value chain runs from fiber and chemical inputs through paper production and downstream conversion, with cost and compliance centered on pulp and specialty coating chemistry. Upstream, mills secure virgin or recycled pulp, or integrated pulp supply where available, while coating formulators provide leuco dyes, sensitizers, and color developers that shape image quality, durability, and regulatory fit. Volatility and availability constraints in pulp and key coating chemicals, including leuco dyes, can extend lead times and trigger price actions that move through the chain.
Midstream, producers manufacture base paper and apply thermal coatings (often with top coats for abrasion and moisture resistance), then slit, rewind, and convert jumbo rolls into POS rolls, labels, tickets, and other formats through converters and distributors. Downstream demand is influenced by printer OEM qualification and application testing, so compatibility certifications and multi-year supply agreements with large retail, logistics, and pharmaceutical packagers become important routing mechanisms for volume. Vertical integration in pulp or tighter partnerships between mills, chemical suppliers, and POS and label printer ecosystems provide leverage against input swings and help speed transitions to BPA-free and phenol-free grades.
Competitive Landscape
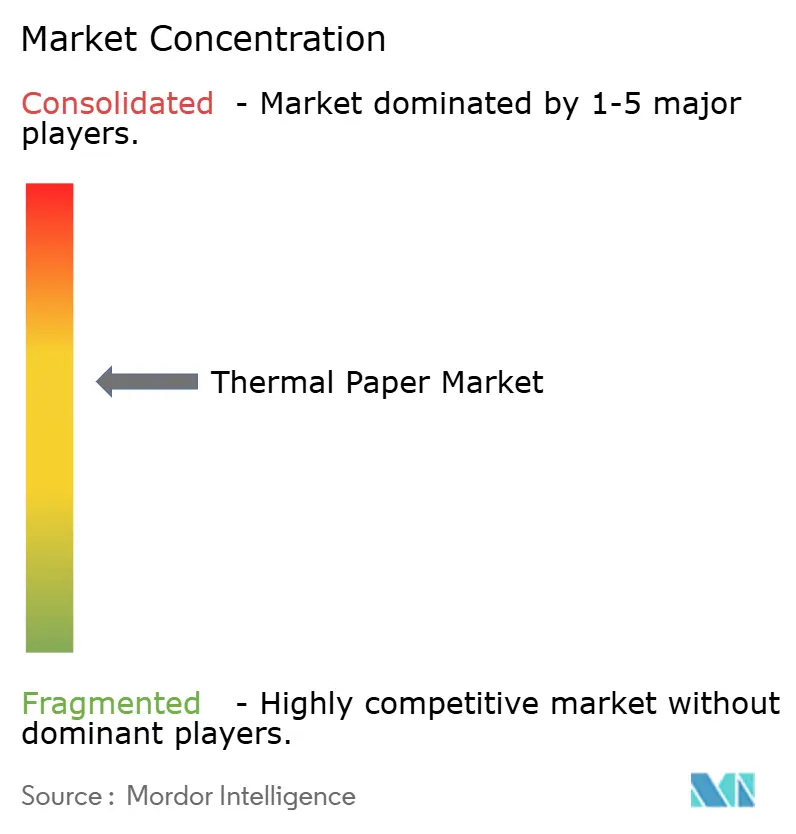
Industry structure is moderately fragmented. The five largest suppliers account for just under 60% of global output, bestowing a market concentration score of 6. Oji Holdings’ FY 2024 thermal revenue of JPY 236,376 million (USD 1,590 million) displayed resilience amid raw-material gyrations[3]Source: Oji Holdings Corporation, “Financial Results FY 2024,” ojiholdings.co.jp . Koehler Paper and Mitsubishi HiTec leverage European bases to secure rapid certification updates, while Asian contenders such as Chenming and Hansol exploit lower feedstock pricing.
Strategic maneuvers emphasize safer chemistries and smart-label convergence. Appvion’s “no-added-phenols” launch pre-empted regulatory shifts and unlocked pharmaceutical accounts. Mitsubishi HiTec’s linerless LL 77 illustrates product diversification that aligns with carbon-reduction goals. Several mills are piloting RFID-embedded substrates compatible with GS1 EPCIS 2.0, targeting cold-chain transparency. M&A talk centers on horizontal roll-converter acquisitions that give producers captive downstream channels. Cost headwinds from pulp and energy are accelerating automation projects in coating and slitting lines to protect margins.
Supply-risk mitigation is another theme. European buyers seek dual sourcing outside China for leuco dyes, encouraging Japanese and U.S. chemical firms to scale alternate synthesis pathways. Mills with forward pulp contracts and integrated kraft assets can cushion price spikes, giving them pricing power when negotiating long-term delivery programs with mass-merchandisers and third-party logistics providers.
Thermal Paper Industry Leaders
Ricoh Company, Ltd.
Appvion, LLC.
Koehler Paper SE
Hansol Paper Co., Ltd
Thermal Solutions International, Inc.
- *Disclaimer: Major Players sorted in no particular order
Thermal Paper Market Companies Covered in this Report
- Oji Holdings Corporation
- Koehler Paper SE
- Ricoh Company Ltd.
- Appvion LLC
- Mitsubishi HiTec Paper Europe GmbH
- Hansol Paper Co. Ltd.
- Kanzaki Specialty Papers Inc.
- Jujo Thermal Ltd.
- Iconex LLC
- Twin Rivers Paper Company Inc.
- Thermal Solutions International Inc.
- Henan JiangHE Paper Co. Ltd.
- Rotolificio Bergamasco SRL
- Bizerba SE and Co. KG
- Paper Rolls Plus
- Panda Paper Roll
- Telemark Diversified Graphics
- Nakagawa Mfg (USA) Inc.
- Shenzhen Shen Paper Co.
- Jiangsu Wampolet Paper Co.

Market Opportunities and Future Outlook
Compliance-driven reformulation and capacity investments are creating whitespace in premium, safer chemistries and in high-performance label applications linked to logistics and regulated packaging. A clear commercial signal emerged in April 2026 when OSP Holdings launched Treeloop Thermal, positioned as phenol-free (no BPA/BPS) thermal paper using biomass-derived color developers upcycled from kraft lignin waste, pointing to bio-based developer systems moving from concept to broader product portfolios. Academic work published in 2026 also validated alternative developer and sensitizer approaches using lignocellulosic biomass fractions, supporting further development paths for low-migration and bisphenol-free solutions where retailer and food-contact scrutiny is high.
On the supply side, additional thermal base paper capacity and upstream integration efforts are reshaping sourcing options for converters. In May 2026, APP started up PM 6 at the Jindong Dagang mill in Zhenjiang, China, a high-speed machine designed for 120,000 tons per year of thermal base paper and MG grades, expanding availability of base paper for downstream coating and conversion. Separately, Wuzhou Special Paper selected ANDRITZ in March 2026 for a new greenfield pulp mill in Hukou County, China, highlighting ongoing moves to improve pulp self-sufficiency and reduce exposure to external pulp markets. Together, these steps can support more stable supply programs for POS rolls and label grades under continued input-cost volatility.
Recent Industry Developments in Thermal Paper Market
- June 2026: Koehler Paper announced an 8% price increase for thermal paper in selected markets, effective July 1, 2026, citing higher costs for raw materials, energy, and logistics. The increase underscores continued inflation in pulp and coating-chemical inputs and pushes converters and large buyers toward renegotiations and index-linked supply terms.
- March 2026: Koehler Paper announced a global 10% price increase on all POS and label thermal paper effective April 1, 2026. The broad-based hike highlights how cost pressure is affecting both receipt and label grades, reinforcing the value of supplier scale, forward purchasing, and formulation flexibility for buyers managing compliance transitions.
- September 2024: Ricoh used Labelexpo Americas 2024 to highlight its direct thermal media portfolio for label applications. The focus on label-grade performance and application breadth aligns with the market shift toward logistics and traceability labels, where print durability and scanner readability affect purchasing decisions.


Thermal Paper Market Report Scope and Research Methodology
Market Definition and Coverage
For this study, the market covers thermal paper that is coated and converted for thermal printing, and it is used mainly in receipts, labels, tickets, and similar printed outputs across end-use industries.
Scope exclusions: We exclude printers and printheads, thermal transfer ribbons, and non-thermal paper grades that do not require heat-sensitive coating chemistry.
Segments Covered in This Report
- By Product Type
- Top-Coated
- Non-Top-Coated
- BPA-Free
- Phenol-Free
- Specialty Color and Security Grades
- By Basis Weight
- Equal to 55 gsm
- 56 - 70 gsm
- Above 70 gsm
- By Width Format
- 57 mm
- 58 - 79 mm
- 80 mm
- By End-User Industry
- Retail
- Logistics
- Ticketing, Lottery and Gaming
- Banking and Financial
- Medical and Pharmaceutical
- Parking and Transit
- Other End-User Industry
- By Geography
- North America
- United States
- Canada
- Mexico
- Europe
- Germany
- United Kingdom
- France
- Italy
- Spain
- Russia
- Rest of Europe
- Asia-Pacific
- China
- Japan
- India
- South Korea
- Australia
- Rest of Asia-Pacific
- Middle East
- Saudi Arabia
- United Arab Emirates
- Turkey
- Rest of Middle East
- Africa
- South Africa
- Nigeria
- Rest of Africa
- South America
- Brazil
- Argentina
- Rest of South America
- North America
Data Sources, Market Sizing, and Validation
Desk Research
We started by mapping the demand pool for thermal paper using public indicators that show where consumption happens and how it is changing. Useful inputs came from sources such as U.S. Census Bureau manufacturing and trade tables, UN Comtrade flows for coated paper and related grades, Eurostat industrial statistics, and International Energy Agency data for packaging and logistics activity signals. We also reviewed open regulatory and safety references, including European Chemicals Agency pages on restrictions that affect BPA and other developer chemistry, since these rules shape product shifts and pricing.
Next, we connected these macro signals to industry-level facts from annual reports and investor presentations of paper and specialty chemical companies. We supplemented this with association updates and reputed press coverage on retail POS trends, ticketing volumes, and e-commerce parcel growth. Where public sources were too broad, we used paid subscriptions for company financials and intelligence, an import and export shipment-level database for selected trade validation, and patent databases to sense the pace of chemistry change. The desk sources listed above are illustrative, and many other references were used to compile data, validate assumptions, and clarify open questions.
Primary Interviews and Surveys
We then validated the sizing logic through interviews and structured surveys with a mix of paper manufacturers, converters, distributors, and large end users including retail and logistics operations. Because this is a global market, our outreach was balanced across the main producing and consuming regions so regional pricing, substitution to linerless and label formats, and regulatory driven grade changes could be checked. These discussions helped us confirm realistic price ranges, the pace of BPA-free migration, and how demand differs between receipt-heavy and label-heavy applications.
Distribution of primary research fieldwork respondents
| Company type | Respondent position | Region |
|---|---|---|
| Top tier: 34% | CXOs: 12% | APAC: 51% |
| Mid tier: 51% | Functional/Unit leaders: 42% | EMEA: 30% |
| Smaller Players: 15% | Managers: 46% | Americas: 19% |
Market-Sizing & Forecasting
Our sizing starts with a top-down demand reconstruction that links thermal paper consumption to end-use printing activity, followed by regional price normalization. In practice, we build a demand pool from receipt and label printing intensity by sector, and then translate it into value using application-weighted average selling prices that reflect grade mix shifts.
Inputs that typically move the model include the share of transactions still printed as receipts, e-commerce and parcel shipment growth (which influences label usage), the adoption rate of phenol-free and BPA-free grades where regulations tighten, pulp and coating chemical cost trends that pass through into pricing, and width and basis-weight preferences that affect yield and conversion economics. These variables are reviewed by region so Asia-Pacific volume growth, Europe regulation effects, and Americas retail patterns are kept separate rather than blended into one average.
Forecasts are produced using scenario analysis, where expected changes in printed receipt penetration, label demand from logistics, and price progression are combined into a base case and stress-tested. The totals are corroborated with selective bottom-up approximations, such as sampled converter volumes multiplied by observed price bands, and distributor channel checks in regions where manufacturer disclosures are limited. When there are data gaps, we use conservative interpolation and expert-confirmed utilization ranges.
Data Validation & Update Cycle
We validate outputs by cross-checking regional totals against independent signals, such as trade balances for relevant coated paper flows, the pace of regulatory deadlines that force grade changeovers, and reported capacity or downtime commentary from public company disclosures. When a variance looks unusual, the inputs are re-checked, sensitivities are rerun, and follow-up calls are triggered to confirm whether the shift is real or a data artifact.
Before sign-off, the model and assumptions go through more than one analyst review so unit math, currency conversions, and price-volume logic stay consistent across years. Reports are refreshed annually, and interim updates are made when material events occur, such as a major regulatory change, capacity additions or closures, or a sharp raw material price move. Right before delivery, we do a fresh pass on key variables so clients receive the latest updated view.
Mordor Intelligence's Thermal Paper Market Size Compared Against Other Published Estimates
Published market values for thermal paper often do not match because the product boundary and the pricing logic are not consistent across sources, and the update timing can also differ. Differences usually show up when one estimate mixes in adjacent grades, or when average prices are carried forward without reflecting grade shifts like BPA-free migration.
The benchmark table shows a spread that is mostly explained by what gets counted as thermal paper and how receipts versus labels are priced over time. In Mordor Intelligence's model, only thermal-printable paper and related converted formats are included, with printers, ribbons, and non-thermal coated paper kept out, so the value stays tied to the actual consumable demand pool.
Benchmark comparison
| Source | Market Size | Gaps in Research Methodology |
|---|---|---|
| Mordor Intelligence | USD 4.88 B (2026) | |
| Trade Journal A | USD 5.16 B (2025) | Uses a nearer-term year and may apply a broader application basket, where receipt paper and label stock are valued with a single blended price and limited adjustment for BPA-free grade premiums by region. |
| Industry Report B | USD 3.60 B (2025) | Focuses on thermal paper rolls and can exclude label and ticket formats, and the value can be understated when conversion and coated grade mix are not fully reflected in average selling prices. |
Looking across the three figures, the main reason for the gap is whether the scope is the full thermal paper demand pool across receipt, label, and ticket use, or only a narrower roll subset, and then how price and grade mix are carried through the forecast years. By tying value to clear activity drivers and checking price bands region by region, the resulting market size stays easier to reproduce and to audit when assumptions change.


Key Questions Answered in the Report
How fast is demand for logistics labels growing within the thermal paper market?
The logistics segment is expanding at an 8.32% CAGR through 2031, outpacing retail and driven by warehouse automation and e-commerce fulfillment volumes.
Which regulations are most affecting chemical formulations in thermal receipt papers?
European Regulation 2024/3190 bans bisphenol A in food-contact papers from 2025, prompting global conversion to phenol-free and BPA-free chemistries.
Why is South America the fastest-growing geography for thermal paper?
Retail modernization and rapid adoption of digital payments in Brazil and Argentina are boosting point-of-sale hardware rollouts, delivering a 6.41% regional CAGR to 2031.
What product segment commands the largest thermal paper market share?
Top-coated grades held 62.70% revenue share in 2025 due to their dominance in retail point-of-sale printing.
Page last updated on:


 Your data is secure and never sold or shared.


