
Thermal Barrier Coatings Market Size and Share
Market Overview
| Study Period | 2020 - 2031 |
|---|---|
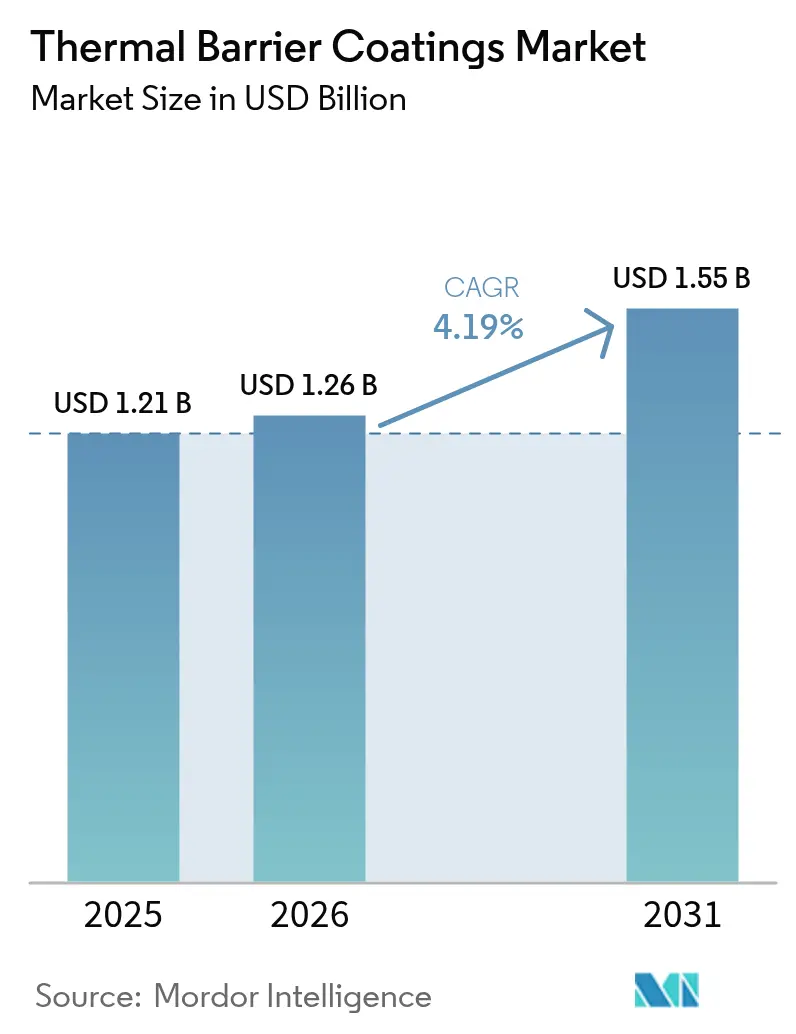
| Market Size (2026) | USD 1.26 Billion |
| Market Size (2031) | USD 1.55 Billion |
| Growth Rate (2026 - 2031) | 4.19 % |
| Fastest Growing Market | Asia-Pacific |
| Largest Market | Asia Pacific |
| Market Concentration | Medium |
Major Players *Disclaimer: Major Players sorted in no particular order Image © Mordor Intelligence. Reuse requires attribution under CC BY 4.0. | |
Thermal Barrier Coatings Market Analysis by Mordor Intelligence
Thermal Barrier Coatings market size in 2026 is estimated at USD 1.26 billion, growing from 2025 value of USD 1.21 billion with 2031 projections showing USD 1.55 billion, growing at 4.19% CAGR over 2026-2031. Sustained demand stems from hotter‐running gas turbines, weight-sensitive aerospace engines, and new hypersonic platforms that all rely on advanced ceramic-metal stacks for reliable insulation. Greater fuel-efficiency targets in commercial aviation, the need to curb CO₂ from industrial power generation, and persistent investments in ultra-high temperature research programs underpin the upward curve of the thermal barrier coatings market. Competitive intensity is shaped by mid-sized fragmentation as legacy suppliers introduce smart-spray factories while newer entrants chase niche, low-volume applications. Meanwhile, supply chain resilience for yttria-stabilized zirconia and rare-earth stabilizers remains a strategic priority after a multi-year run of price volatility.
Key Report Takeaways
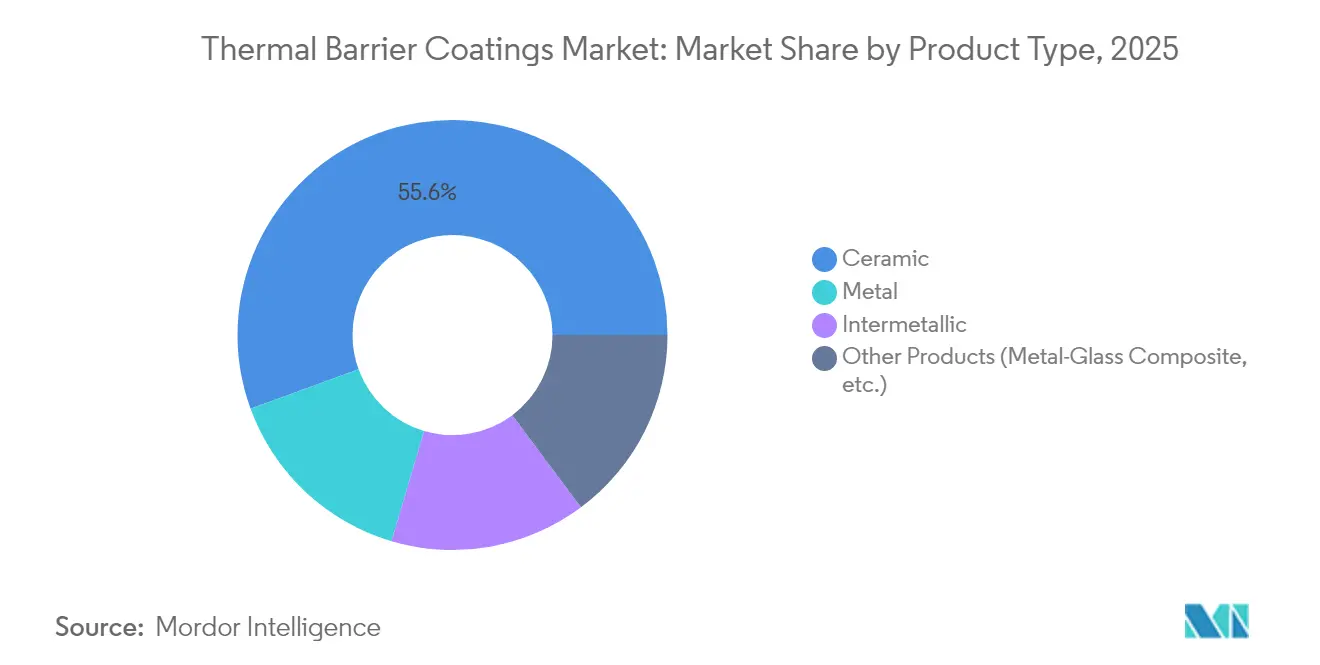
- By product type, ceramic top coats led with 55.58% of the thermal barrier coatings market share in 2025, while metal bond coats are projected to rise at a 5.74% CAGR through 2031.
- By coating technology, air plasma spray captured 41.20% revenue share in 2025; plasma spray-PVD is poised for the fastest growth at 5.33% CAGR to 2031.
- By coating material, yttria-stabilized zirconia accounted for 61.55% share of the thermal barrier coatings market size in 2025, whereas rare-earth zirconates show the strongest outlook at a 5.82% CAGR.
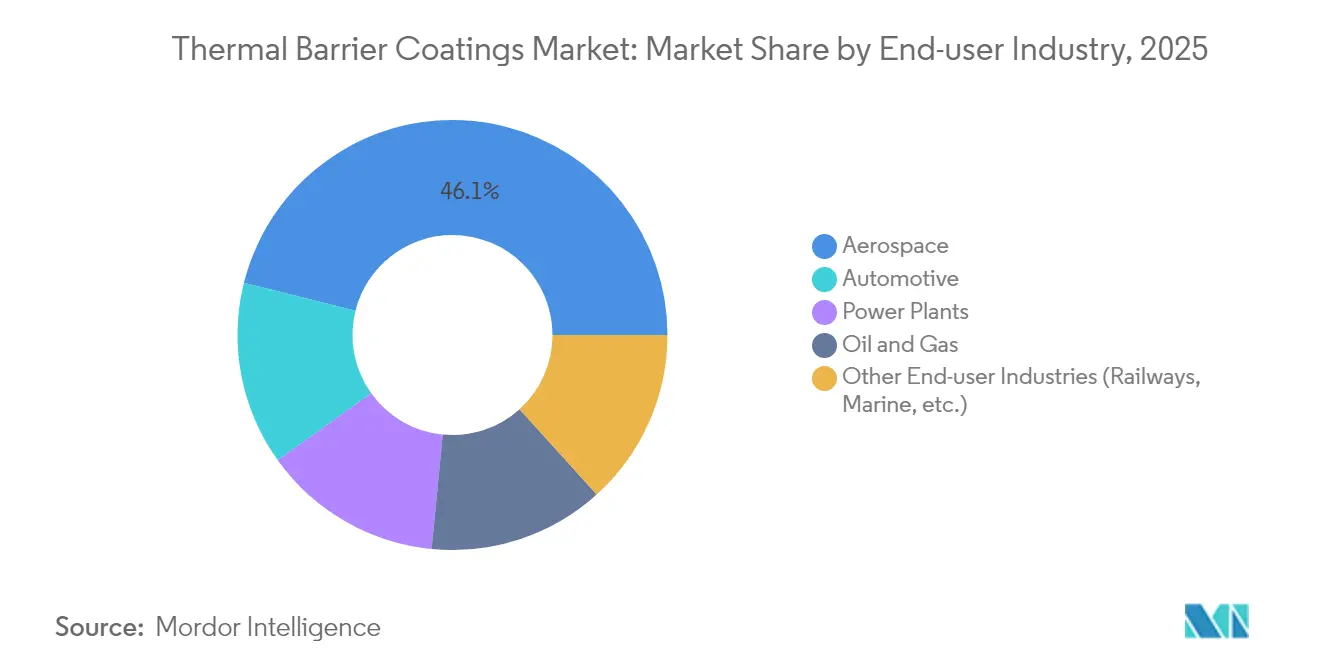
- By end-user industry, aerospace held 46.10% share in 2025 and the automotive segment is advancing at a 6.78% CAGR to 2031.
- By geography, Asia-Pacific owned 34.90% of the thermal barrier coatings market size in 2025; the region also leads growth momentum with a 4.98% CAGR through 2031.
Note: Market size and forecast figures in this report are generated using Mordor Intelligence’s proprietary estimation framework, updated with the latest available data and insights as of 2026.
Market Trends and Insights
Drivers Impact Analysis of Thermal Barrier Coatings Market*
| Driver | (~) % Impact on CAGR Forecast | Geographic Relevance | Impact Timeline |
|---|---|---|---|
| Higher aerospace engine temperatures | +1.2% | North America, Europe | Medium term (2-4 years) |
| Industrial gas-turbine build-out | +1.0% | Asia-Pacific, Middle East & Africa | Long term (≥ 4 years) |
| Automotive efficiency programs | +0.8% | Global, early Europe & North America | Short term (≤ 2 years) |
| Hypersonic vehicle R&D | +0.6% | North America, Europe | Long term (≥ 4 years) |
| Expansion in marine and defense fleets | +0.4% | Global naval powers | Medium term (2-4 years) |
| Source: Mordor Intelligence | |||
Increasing Demand from Aerospace Engines
Next-generation turbofan cores now burn near 1,650 °C, forcing turbine hot sections to adopt multi-layer ceramics that can survive intense thermal cycling. Rare-earth zirconates deliver lower lattice thermal conductivity than conventional 8YSZ, prompting new patents in double-layer architectures that keep metal temperatures below critical thresholds[1]. GE Aerospace earmarked USD 1 billion in 2025 for ceramic matrix composites and allied coatings, signaling that fuel-neutral propulsion hinges on robust thermal management. Sustainable aviation fuels add complexity because new flame chemistries alter heat flux in combustors, raising the value of smart coatings with in-situ health sensors.
Rising Installation of Industrial Gas Turbines
Combined-cycle plants in China, India, and the Gulf are running at >1,500 °C to chase mid-fifties thermal efficiency, so inlet air cooling and hydrogen-capable combustors are sharpening the focus on strain-tolerant coatings. Every percentage point of turbine firing-temperature gain trims fuel cost, which propels the thermal barrier coatings market as utilities modernize fleets to stabilize grids dominated by renewables. Vendors now field functionally graded stacks that dampen thermal shock when ramping from idle to full load in under ten minutes.
Efficiency Push in High-Performance Automotive and Motorsport Engines
Motorsport laboratories have proved that thin ceramic linings cut piston crown heat rejection, enabling OEMs to downsize radiators without breaching NOx limits. Piston-ring TiSiCN nanocomposites also show lower friction, unlocking measurable fuel-economy gains in test cycles[2]. As mainstream hybrids and battery-electric vehicles adopt higher-voltage power electronics, localized hot spots demand similar barrier solutions to safeguard silicon carbide inverters and extend battery life.
Hypersonic Vehicle Thermal-Protection R&D Programs
Mach-5 plus flight pushes leading-edge temperatures to 2,000 °C, a realm where hafnium carbide or zirconium diboride paint-like films are mandatory. The U.S. Air Force awarded Canopy Aerospace USD 2.8 million in 2024 to mature transpiration-cooled panels that bleed fluid through porous ceramics for active shielding. Optical-fiber networks embedded in the coat now relay real-time strain and heat-flux data, guiding design refinements for repeatable re-entry cycles.
Restraints Impact Analysis of Thermal Barrier Coatings Market*
| Restraint | (~) % Impact on CAGR Forecast | Geographic Relevance | Impact Timeline |
|---|---|---|---|
| Volatile zirconia and rare-earth costs | -0.8% | Global importers | Short term (≤ 2 years) |
| Stricter plasma-spray emission limits | -0.5% | Europe, North America, spreading in Asia | Medium term (2-4 years) |
| Emergence of alternate materials | -0.3% | Global | Long term (≥ 4 years) |
| Source: Mordor Intelligence | |||
Volatile Prices of Zirconia and Rare-Earth Stabilizers
Global zircon sand output slipped by 28% during 2020 and has not fully recovered, exposing coat producers to price spikes that erode margin[3]. Yttrium remains heavily concentrated in Chinese mines, where output reached only 45 t in 2022 against nameplate capacity of 1,500 t, maintaining geopolitical risk for the thermal barrier coatings market. Leading suppliers have turned to strategic stock builds and alternate dopants such as gadolinium to cap exposure.
Tightening HSE Norms on Plasma-Spray Shop Emissions and Dust
California’s Airborne Toxic Control Measure caps hexavalent chromium and nickel particle release, obliging coat shops to add sealed booths, multi-stage filtration, and personal monitoring to pass audits [4]. Under the UK COSHH framework, similar rules are rolling out across Europe, pushing small shops toward costly retrofits or outsourcing. These compliance burdens can stall adoption for smaller tier-two suppliers despite robust end-market demand.
*Our forecasts treat driver/restraint impacts as directional, not additive. The impact forecasts reflect baseline growth, mix effects, and variable interactions.
Thermal Barrier Coatings Market Segment Analysis
By Product Type:
Ceramic Dominance Drives InnovationCeramic top coats contributed 55.58% to the thermal barrier coatings market in 2025, underscoring the unmatched thermal insulation offered by yttria-stabilized zirconia systems. The thermal barrier coatings market size for ceramic products is expected to keep expanding as aerospace primes qualify double-layer stacks that pair gadolinium zirconate with 8YSZ for better CMAS resistance.
Metal bond coats, while only a sub-layer, register the quickest growth at 5.74% CAGR, thanks to new MCrAlY chemistries that form uniform alumina scales and delay spallation. Intermetallic and graded coats are spreading in power-plant retrofit programs where component lives stretch beyond 25,000 h. High-entropy alloy coats remain a research subject but they promise phase stability across wider temperature bands.

By Coating Technology:
Plasma Spray EvolutionAir plasma spray held 41.20% share in 2025, favoured for its wide material window and economical throughput across turbine vanes, shrouds, and combustor panels. Digital twin models now adjust torch current in real time to keep porosity within ±1%, supporting the quality-centric aerospace supply chain.
Plasma spray-PVD is climbing at a 5.33% CAGR because its low-pressure vapour plume deposits columnar microstructures that flex with thermal cycles. Electron-beam PVD stays the premium choice for single-crystal blades in wide-body engines, whereas HVOF dominates wear-resistant coatings in oil and gas valves. Solution precursor plasma spray and CVD occupy niches where dense, crack-free films are mandatory.
By Coating Material:
Zirconia Leadership Under PressureYttria-stabilized zirconia commanded 61.55% of the thermal barrier coatings market share in 2025 because it balances thermal conductivity, phase stability, and production cost. Continuous development seeks to slow its tetragonal-to-monoclinic transformation above 1,200 °C by adding alumina or silica scavengers.
Rare-earth zirconates are expanding at 5.82% CAGR as OEMs validate lanthanum and gadolinium systems for 1,400 °C turbine front stages. Alumina-rich mullite serves diesel turbochargers where sulphur attack is severe, while MCrAlY bond coats gain chrome levels to fight hot corrosion in high-sulphur fuels. High-entropy alloy formulations remain experimental but early coupons have survived 2,000 thermal cycles without delamination.
By End-User Industry:
Aerospace Leadership with Automotive MomentumThe aerospace sector absorbed 46.10% of global demand in 2025, reinforcing the centrality of strict thrust-to-weight and fuel-burn targets. High-bypass engines on new wide-body aircraft rely on coatings to hit 60,000 h time on wing.
Automotive volumes are smaller yet clock the steadiest 6.78% CAGR, mainly through turbocharger hot-side housings and cylinder liners in downsized petrol engines. Battery-electric drivetrain makers now coat stator end-turns to insulate copper from hot inverter spray, opening a new adjacency beyond combustion engines. Power plant OEMs retain a baseline outlook as LM6000 and H-class units undergo life-extension overhaul every five years, keeping demand even in mature fleets.
Geography Analysis
APAC Thermal Barrier Coatings Market
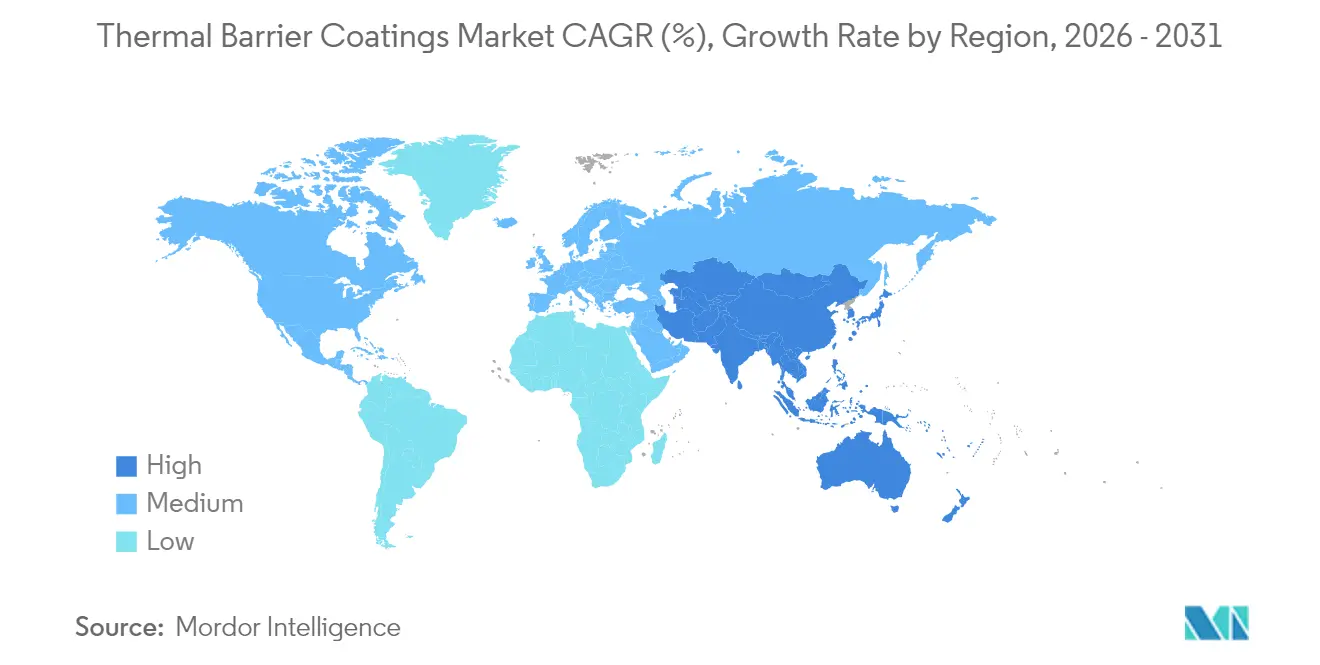
Asia-Pacific held a 34.90% share of the thermal barrier coatings market in 2025 and is set to grow at 4.98% CAGR to 2031. The region gains from China’s 50-GW gas-turbine build-out program and Japan’s vertically integrated aero-engine supply chain that coats both domestic and export components. South Korea’s shipyards adopt ceramic stacks on dual-fuel LNG engines, and India’s private aerospace ecosystem adds independent spray shops dedicated to single-aisle jets.
North America Thermal Barrier Coatings Market
North America benefits from its strong aerospace tier base, standing as the largest spender on hypersonic R&D. The U.S. Department of Energy funds ultra-high temperature research that explores yttrium-aluminium-garnet variants suited for 1,700 °C turbine inlet temperatures. Canada supports coatings for regional-jet programs in Montréal, while Mexico’s Bajío cluster coats turbo parts for global auto OEMs, feeding integrated supply chains.
Europe, Middle East and South America Thermal Barrier Coatings Market
Europe remains technology-rich despite lower installed capacity growth. Germany’s carmakers retrofit turbocharger lines with in-house spray booths to protect intellectual property. The UK and France channel Horizon Europe grants to phase-shifting ceramic research. Eastern Europe’s lower labour cost lures contract coaters, but compliance with REACH regulation obliges rapid investment in abatement systems. Emerging regions such as the Middle East leverage large gas-turbine aftermarket deals, whereas South America applies coatings on heavy-fuel power units to mitigate sulphidation.
Value Chain Analysis
The thermal barrier coatings (TBC) value chain starts with upstream extraction and refining of zircon sand and rare-earth oxides used for yttria-stabilized zirconia (8YSZ) and emerging rare-earth zirconates, followed by powder and feedstock preparation (particle sizing, spheroidization, purity control) and alloy production for bond coats (including MCrAlY families). Material suppliers and integrated powder producers supply feedstock to coating formulators and applicators, including OEM captive shops and contract coaters that run APS, EB-PVD, and newer plasma-spray variants (such as SPPS) based on component geometry and performance requirements.
Midstream value is concentrated in process engineering and qualification, where coating shops convert powders into validated layer stacks and must meet aerospace and turbine quality requirements (for example, NADCAP/ISO practices referenced in supplier qualification). Downstream, coated parts feed into new-build aero-engines and industrial gas turbines, as well as MRO networks, where refurbishment cycles and strip-and-recoat services support recurring demand. Bottlenecks remain linked to high-purity zirconia and rare-earth availability and the narrow process window required to hit microstructure targets, which is driving more regionalized service-center footprints and closer collaboration between materials suppliers, academic programs (including the DOE University Turbine Systems Research ecosystem), and end users to accelerate multilayer architectures and advanced bond-coat chemistries.
Competitive Landscape
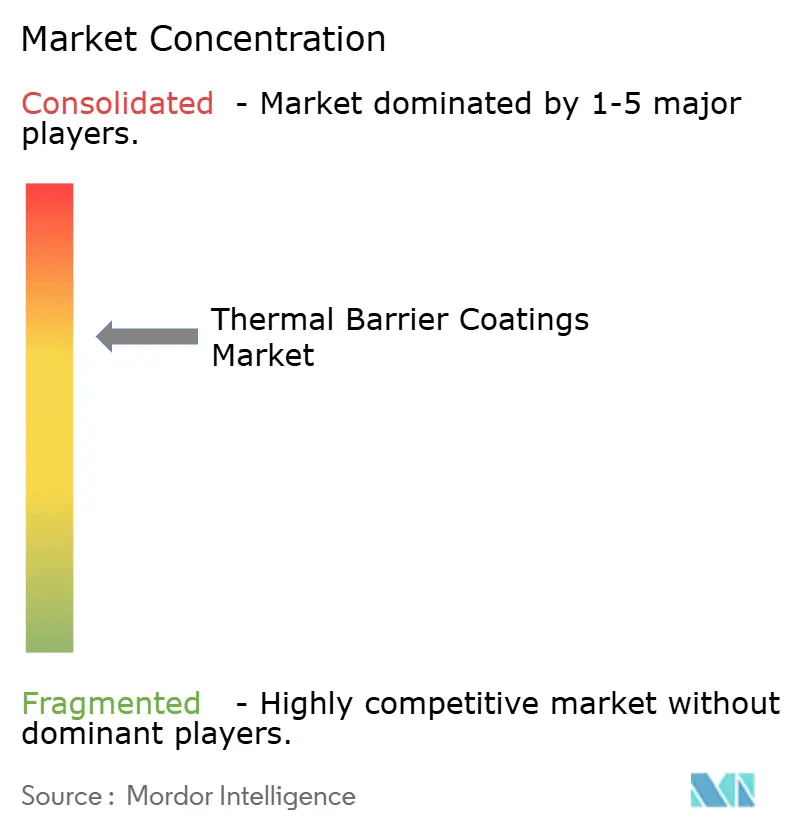
Market is moderately consolidated, with the top five companies generating about two-thirds of revenue. OC Oerlikon Management AG and Honeywell International Inc. leverage vertically integrated powder production, smart-spray factories, and data analytics to enhance engine on-wing time through IoT-enabled coating life models. Tier-two specialists focus on niches like hypersonic nose tips and Formula One exhaust manifolds, while universities license advanced formulations to start-ups exploring rare-earth zirconates and high-entropy alloys. Joint ventures, such as MTU Aero Engines and Oerlikon’s collaboration to improve torch parameters, are rising. Patent filings emphasize self-healing oxide dispersions and fibre sensors to detect delamination risks. Pricing depends on powder purity, spraying uptime, and meeting NADCAP or ISO standards. Regional content rules in defense contracts drive global players to establish local lines, while cost pressures from raw materials push leaders toward backward integration, particularly in zirconia refining, to maintain competitiveness.
Thermal Barrier Coatings Industry Leaders
-
Honeywell International Inc.
-
Saint-Gobain
-
OC Oerlikon Management AG
-
Linde Plc.
-
Bodycote
- *Disclaimer: Major Players sorted in no particular order
Thermal Barrier Coatings Market Companies Covered in this Report
- AandA Thermal Spray Coatings
- APS Materials, Inc.
- Bodycote
- Cincinnati Thermal Spray, Inc.
- General Electric Company
- Hayden Cororation
- Honeywell International Inc.
- KECO Coatings
- Linde Plc.
- Metallic Bonds, Ltd.
- Northwest Mettech Corp.,
- OC Oerlikon Management AG
- Astro Alloys Inc.
- Saint-Gobain
- Sulzer Ltd.
- Tech Line Coatings Industries, Inc.
- Turbine Surface Technologies
- ZIRCOTEC
Market Opportunities and Future Outlook
Aerospace and turbine hot-section requirements are opening whitespace for multilayer and multifunctional stacks that improve CMAS resistance and cyclic durability beyond conventional single-layer 8YSZ. The direction of travel shows up in Department of Energy-linked turbine materials work on durable multilayer TBC architectures, including configurations that add gadolinium zirconate layers for erosion resistance, as well as academic progress on new bond-coat concepts. These include multi-principal element variants positioned as oxidation-resistant alternatives to traditional MCrAlY families.
On the supply side, feedstock quality and availability continue to act as a practical differentiator, creating room for suppliers that can secure or scale high-purity ceramic inputs used in zirconia-alumina and related systems. In July 2026, Advanced Engineered Materials reported an exclusive supply agreement tied to nano-particle high-purity alumina and cited a 2026 capacity increase at its Cap-Chat, Quebec facility to 3,000 tonnes per annum, supporting tighter control over ceramic raw material inputs. Capacity and capability upgrades near aerospace maintenance hubs also remain a near-term lever, illustrated by Chromalloy completing an expansion of its Belac Coatings Center of Excellence in Oldsmar, Florida in August 2025 to add EB-PVD thermal barrier coating capacity for aviation aftermarket workloads.
Recent Industry Developments in Thermal Barrier Coatings Market
- March 2026: Honeywell International Inc. received US Patent 12,577,677 covering a method to form abrasion-resistant coatings on graphite substrates, including controlled grinding to specified flatness and roughness indices. The filing reinforces Honeywell's IP position around coating process control for high-temperature substrate systems used in demanding aerospace and power-generation environments.
- August 2025: Chromalloy completed an expansion of the Belac Coatings Center of Excellence in Oldsmar, Florida, adding Electron-Beam Physical Vapor Deposition (EB-PVD) thermal barrier coating capacity. The upgrade increases specialized deposition capability tied to aviation aftermarket throughput, where qualified EB-PVD capacity can constrain hot-section repair cycles.
- July 2024: OC Oerlikon Management AG and MTU Aero Engines advanced their collaboration to develop a smart thermal spray factory, integrating digital workflows such as anomaly detection, predictive maintenance, and process optimization. The effort targets higher transparency and repeatability in aerospace component coating operations, aligning shop-floor data systems with stringent quality demands.
Thermal Barrier Coatings Market Report Scope and Research Methodology
Market Definition and Coverage
This market covers revenues earned from thermal barrier coatings used to protect components that run at high temperatures, mainly in engines, turbines, and industrial equipment, where the coating system improves heat resistance and part life.
Scope exclusions: We exclude general high-temperature paints and thermal insulation coatings that are not engineered as thermal barrier coating systems for high-heat components.
Segments Covered in This Report
- By Product Type
- Metal
- Ceramic
- Intermetallic
- Other Products (Metal-Glass Composite, etc.)
- By Coating Technology
- Air Plasma Spray (APS)
- High-Velocity Oxygen Fuel (HVOF)
- Electron-Beam PVD (EB-PVD)
- Chemical Vapor Deposition (CVD)
- Plasma Spray-PVD (PS-PVD)
- Solution Precursor Plasma Spray (SPPS)
- By Coating Material
- Yttria-Stabilized Zirconia (8YSZ)
- Rare-Earth Zirconates (GdZrO, LaZrO)
- Alumina and Mullite
- MCrAlY Bond Coats
- High-Entropy Alloy Coats
- By End-user Industry
- Aerospace
- Power Plants
- Automotive
- Oil and Gas
- Other End-user Industries (Railways, Marine, etc.)
- By Geography
- Asia-Pacific
- China
- India
- Japan
- South Korea
- Rest of Asia-Pacific
- North America
- United States
- Canada
- Mexico
- Europe
- Germany
- United Kingdom
- Italy
- France
- Rest of Europe
- South America
- Brazil
- Argentina
- Rest of South America
- Middle East and Africa
- Saudi Arabia
- South Africa
- Rest of Middle East and Africa
- Asia-Pacific
Data Sources, Market Sizing, and Validation
Desk Research
Desk research was used to set the demand context and build realistic input ranges before interviews were run. We referred to public sources such as the US Energy Information Administration, International Energy Agency, US Geological Survey, World Bank industrial indicators, and patent databases to understand turbine build trends, material availability, and technology direction.
To anchor the model, we also reviewed company annual reports and investor presentations for coating and materials businesses, along with trade association updates and credible industry news coverage on turbine programs, maintenance cycles, and heat-efficiency targets. A paid subscription for company financials and intelligence was used selectively to cross-check revenue exposure and regional footprints. These sources are illustrative, and they are not exhaustive. Many other public references were used for data collection, validation, and clarification.
Primary Interviews and Surveys
Primary work focused on validating what gets coated, how volumes move with engine and turbine activity, and how pricing shifts with material and process choices. We spoke with participants across coating applicators, material suppliers, and end-user maintenance teams. Coverage was balanced across APAC, EMEA, and the Americas, so regional aircraft and power generation cycles were not over-assumed.
Distribution of primary research fieldwork respondents
| Company type | Respondent position | Region |
|---|---|---|
| Top tier: 36% | CXOs: 14% | APAC: 39% |
| Mid tier: 50% | Functional/Unit leaders: 32% | EMEA: 36% |
| Smaller Players: 14% | Managers: 54% | Americas: 25% |
Market-Sizing & Forecasting
Market size is constructed using a top-down approach where aircraft and gas turbine activity, maintenance intensity, and thermal barrier coating adoption are used to rebuild the addressable coating spend, which is then pressure-tested using selective bottom-up checks. Those checks used sampled volume and pricing logic, such as typical coated surface area per component class, average coating thickness ranges, and observed ASP differences by process route.
Key inputs used in the model included engine and industrial turbine deliveries, shop-visit and overhaul cycles, coating process mix (for example APS versus EB-PVD), and material preferences (such as 8YSZ and rare-earth zirconates) that change cost per part. Because some public datasets do not show coating consumption directly, gaps were handled by applying penetration and replacement rates informed by interviews, and then sanity-checking totals against supplier revenue exposures. For the forecast, scenario analysis was applied around aircraft utilization, power generation additions, and repair cycle timing. A smoothing step was then used so the curve did not overreact to a single-year shock.
Data Validation & Update Cycle
Validation is done by triangulating the modeled totals against independent signals such as engine build outlook, turbine maintenance cadence, and materials availability, followed by region and end-use variance checks. When a large swing is seen, assumptions are revisited. If needed, we re-contact subject matter respondents to confirm whether the change is pricing-led, volume-led, or driven by process shifts.
Before sign-off, the work goes through multi-step analyst reviews where inputs, calculations, and outputs are checked for internal consistency, and unusual country or segment splits are challenged. The report is refreshed annually, and interim updates are made when material events occur, such as major aircraft production changes or sharp feedstock price movements. Right before delivery, a final pass is completed so the published view reflects the latest available information.
Mordor Intelligence's Thermal Barrier Coatings Market Size Measured Against Other Published Estimates
Published market numbers for thermal barrier coatings can vary a lot, even when they are talking about similar end-use industries. The main reasons usually come down to what is counted as a thermal barrier coating, which coating steps are included, and how pricing and volume are projected across aerospace and power generation cycles.
General high-temperature paints and adjacent thermal insulation coatings are outside Mordor Intelligence's scope, which explains why some published totals look much larger than a revenue-only TBC system view tied to turbine and engine coating demand. Differences also come from whether a source assumes aggressive adoption of advanced processes, uses a single global ASP progression without checking process mix, or applies currency timing that inflates the base year in USD.
Benchmark comparison
| Source | Market Size | Gaps in Research Methodology |
|---|---|---|
| Mordor Intelligence | USD 1.21 B (2025) | |
| Global Consultancy A | USD 18.05 B (2025) | Often bundles broader heat-management coatings into the total and does not clearly separate thermal barrier coating systems from other high-temperature protection coatings, which can overstate the addressable revenue pool. |
| Industry Research Publisher B | USD 20.73 B (2024) | Uses a larger umbrella definition and a different base year, and the method appears to lean on high-level segmentation without transparent linkages to engine and turbine activity, repair cycles, and process-mix driven pricing. |
Looking across the table, the spread is mostly explained by category scope and the demand anchors used for volume and pricing. Our estimate stays traceable because assumptions are tied back to observable engine and turbine signals, and then reconciled with interview-led checks on process mix and real-world coating spend.
Key Questions Answered in the Report
What is the projected value of the thermal barrier coatings market by 2031?
The thermal barrier coatings market is forecast to reach USD 1.55 billion by 2031 based on current growth projections.
Which product category holds the largest share today?
Ceramic command 55.58% of 2025 revenue owing to their superior insulation properties.
Which region leads both size and growth?
Asia-Pacific accounts for 34.90% of global revenue and is expected to grow at a 4.98% CAGR through 2031, driven by gas-turbine build-outs and aerospace investment.
Which coating technology is growing the fastest?
Plasma spray-PVD shows the highest forecast CAGR at 5.33% because its columnar microstructures withstand thermal shock better than conventional methods.
How are regulations affecting coating producers?
Stricter emission limits in Europe and North America require costly ventilation and filtration upgrades, influencing production economics for plasma-spray shops.