
Therapeutic Plasma Exchange Market Size and Share
Market Overview
| Study Period | 2020 - 2031 |
|---|---|
| Market Size (2026) | USD 1.33 Billion |
| Market Size (2031) | USD 1.91 Billion |
| Growth Rate (2026 - 2031) | 7.42 % |
| Fastest Growing Market | Asia Pacific |
| Largest Market | North America |
| Market Concentration | Medium |
Major Players *Disclaimer: Major Players sorted in no particular order Image © Mordor Intelligence. Reuse requires attribution under CC BY 4.0. | |
Therapeutic Plasma Exchange Market Analysis by Mordor Intelligence
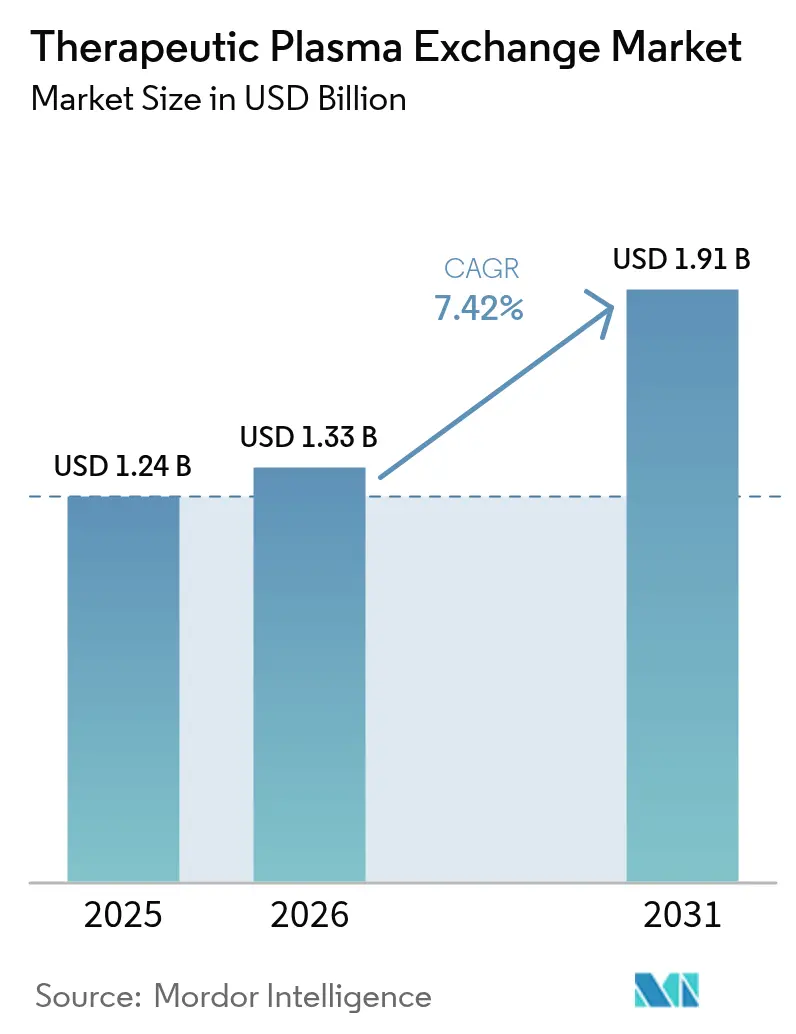
Therapeutic plasma exchange market size in 2026 is estimated at USD 1.33 billion, growing from 2025 value of USD 1.24 billion with 2031 projections showing USD 1.91 billion, growing at 7.42% CAGR over 2026-2031. This expansion reflects rising prevalence of severe autoimmune and neurological diseases, growing clinical validation across new indications, and a decisive shift from hospital-centric procedures toward decentralized and home-based care models. Portable apheresis devices shorten treatment times, reduce infection exposure, and align with patients’ preference for receiving chronic therapies in familiar environments. Reimbursement upgrades in the United States and Western Europe have removed major financial barriers for frequent procedures, while government-backed localization programs in Asia-Pacific multiply production capacity for both machines and consumables. Technological convergence of membrane filtration with selective adsorption columns is reshaping equipment design as providers demand systems capable of multiplex functionality. At the same time, alternative drug classes such as FcRn inhibitors are intensifying competitive pressure, spurring equipment manufacturers to bundle software, disposables, and service contracts into integrated value propositions.
Key Report Takeaways
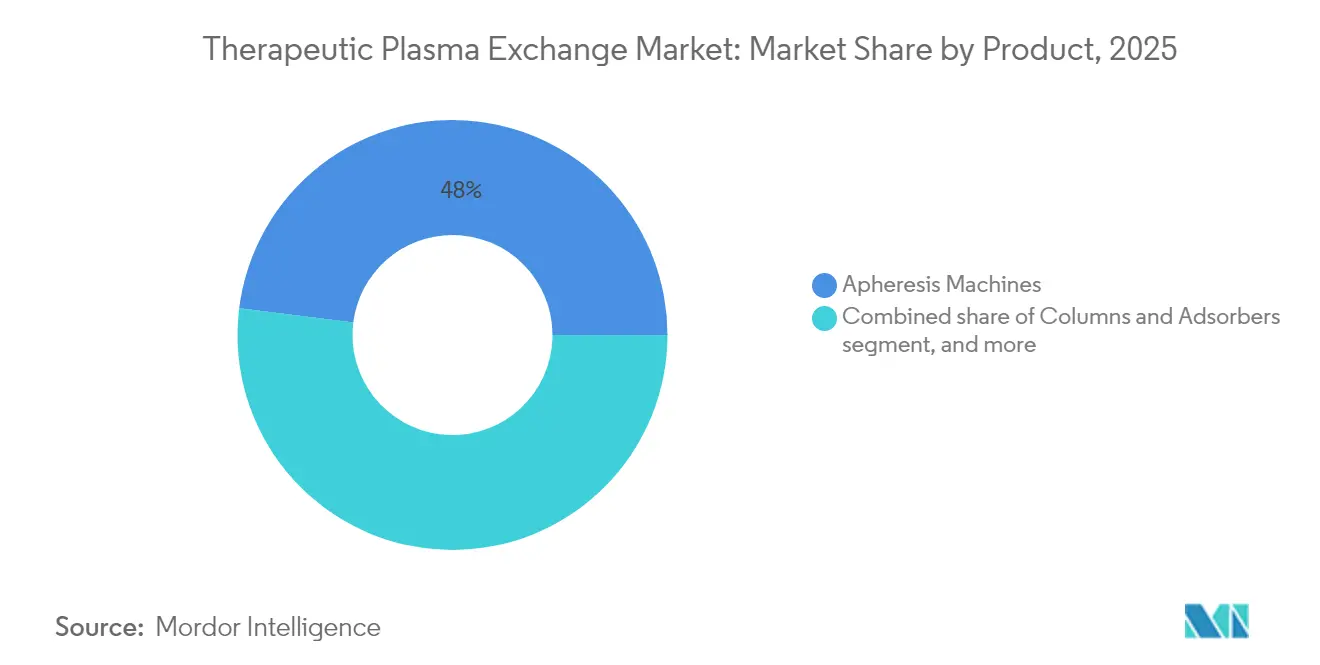
- By product type, apheresis machines led with 48.02% of therapeutic plasma exchange market share in 2025. Columns and adsorbers are poised for a 9.49% CAGR through 2031.
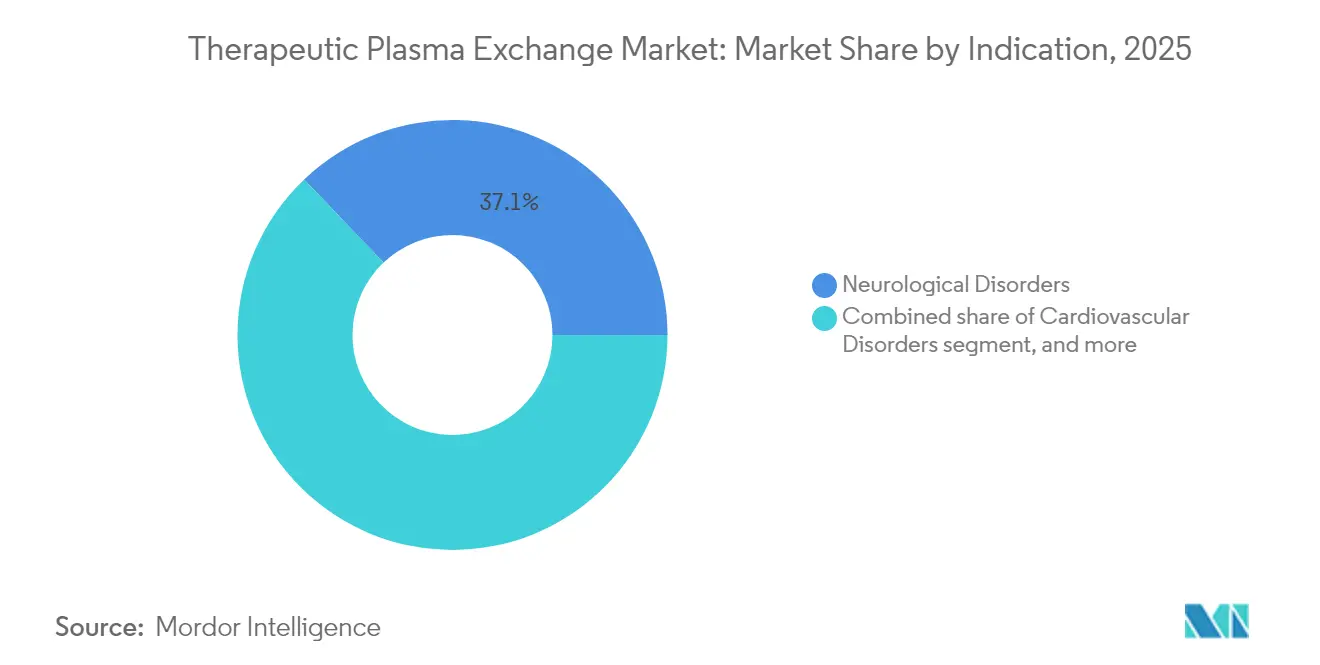
- By indication, neurological disorders accounted for 37.12% of the therapeutic plasma exchange market size in 2025, whereas transplant rejection applications are forecast to expand at 9.63% CAGR.
- By end-user, home-care settings captured 61.78% share of the therapeutic plasma exchange market in 2025 and are advancing at a 10.29% CAGR to 2031.
- By geography, North America held 40.66% share of the therapeutic plasma exchange market in 2025, while Asia-Pacific is projected to register the fastest regional CAGR at 8.31% through 2031.
Note: Market size and forecast figures in this report are generated using Mordor Intelligence’s proprietary estimation framework, updated with the latest available data and insights as of 2026.
Market Trends and Insights
Drivers Impact Analysis of Therapeutic Plasma Exchange Market*
| Driver | % Impact on CAGR Forecast | Geographic Relevance | Impact Timeline |
|---|---|---|---|
| Rising burden of autoimmune and neurological disorders | +2.1% | Global, concentrated in North America & Europe | Long term (≥ 4 years) |
| Increasing clinical evidence supporting expanded indications | +1.8% | Global, early adoption in developed markets | Medium term (2-4 years) |
| Favorable reimbursement policies in developed nations | +1.4% | North America & Europe; selective APAC markets | Short term (≤ 2 years) |
| Growing adoption of therapeutic plasma exchange in cardiac surgery | +0.9% | Global, early gains in specialized cardiac centers | Medium term (2-4 years) |
| Surge in adoption of adsorption columns in Asian hospitals | +1.2% | Asia-Pacific, especially China & Japan | Medium term (2-4 years) |
| Emergence of portable apheresis devices for out-of-hospital care | +1.6% | Global, with rapid uptake in home-care markets | Short term (≤ 2 years) |
| Source: Mordor Intelligence | |||
Rising Burden of Autoimmune and Neurological Disorders
Global incidence of chronic autoimmune diseases continues to climb, with Guillain–Barré syndrome and myasthenia gravis patients showing 92% and 81.25% response rates respectively when treated with therapeutic plasma exchange. Healthcare systems increasingly recognize plasma exchange as a rescue therapy for refractory flares, a trend amplified by aging populations in high-income countries where disease severity is greater. Early evidence also suggests plasma exchange may mitigate long-COVID symptoms by removing inflammatory mediators, thereby widening the patient pool. Collectively these epidemiological and clinical factors generate sustained procedure demand and underpin multi-year equipment replacement cycles.
Increasing Clinical Evidence Supporting Expanded Indications
The American Society for Apheresis assigned therapeutic plasma exchange a Category I-III recommendation across 87 diseases in its 2024 guidelines, highlighting broadening indication scope[1]. Randomized studies published in 2025 demonstrated significant reductions in cytokine levels among COVID-19 patients with neurological complications following exchange sessions. Pediatric data from the Egyptian Pediatric Association Gazette confirmed safety outcomes comparable to adults, encouraging earlier intervention in children. Growing evidence base lowers prescriber hesitancy, accelerates hospital protocol integration, and fuels incremental procedural volume across specialties.
Favorable Reimbursement Policies in Developed Nations
Medicare’s 2025 outpatient fee schedule assigns USD 431.83 per plasma exchange administration, aligning federal coverage with cost-effectiveness studies that place per-session treatment costs at nearly half those of intravenous immunoglobulin. Similar tariff adjustments in Germany and France have created immediate financial incentives for hospitals to favor plasma-based regimens over more expensive biologics. Private insurers are mirroring these revisions, broadening coverage to new autoimmune indications such as sickle cell crises. Improved payment certainty boosts capital purchase justification for advanced systems and accelerates amortization of high-value consumables.
Growing Adoption of Therapeutic Plasma Exchange in Cardiac Surgery
Complex cardiac cases increasingly rely on extracorporeal blood management strategies. NHS England allocated USD 1.5 million to deploy 25 Spectra Optia devices dedicated to sickle-cell patients needing surgical interventions, projecting up to 10,000 additional annual procedures. Spectra’s ability to perform red-cell exchange concurrently with renal replacement reduces transfusion burden and ICU length of stay, compelling leading heart centers in the United States and Japan to adopt similar protocols. Cardiac programs’ high case revenue offsets equipment costs, giving this clinical niche outsized influence on overall procedural demand.
Restraints Impact Analysis of Therapeutic Plasma Exchange Market*
| Restraints Impact Analysis | (~) % Impact on CAGR Forecast | Geographic Relevance | Impact Timeline |
|---|---|---|---|
| High capital and consumable costs of apheresis systems | –1.2% | Global, pronounced in emerging markets | Long term (≥ 4 years) |
| Limited availability of skilled apheresis personnel | –0.8% | Global, acute in rural & developing regions | Medium term (2-4 years) |
| Vulnerability of plasma supply chain during global crises | –1.0% | Global, most visible in Europe & North America | Short term (≤ 2 years) |
| Regulatory uncertainty regarding pediatric applications | –0.6% | Global, with stricter oversight in EU & U.S. | Medium term (2-4 years) |
| Source: Mordor Intelligence | |||
High Capital and Consumable Costs of Apheresis Systems
Best-in-class devices exceed USD 100,000 per unit, while single-use kits add USD 1,000-1,200 per procedure, costs that small hospitals in Latin America and Africa struggle to justify. Post-pandemic supply chain shocks elevated resin and membrane prices, inflating column costs by 15% in 2024. Although OEMs offer leasing, pay-per-use, and service bundles, strained health budgets in emerging economies translate into slower replacement cycles and deferred adoption of next-generation platforms.
Limited Availability of Skilled Apheresis Personnel
Each therapeutic plasma exchange session requires nurses and physicians trained in anticoagulation management, real-time hemodynamic monitoring, and emergency complication handling. Surveys by the Southeast Asian Therapeutic Plasma Exchange Consortium found less than one certified operator per million population in Indonesia and Vietnam. Aging workforces in Europe predict a 30% retirement-driven attrition of senior specialists by 2030 unless offset by accelerated training pipelines. Personnel shortages directly cap daily procedure capacity, restraining revenue generation even where equipment is available.
*Our forecasts treat driver/restraint impacts as directional, not additive. The impact forecasts reflect baseline growth, mix effects, and variable interactions.
Therapeutic Plasma Exchange Market Segment Analysis
By Product:
Technology Convergence Reshapes Equipment LandscapeApheresis machines generated 48.02% of the therapeutic plasma exchange market size in 2025, underscoring their status as the procedural hub across all disease categories. Columns and adsorbers, however, are advancing at a 9.49% CAGR to 2031 as clinicians demand selective pathogen removal with minimal plasma substitution. Integrated devices now combine centrifugal separation with adsorption cartridges, allowing operators to toggle between whole-plasma removal and antibody-specific filtration within the same console. Manufacturers differentiate through sensor-driven anticoagulant titration, closed-system disposables, and cloud-based performance analytics that cut procedure times below 35 minutes.
Recurring consumables revenue remains pivotal: tubing sets, saline, anticoagulants, and replacement fluids contribute nearly 60% of lifetime customer value per installed base. Market incumbents thus bundle hardware leases with long-term consumable contracts, locking in predictable cash flows. Software updates enabling remote troubleshooting and protocol libraries further shift competition from price to platform ecosystem residency, deepening customer dependence and throttling potential displacement by low-cost entrants.

By Indication:
Neurological Applications Drive Core GrowthNeurological disorders represented 37.12% of therapeutic plasma exchange market share in 2025 and continue to form the clinical backbone of procedural demand. Rapid antibody clearance markedly reduces ventilator dependence in Guillain–Barré syndrome and cuts ICU stay length in myasthenic crises. Transplant rejection management delivers 9.63% CAGR through 2031, propelled by rising organ donation rates in China, India, and Brazil, and by the integration of plasma exchange into antibody-mediated rejection protocols published by the International Society for Heart and Lung Transplantation. Cardiovascular applications, notably peri-operative red-cell exchange, are reaping spillover benefits from that protocolization, while renal and hematology indications sustain baseline utilization across dialysis centers and hematology wards.
Emerging domains such as long-COVID, pediatric autoimmune encephalitis, and catastrophic antiphospholipid syndrome broaden the therapeutic canvas. As evidence accrues, payers are adding these conditions to reimbursement rosters, ensuring that procedural volume growth is not solely tied to classic autoimmune cohorts. The therapeutic plasma exchange market therefore secures a defensible core in neurology while layering new revenue from rapidly scaling post-transplant and infectious disease niches.
By End-User:
Home Care Revolution Transforms Treatment DeliveryHome-based therapy commanded 61.78% share of the therapeutic plasma exchange market in 2025 and is forecast for a 10.29% CAGR to 2031, illustrating a decisive out-of-hospital migration. Portable devices weigh less than 18 kg and plug into standard electrical outlets, allowing certified nurses to conduct sessions in patient living rooms while real-time vitals upload to cloud dashboards. The pandemic catalyzed broad payer acceptance of remote monitoring codes, and many U.S. insurers now reimburse travel-to-home sessions at parity with outpatient departments.
Hospitals remain indispensable for complicated multi-organ cases, yet even tertiary centers acknowledge that reserving in-house resources for acute crises improves capacity utilization. Ambulatory surgery centers fill the intermediate niche, offering same-day procedures for stable patients without full inpatient overheads. Start-up service providers are responding with franchise-style mobile units that bundle equipment, staffing, and consumables under subscription pricing, challenging legacy hospital-only revenue models.
Geography Analysis
North America Therapeutic Plasma Exchange Market
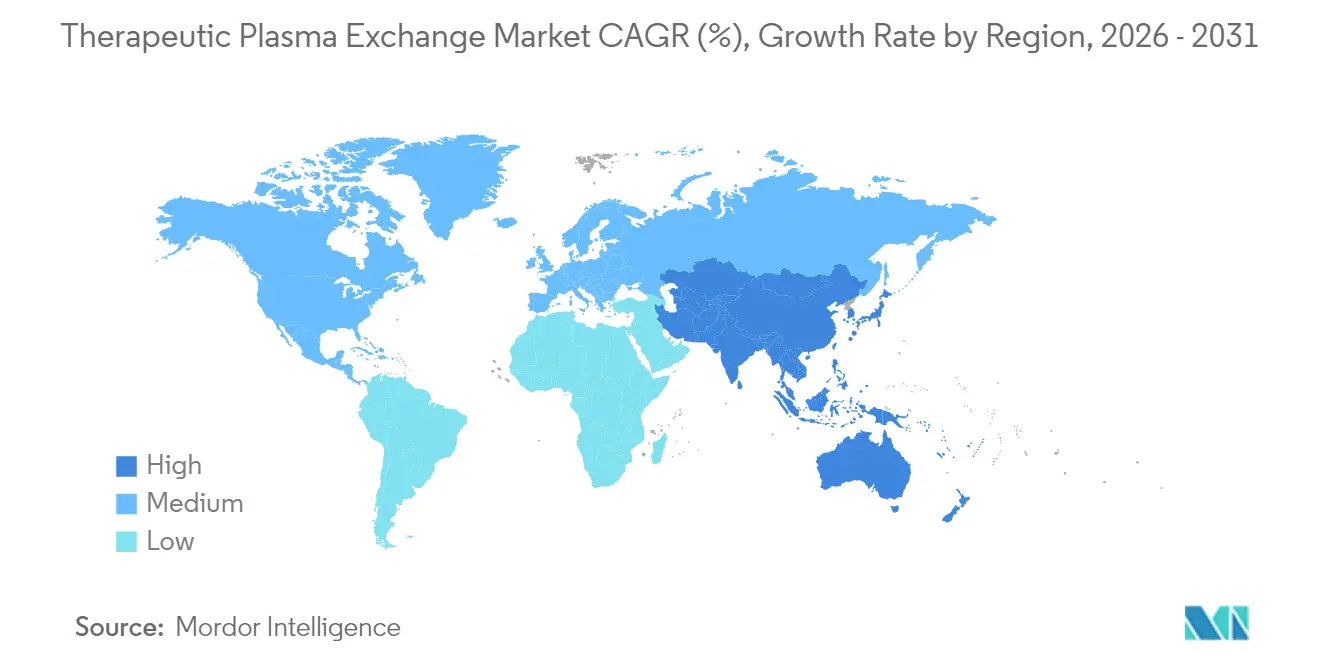
North America dominated with 40.66% of therapeutic plasma exchange market share in 2025, buoyed by robust Medicare and private-payer reimbursement that offsets high consumable costs. FDA clearance of the Aurora Xi plasmapheresis system in 2025 added competition and fostered price moderation among incumbent consoles. Canada’s provinces recently harmonized fee schedules with U.S. rates, reducing cross-border procedure leakage and stabilizing domestic demand.
APAC Therapeutic Plasma Exchange Market
Asia-Pacific is the fastest-growing region at an 8.31% CAGR, propelled by China’s Healthy China 2030 plan that funds apheresis infrastructure in 300 county hospitals. Terumo’s USD 15 million Hangzhou facility expansion secures local supply of Spectra Optia kits, lowering import tariffs and slashing delivery times by 40%. Japan and South Korea maintain mature installed bases, yet upside remains from demographic aging and transplant program expansions. India’s medical tourism growth funnels international patients into private hospitals offering competitive plasma exchange packages.
EMEA and South America Therapeutic Plasma Exchange Market
Europe shows steady but slower expansion. Although universal insurance coverage facilitates access, plasma supply shortages in 2024 forced many EU countries to import 40% of their raw plasma from the United States, prompting the European Blood Alliance to seek two million additional donors. Middle East and Africa markets are nascent but supported by Gulf Cooperation Council investments in tertiary care hubs, while Brazil and Argentina spearhead South American adoption through public-private hospital networks.
Regulatory Landscape
Therapeutic plasma exchange (TPE) equipment and related blood-contacting disposables are regulated as medical devices, with requirements centered on safety, performance, and hemocompatibility. In the United States, FDA oversight includes device clearances under applicable product codes used for plasmapheresis and therapeutic devices, and manufacturers also need to distinguish device compliance from any separate controls that apply when plasma derived from TPE enters downstream biologics manufacturing pathways.
Across regions, biocompatibility and blood-interaction testing remain a key compliance anchor for apheresis platforms, tubing sets, and adsorption components. The 2025 updates to ISO 10993 (including ISO 10993-1:2025 and ISO 10993-4:2017/Amd 1:2025) tighten expectations around risk management-based biological evaluation and hemocompatibility test selection, which feeds into design verification and technical documentation for systems intended for direct or indirect blood contact. Separately, authorization pathways are widening access: in September 2025, Terumo Blood and Cell Technologies announced regulatory approvals for the Spectra Optia Apheresis System in 14 Latin American countries for additional indications, including sickle cell disease, Guillain-Barre syndrome, and myasthenia gravis, supporting broader TPE and automated red blood cell exchange use.
Value Chain Analysis
The therapeutic plasma exchange value chain starts with upstream materials and components (polymers, membranes, resins, sensors, and anticoagulant-compatible fluid pathways) that support OEM manufacturing of apheresis consoles and the high-velocity supply of sterile, single-use kits (tubing sets, filters, columns, and adsorbers). Distribution typically runs through direct sales and service networks into hospitals, ambulatory sites, and home-care providers, where procedure delivery depends on trained operators, replacement-fluid logistics, and device uptime supported by field service and software updates. For many providers, recurring consumables and service contracts represent a substantial share of lifetime value tied to the installed base, so availability and standardization of disposables directly influence continuity of care.
Midstream and downstream dynamics increasingly reflect ecosystem partnerships that combine platform consoles with capture or adsorption technologies and protocolized care delivery models. In November 2025, Terumo Blood and Cell Technologies and Santersus AG announced an exclusive collaboration to integrate Santersus NucleoCapture with the Spectra Optia Apheresis System for severe sepsis applications, showing how add-on therapeutic apheresis technologies can move through existing installed platforms. Service-layer expansion also shapes channel structure: in June 2026, Circulate Health announced an exclusive partnership with Reborne to bring standardized TPE protocols to the United Kingdom, reinforcing how protocol owners and specialty providers influence device utilization, staffing requirements, and consumables demand. Supply resilience remains a cross-cutting constraint, with broader medical supply chain discussions highlighting post-pandemic lead-time, quality, and logistics risks that can affect scheduled exchange regimens.
Competitive Landscape
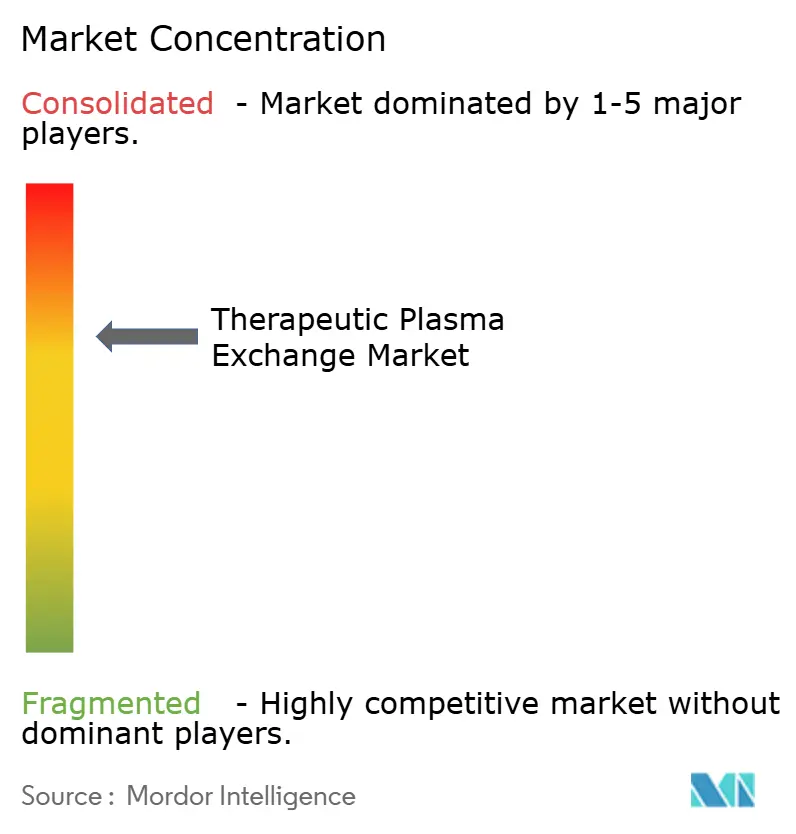
The therapeutic plasma exchange market exhibits moderate consolidation, with Terumo, Fresenius Kabi, and Baxter controlling an estimated 70% of global installed consoles. Terumo’s Rika system reached 98 U.S. center installations by late 2024 and targets 25% market penetration by 2027 through faster collection times and donor-tailored volumes. Fresenius Kabi gained FDA clearance for its Adaptive Nomogram software, which dynamically adjusts flow rates to optimize collection volumes, reinforcing its disposable-driven revenue flywheel.
Baxter divested its USD 3.8 billion Kidney Care arm to concentrate on high-growth infusion and apheresis segments, signaling strategic commitment to advanced blood purification platforms. Competitive threat from FcRn inhibitors continues to mount as Argenx reported USD 1.2 billion in 2024 efgartigimod sales, validating non-procedural therapeutic alternatives.
In response, device makers emphasize hybrid systems that couple plasma removal with adsorption cartridges, seeking to preserve procedural relevance by delivering quicker antibody reduction than biologics alone. Midsize entrants focus on low-cost portable consoles for emerging markets, but stringent regulatory requirements and entrenched hospital service contracts keep entry barriers high.
Therapeutic Plasma Exchange Industry Leaders
-
Asahi Kasei Corporation
-
Baxter International Inc
-
Terumo Corporation
-
B. Braun Melsungen AG
-
Fresenius Kabi AG
- *Disclaimer: Major Players sorted in no particular order
Therapeutic Plasma Exchange Market Companies Covered in this Report
- Asahi Kasei Corp.
- Baxter
- B. Braun
- Cerus Corp.
- Fresenius
- Haemonetics Corp.
- HemaCare
- Medica S.p.A.
- Kawasumi Laboratories
- Terumo Corp.
- Kaneka Corp.
- Nikkiso Co.
- MacoPharma
- ImmunoSystems
- Plasauto Biotech
- Sichuan Nigale
- Miltenyi Biotec
- Otsuka Medical Devices
- Biotest
- MediSieve
Market Opportunities and Future Outlook
A key opportunity is the continued shift of therapeutic plasma exchange delivery from acute hospital settings into ambulatory and home-care-oriented models that depend on standardized protocols, trained mobile nursing infrastructure, and remote monitoring workflows. Evidence of this commercialization shows up in service-network expansion: in June 2026, Circulate Health announced an exclusive partnership with Reborne to establish its first UK clinical location offering standardized TPE protocols, and in July 2026, MDLifespan expanded advanced serial TPE services with a new location in Southlake (Dallas-Fort Worth). Together, these moves create whitespace for OEMs and suppliers to bundle portable-capable platforms, consumables continuity, and service support into offerings tailored to outpatient and distributed-care operators.
Another opportunity sits in higher-selectivity blood purification modalities and adjunct technologies that expand use cases while managing exchange-fluid volume and procedure burden. Development activity around selective removal platforms illustrates this direction, such as Eliaz Therapeutics reporting translational data in June 2026 supporting selective Galectin-3 removal in severe sepsis as it advances its XGAL-3 apheresis platform. On the systems side, efficiency and personalization features supported by regulator-cleared software and collection technologies can strengthen the installed-base proposition by improving yield and workflow consistency. In the broader apheresis ecosystem, examples include FDA-cleared algorithmic optimization approaches and personalized collection technologies that keep competition centered on protocols, software, and disposables rather than consoles alone.
Recent Industry Developments in Therapeutic Plasma Exchange Market
- July 2026: Asahi Kasei announced plans to construct a fourth spinning plant for Planova virus removal filters in Nobeoka City (Miyazaki, Japan) to expand bioprocess supply capabilities. The added capacity supports upstream filtration availability used across plasma-derived and bioprocess workflows, strengthening supply assurance for manufacturers that depend on viral filtration inputs.
- September 2025: Terumo Blood and Cell Technologies announced regulatory approvals for the Spectra Optia Apheresis System in 14 Latin American countries for additional indications, including sickle cell disease, Guillain-Barre syndrome, and myasthenia gravis. The expanded authorizations broaden the addressable procedure base for therapeutic plasma exchange and automated red blood cell exchange in the region, supporting deeper installed-base utilization and consumables pull-through.
- December 2024: Terumo announced a USD 15 million localization investment to manufacture Spectra Optia and Trima Accel at its Hangzhou site. Local production strengthens regional supply of systems and related kits, reducing delivery times and exposure to import frictions for Asia-Pacific providers running high-throughput apheresis programs.
Therapeutic Plasma Exchange Market Report Scope and Research Methodology
Market Definition and Coverage
For this study, the therapeutic plasma exchange (TPE) market is defined as revenues generated from TPE procedures, counted through the required equipment and single-use sets used to separate and exchange plasma in clinical care, along with the supporting software and services tied to the procedure workflow.
Scope exclusions: We exclude plasma collection for donation, plasma fractionation, and blood banking activities that are not part of therapeutic plasma exchange treatment.
Segments Covered in This Report
- By Product
- Apheresis Machines
- Filters
- Columns & Adsorbers
- Disposables (Tubing, Kits)
- Software & Services
- By Indication
- Neurological Disorders
- Cardiovascular Disorders
- Hematology Disorders
- Renal Disorders
- Transplant Rejection
- Other Indications
- By End-User
- Hospitals
- Ambulatory Surgical Centers
- Specialty Clinics
- Home Care Settings
- Geography
- North America
- United States
- Canada
- Mexico
- Europe
- Germany
- United Kingdom
- France
- Italy
- Spain
- Rest of Europe
- Asia-Pacific
- China
- Japan
- India
- Australia
- South Korea
- Rest of Asia-Pacific
- Middle East & Africa
- GCC
- South Africa
- Rest of Middle East & Africa
- South America
- Brazil
- Argentina
- Rest of South America
- North America
Data Sources, Market Sizing, and Validation
Desk Research
Desk research was used to build the initial demand and supply picture around TPE procedures and the clinical settings where these are typically performed. We relied on public health statistics and disease burden signals to understand where TPE is used most often, and how clinical adoption changes when guidelines and reimbursement evolve.
Sources consulted include, such as, the World Health Organization, the US FDA device databases for apheresis and filtration systems, US CDC health statistics, and peer-reviewed clinical literature indexed in PubMed that discusses indications and typical treatment patterns. We also used company annual reports, investor presentations, and reputable healthcare press for product launches and installed base discussions, and selectively referenced paid subscriptions for company financials and patent databases to cross-check timelines and revenue exposure. These examples are not exhaustive, and many other public and paid sources were also used for data collection, validation, and clarification during the research.
Primary Interviews and Surveys
Primary work focused on checking real-world procedure volumes, replacement cycles for disposables, and how hospitals and specialty centers budget for TPE across regions. We spoke with a mix of clinical users, procurement and operations teams, and industry participants to validate utilization rates, pricing bands, and near-term shifts tied to indications and capacity constraints across APAC, EMEA, and the Americas.
Distribution of primary research fieldwork respondents
| Company type | Respondent position | Region |
|---|---|---|
| Top tier: 26% | CXOs: 15% | APAC: 45% |
| Mid tier: 56% | Functional/Unit leaders: 34% | EMEA: 32% |
| Smaller Players: 18% | Managers: 51% | Americas: 23% |
Market-Sizing & Forecasting
Sizing was first reconstructed using a top-down approach where the treated cohort and procedure intensity were built up by region, and then converted to value using typical procedure-level consumption of disposable sets and the average pricing observed in the channel. Once the demand pool was formed, the totals were cross-checked through selective bottom-up approximations, such as sampling facility-level procedure volumes, checking installed base ranges of TPE-capable systems, and validating average selling price bands for key consumables so the final numbers stayed realistic.
Inputs used in the model include, such as, the prevalence and diagnosis rates for core indications where TPE is commonly used, typical number of exchanges per treatment course, share of care delivered in hospitals versus specialty clinics, replacement and usage rates for single-use disposables, and regional reimbursement and guideline adoption signals that change utilization. Forecasting was done using scenario analysis supported by a simple multivariate view of procedure growth drivers, where expert inputs helped us set reasonable ranges for utilization growth, pricing movement, and capacity additions. When bottom-up checks had gaps in smaller countries, assumptions were bridged using peer-country procedure patterns and adjusted through interview feedback before being rolled into regional totals.
Data Validation & Update Cycle
Validation was done through multiple checks so the outputs matched independent clinical and commercial signals. We compared the modeled procedure volumes against capacity cues (like service coverage and facility readiness) and then reviewed any large jumps that did not line up with guideline or reimbursement changes.
Before sign-off, the model and assumptions go through step-by-step analyst reviews, and follow-up calls are triggered when interview feedback shows material variance by region or indication. Reports are refreshed annually, and interim updates are made when major events occur, such as a significant regulatory change or a demand shock. Right before delivery, a final pass is completed so clients receive the latest updated view.
Mordor Intelligence's Therapeutic Plasma Exchange Market Sizing Compared With Other Published Estimates
It is common to see different market sizes published for therapeutic plasma exchange because the boundary of what is counted can change from one study to another. Differences often come from whether the estimate is procedure-driven or equipment-driven, which indications are treated as in-scope, and how pricing is handled across regions and care sites.
By tracking procedure intensity, consumable usage per exchange, and regional pricing refreshes, Mordor Intelligence keeps the total tied to the TPE demand pool, while some studies also roll in adjacent plasmapheresis variants or use broader apheresis assumptions that inflate volumes.
Benchmark comparison
| Source | Market Size | Gaps in Research Methodology |
|---|---|---|
| Mordor Intelligence | USD 1.33 B (2026) | |
| Global Consultancy A | USD 1.25 B (2025) | Uses a 2025 base year and a longer horizon, and the scope presentation is more indication-led, which can miss procedure-level consumable intensity and site-level utilization differences that shift near-term value. |
| Industry Publisher B | USD 1.47 B (2024) | Includes a wider treatment set by combining TPE with double-filtered plasmapheresis in the core total, and its factory-gate framing can lead to different price capture versus procedure-linked spend in care settings. |
Taken together, the spread is mainly explained by scope boundaries and how procedure volumes and pricing are converted into value. Our approach stays traceable because the key levers are clear, such as treated cohort, exchanges per course, and disposable consumption, and each is checked with interview feedback before totals are finalized.
Key Questions Answered in the Report
What is the projected value of the therapeutic plasma exchange market in 2031?
The market is forecast to reach USD 1.91 billion by 2031.
Which product segment is growing fastest?
Columns and adsorbers, thanks to their 9.49% CAGR tied to antibody-selective removal capabilities.
Why are home-based therapeutic plasma exchange procedures increasing?
Portable consoles, payer parity for remote sessions, and patient preference for reduced hospital exposure are driving a 10.29% CAGR in the home-care segment.
Which region will record the strongest growth through 2031?
Asia-Pacific, supported by public health investments and local manufacturing, is set to post an 8.31% CAGR.
How are alternative therapies affecting equipment manufacturers?
Rising sales of FcRn inhibitors push device makers to add selective adsorption and service bundling to preserve their value proposition.