
Therapeutic Drug Monitoring Market Size and Share
Market Overview
| Study Period | 2022 - 2031 |
|---|---|
| Market Size (2026) | USD 1.48 Billion |
| Market Size (2031) | USD 2.29 Billion |
| Growth Rate (2026 - 2031) | 9.03 % |
| Fastest Growing Market | Asia-Pacific |
| Largest Market | North America |
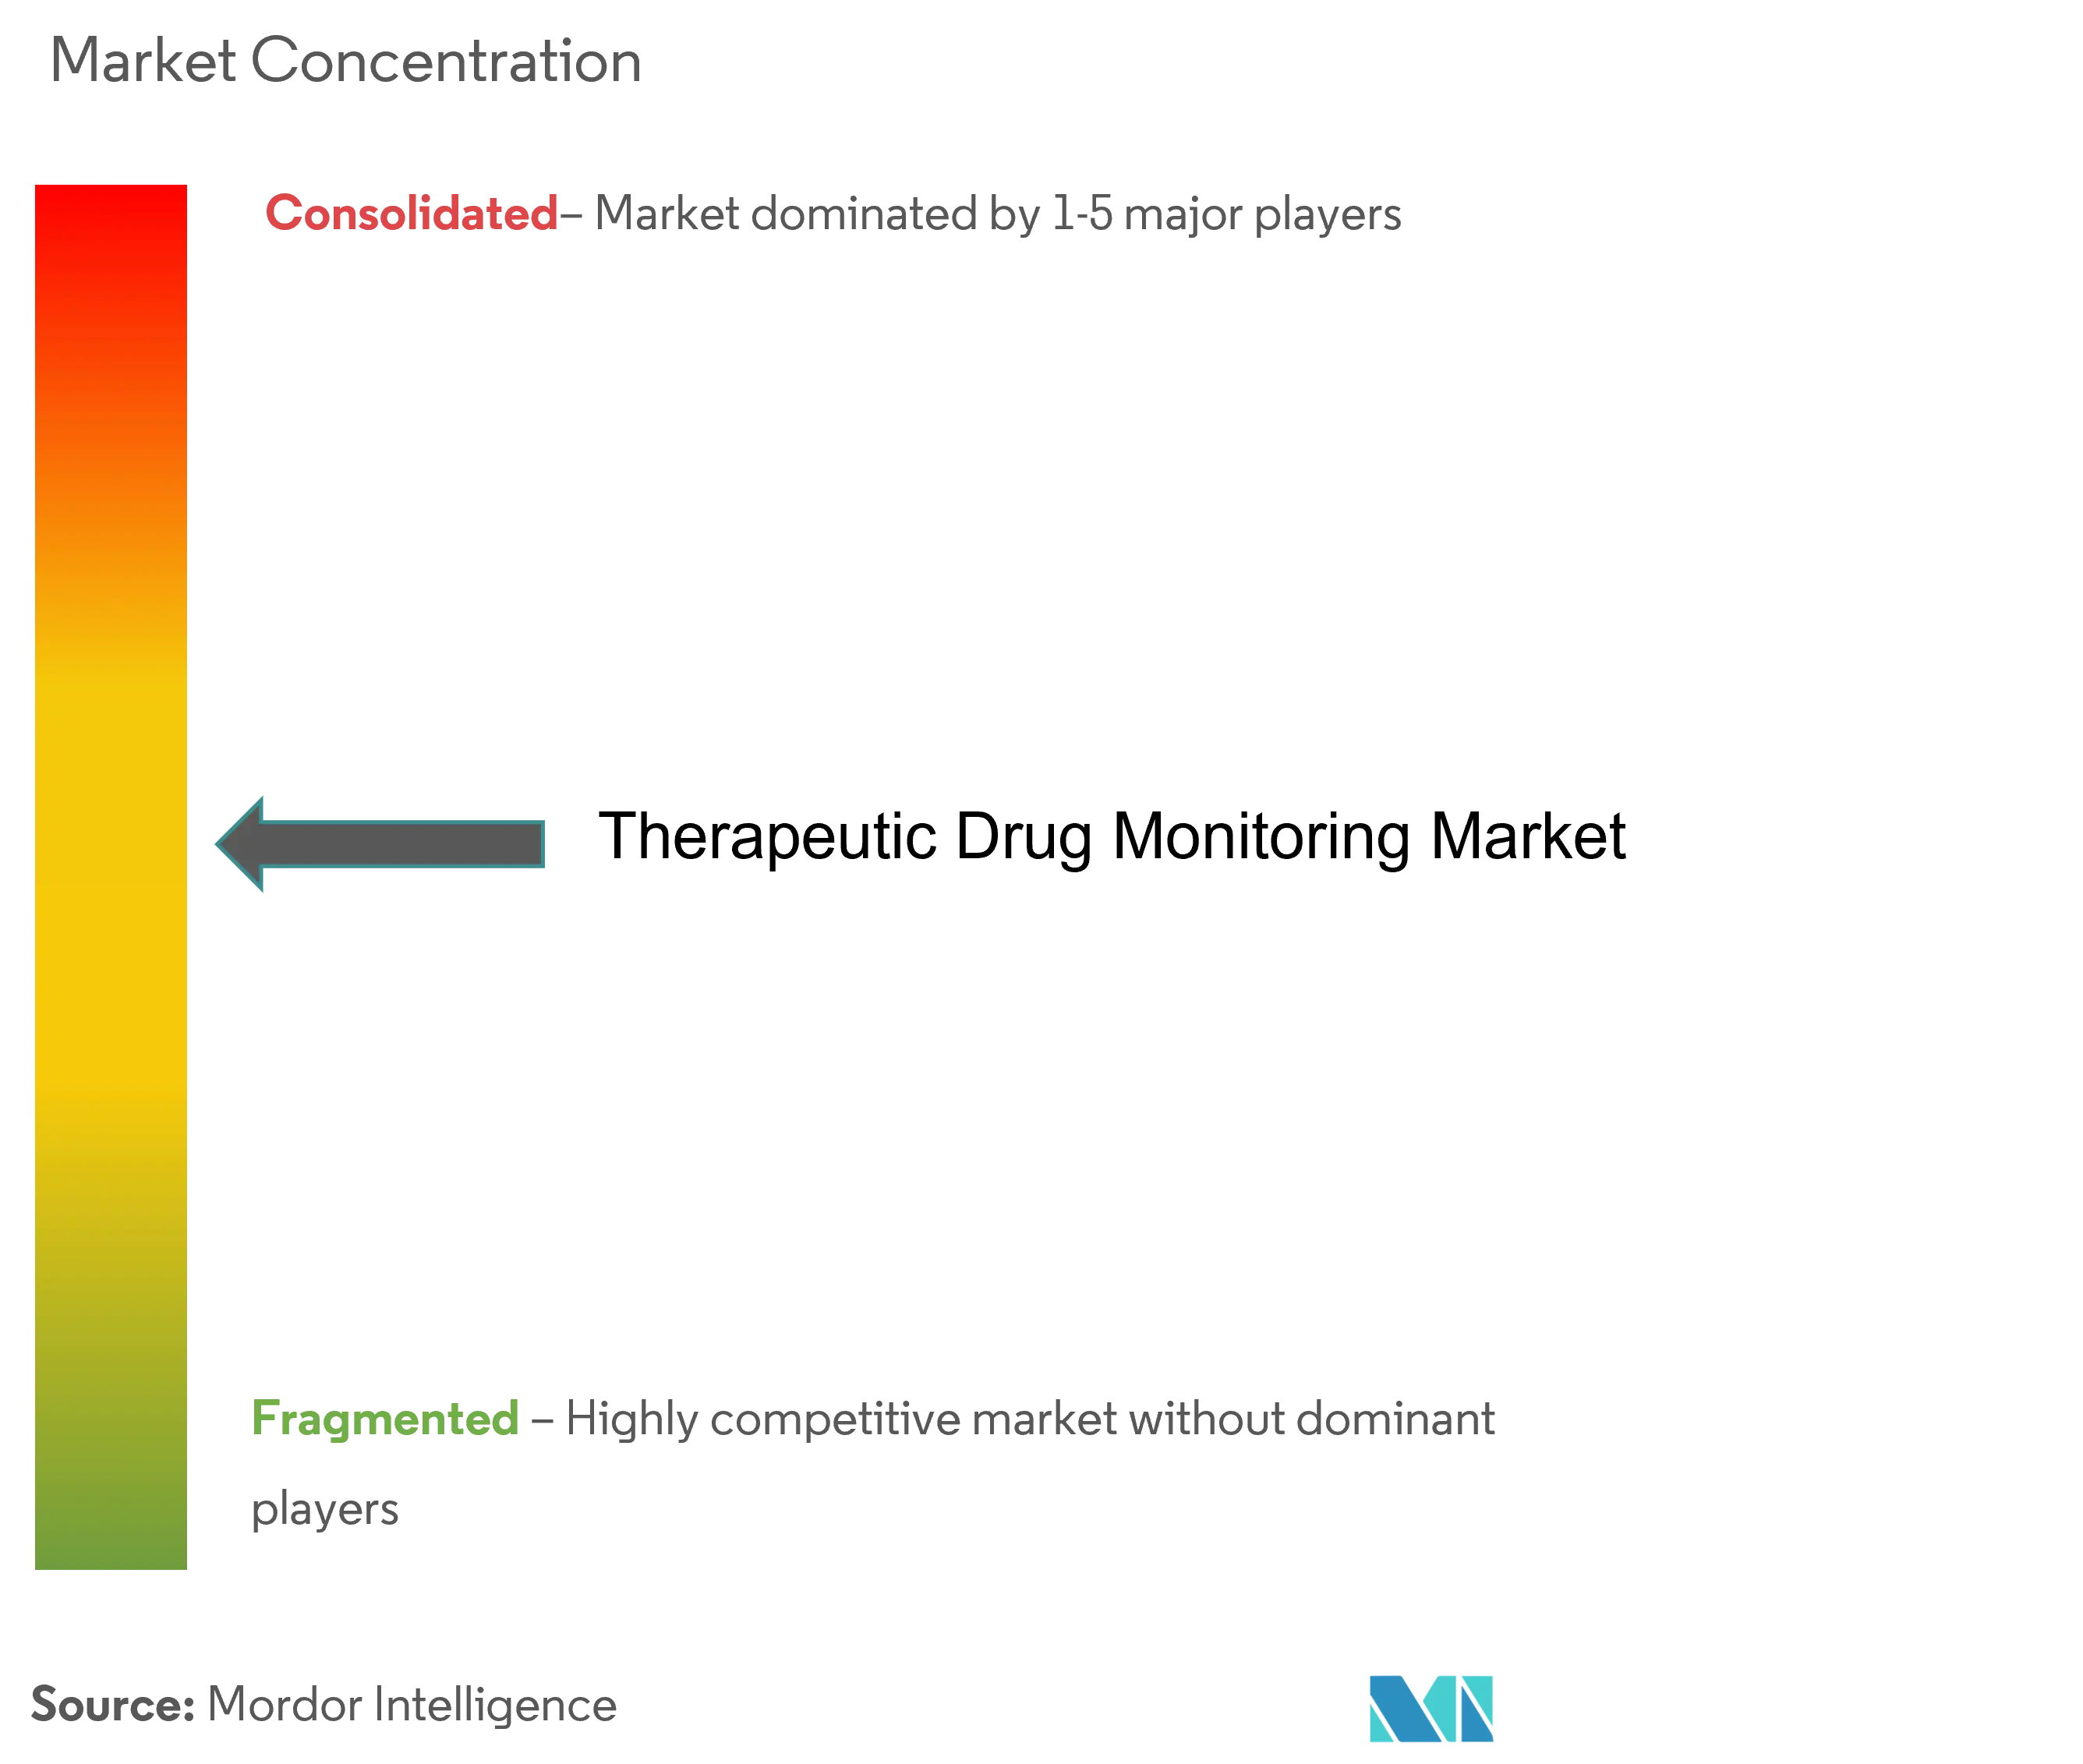
| Market Concentration | Medium |
Major Players *Disclaimer: Major Players sorted in no particular order Image © Mordor Intelligence. Reuse requires attribution under CC BY 4.0. | |
Therapeutic Drug Monitoring Market Analysis by Mordor Intelligence
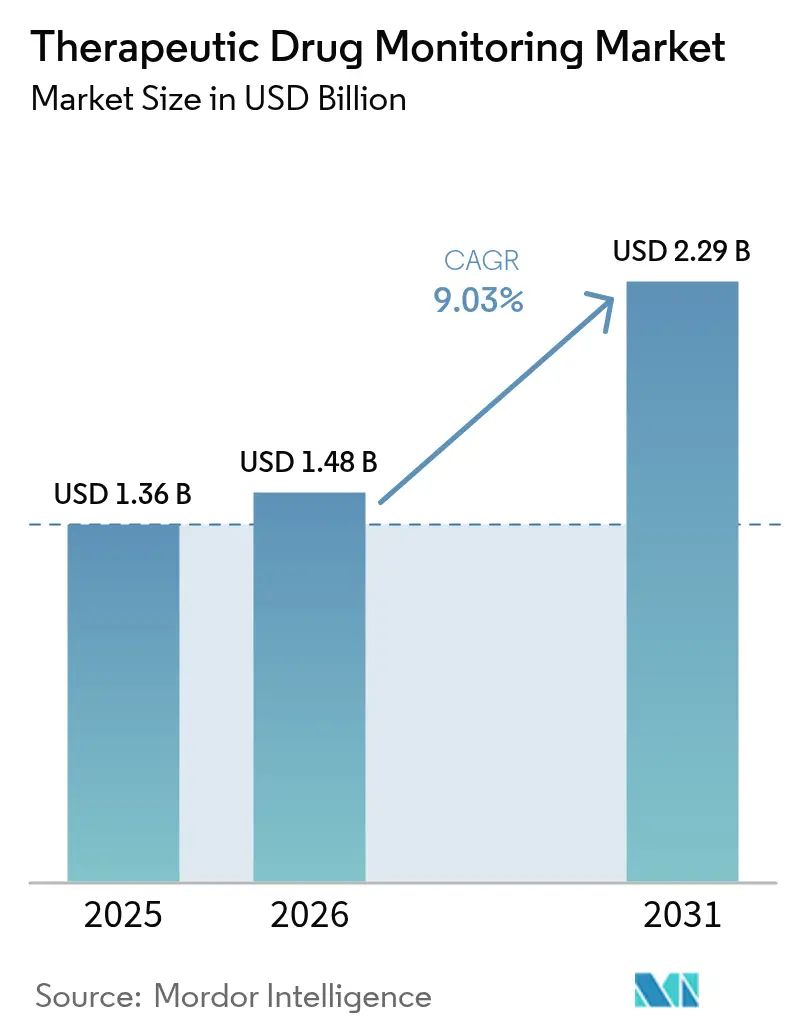
The Therapeutic Drug Monitoring Market size was valued at USD 1.36 billion in 2025 and estimated to grow from USD 1.48 billion in 2026 to reach USD 2.29 billion by 2031, at a CAGR of 9.03% during the forecast period (2026-2031).
Rising adoption of precision-medicine programs, integration of pharmacogenomic decision tools, and expanding decentralized clinical-trial activity anchor this expansion, while cost-pressured hospital systems increasingly favor high-throughput core-lab automation to sustain routine testing volumes. Continuous biosensor platforms and dried-blood-spot sampling are widening access well beyond tertiary centers, enabling remote dose titration and reducing adverse-event risk across oncology, HIV, and autoimmune therapy protocols. Regulatory alignment, including the United States Food and Drug Administration’s phased oversight of laboratory-developed tests, is expected to raise quality baselines and accelerate payer acceptance of broader test panels. Nonetheless, capital constraints in emerging markets continue to limit deployment of liquid-chromatography tandem mass-spectrometry (LC-MS/MS) analyzers, tempering penetration of highly specific assays.
Key Report Takeaways
- By technology, immunoassays led with a 58.74% revenue share in 2025, whereas biosensor-based platforms are projected to expand at a 9.74% CAGR through 2031.
- By drug class, antiepileptic agents accounted for 31.88% of the therapeutic drug monitoring market share in 2025, while oncology therapeutics are set to grow at 9.55% CAGR to 2031.
- By end user, hospital laboratories held 55.05% of the market size in 2025; point-of-care sites are advancing at a 10.03% CAGR through 2031.
- By geography, North America commanded 41.80% revenue share in 2025, whereas Asia-Pacific is forecast to register a 10.27% CAGR during 2026-2031.
Note: Market size and forecast figures in this report are generated using Mordor Intelligence’s proprietary estimation framework, updated with the latest available data and insights as of 2026.
Market Trends and Insights
Drivers Impact Analysis of Therapeutic Drug Monitoring Market*
| Driver | (~) % Impact on CAGR Forecast | Geographic Relevance | Impact Timeline |
|---|---|---|---|
| Rising prevalence of oncology, HIV, autoimmune & cardiac cases | +2.1% | Global; strongest influence in North America & Europe | Medium term (2-4 years) |
| Expansion of clinical trials & companion-diagnostic mandates | +1.8% | Global; concentrated in major pharmaceutical hubs | Short term (≤ 2 years) |
| Automation & high-throughput immunoassay adoption in core labs | +1.5% | North America & Europe, expanding to Asia-Pacific | Medium term (2-4 years) |
| Low-cost dried-blood-spot sampling enabling remote TDM | +1.3% | Global; particularly impactful in emerging markets | Long term (≥ 4 years) |
| Integration of pharmacogenomic data with TDM algorithms | +1.2% | Developed markets initially; global expansion | Long term (≥ 4 years) |
| Wearable micro-fluidic biosensors for real-time drug-level tracking | +0.9% | Technology-advanced markets; gradual global adoption | Long term (≥ 4 years) |
| Source: Mordor Intelligence | |||
Rising Prevalence of Oncology, HIV, Autoimmune & Cardiac Cases
Cancer protocols increasingly pair small-molecule kinase inhibitors with monoclonal antibodies, creating narrow therapeutic margins that mandate precise serum-level control to avoid suboptimal tumor inhibition or dose-limiting toxicity [1]. Long-acting cabotegravir–rilpivirine combinations for HIV expand monitoring horizons beyond daily oral dosing, requiring confirmation of sustained trough concentrations over monthly or bi-monthly intervals. Autoimmune conditions now routinely employ biologic disease-modifying agents whose clearance rates vary with anti-drug antibody formation, and therapeutic drug monitoring provides an evidence-based path to differentiate primary non-response from immunogenic loss of efficacy. Cardiovascular cases driven by aging populations reinforce volume growth for digoxin and antiarrhythmic level checks to avert iatrogenic toxicity. Together, these disease burdens add consistent patient cohorts to the market, underpinning predictable test-volume increases.
Expansion of Clinical Trials & Companion-Diagnostic Mandates
Regulators now expect dose-optimization evidence across diverse genotypes and comorbidity profiles during pivotal trials, firmly embedding therapeutic drug monitoring into study protocols. Sponsors therefore integrate sample-to-insight workflows that merge LC-MS/MS analytics with pharmacogenomic algorithms, enabling adaptive dosing arms and reducing late-stage attrition. Decentralized trial models accelerate adoption of mailed dried-blood-spot kits, preserving data fidelity while minimizing site visits. Positive experience in trials subsequently informs post-marketing label expansions that specify serum-level guidance, which in turn grows routine clinical demand. The feedback loop converts clinical-development spending into durable revenue streams for assay manufacturers and service laboratories across the market.
Automation & High-Throughput Immunoassay Adoption in Core Labs
Fourth-generation benchtop analyzers integrate pre-analytical robotics, microfluidic reagent packs, and middleware that feeds results into laboratory information systems without manual transcription. Combined with AI-enabled predictive maintenance, uptime surpasses 97%, raising daily throughput beyond 10,000 tests on high-volume campuses. Reduced reagent costs and minimal hands-on time improve profit margins, allowing health-systems to extend test menus to lower reimbursement drugs that were once outsourced. Core labs thereby consolidate hospital networks’ demand, mitigating the clinical toxicologist shortage by leveraging standardized, algorithm-driven interpretive reports. As a result, institutional buyers gravitate toward full-suite vendors, reinforcing brand loyalty and heightening barriers to entry across the therapeutic drug monitoring market.
Low-Cost Dried-Blood-Spot Sampling Enabling Remote TDM
Micro-capillary collection cards store whole blood at ambient temperatures for up to three weeks with negligible analyte degradation, removing refrigerated logistics and expediting rural outreach. Self-collection lowers patient burden and improves adherence to monitoring schedules, leading to richer longitudinal datasets that refine dosing algorithms. Public health programs in Southeast Asia, Latin America, and sub-Saharan Africa now pilot mail-in therapeutic drug monitoring kits for tuberculosis and HIV, demonstrating 30% turnaround-time reductions relative to clinic-based draws. Health insurers recognize downstream savings from avoided adverse events, strengthening reimbursement prospects. Consequently, dried-blood-spot workflows extend the market to populations previously beyond the reach of centralized phlebotomy services.
Restraints Impact Analysis of Therapeutic Drug Monitoring Market*
| Restraint | (~) % Impact on CAGR Forecast | Geographic Relevance | Impact Timeline |
|---|---|---|---|
| Capital & service-contract costs of LC-MS/MS platforms | -1.4% | Global; most severe in emerging markets | Short term (≤ 2 years) |
| Shortage of skilled clinical toxicologists in emerging nations | -0.9% | Emerging markets; growing impact in developed regions | Medium term (2-4 years) |
| Fragmented reimbursement coding for TDM panels | -0.8% | Primarily North America; parts of Europe | Medium term (2-4 years) |
| Data-exchange gaps between LIS & decision-support software | -0.6% | Global; varies by healthcare-system maturity | Long term (≥ 4 years) |
| Source: Mordor Intelligence | |||
Capital & Service-Contract Costs of LC-MS/MS Platforms
Entry-level triple-quadrupole systems list at USD 300,000–500,000, and annual maintenance contracts add USD 50,000, stretching budgets of secondary hospitals and private labs in low- and middle-income economies [2]. Even in developed markets, fiscal stewardship committees demand robust utilization forecasts before approving purchases. High acquisition thresholds perpetuate send-out testing, lengthening turnaround times and diminishing immediate clinical value, which in turn slows routine test adoption. Pooled-purchasing consortia and reagent-rental models partially mitigate cash-flow constraints, yet many facilities remain reliant on less specific immunoassays, limiting cross-reactivity-sensitive applications such as kinase inhibitors and immunotherapies across the therapeutic drug monitoring market.
Shortage of Skilled Clinical Toxicologists in Emerging Nations
Although automation reduces manual pipetting and calibration steps, expert oversight remains indispensable for method validation, trace-level troubleshooting, and clinical interpretation [3]. Training pipelines lag technological complexity; only 10 African universities offer accredited clinical toxicology programs, and attrition to higher-paying pharmaceutical roles exacerbates staffing gaps. Consequently, laboratory directors in South Asia and Latin America adopt narrower therapeutic drug monitoring panels, focusing on antiepileptics and immunosuppressants while deferring oncology assays that carry greater interpretive nuance. Remote-consultation networks are emerging yet cannot fully compensate, keeping skilled-labor scarcity a persistent drag on the therapeutic drug monitoring market’s full potential.
*Our forecasts treat driver/restraint impacts as directional, not additive. The impact forecasts reflect baseline growth, mix effects, and variable interactions.
Therapeutic Drug Monitoring Market Segment Analysis
By Technology:
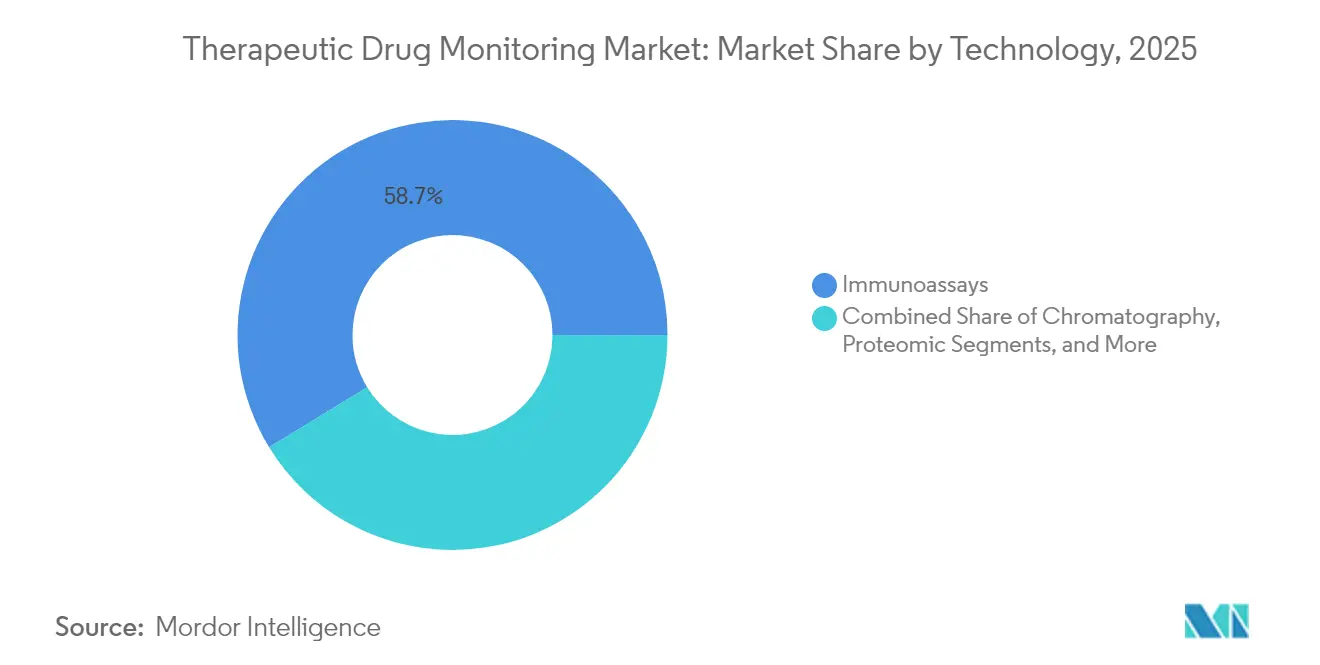
Immunoassays Dominate Despite Biosensor DisruptionImmunoassays generated the largest revenue portion of the therapeutic drug monitoring market size, holding a 58.74% share in 2025. Integration into legacy chemistry lines, consistent reimbursement coding, and technician familiarity sustain this lead. However, biosensor and wearable platforms are recording a 9.74% CAGR, underpinned by electrochemical transduction advances that enable in-situ drug-level readouts from interstitial fluid. Mass-spectrometry-linked immunochemical hybrids widen menus to encompass small-molecule oncology agents, further reinforcing the incumbent technology’s relevance.
Protein-binding interference, hook effects, and cross-reactivity limitations have propelled tertiary centers toward chromatographic and LC-MS/MS solutions for complex regimens, fortifying multivendor competition. Continuous wearables prototype pipelines, meanwhile, promise sub-minute sampling intervals, redefining therapeutic drug monitoring market paradigms from episodic draws to dynamic pharmacokinetic profiling. Venture-backed start-ups align with pharmaceutical sponsors to pair devices with long-acting injectables, accelerating clinical validation. As regulatory pathways clarify, competitive dynamics will increasingly hinge on usability, data-security architecture, and algorithmic dosing guidance rather than analytical sensitivity alone.

By Drug Class:
Oncology Therapies Drive Future GrowthAntiepileptic formulations represented 31.88% of 2025 revenue, mirroring entrenched guidelines requiring routine serum-level checks for valproate, carbamazepine, and related agents. Oncology therapeutics, however, are projected to surge at a 9.55% CAGR through 2031, positioning them as the fastest-growing slice of the market. Precision oncology mandates individually titrated kinase inhibitor doses to optimize tumor exposure and mitigate systemic toxicity, catalyzing broad deployment of LC-MS/MS multiplex panels.
Immunosuppressants retain robust volumes across transplant centers, while renewed stewardship initiatives elevate vancomycin and aminoglycoside monitoring to curb nephrotoxicity. Psychiatric agents such as clozapine remain mandatory candidates, yet broader antipsychotic monitoring adoption hinges on payer policy harmonization. Pharmacogenomic overlay further differentiates dosing paths, effectively merging pre-emptive genotyping with post-dose serum confirmation, a convergence that strengthens the therapeutic drug monitoring market’s strategic relevance across specialties.
By End-User:
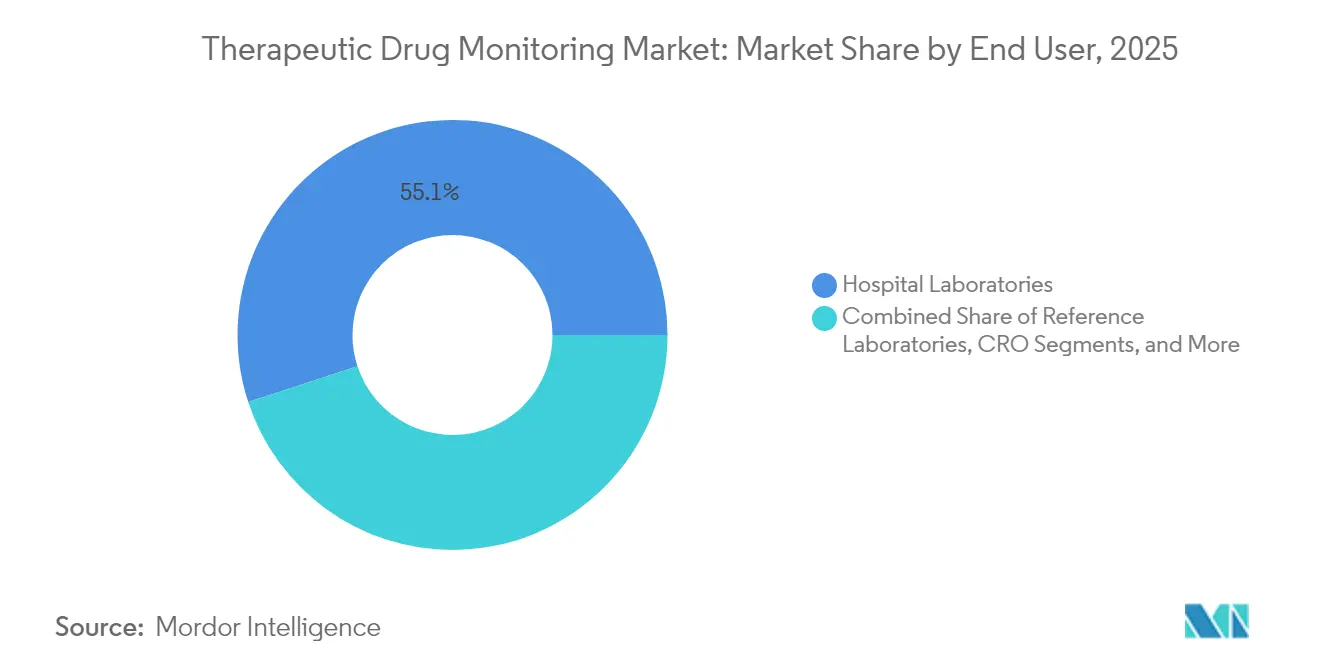
Point-of-Care Testing Disrupts Hospital DominanceHospital laboratories controlled 55.05% of the therapeutic drug monitoring market share in 2025. Their advantage derives from embedded LIS connectivity, existing billing pathways, and clinical proximity for sample collection. Yet point-of-care hubs—ambulatory clinics, dialysis units, and home-based devices—are expanding at a 10.03% CAGR, fueled by compact analyzers delivering results in under 15 minutes from finger-stick blood.
Reference laboratories safeguard specialized assay demand, concentrating high-complexity workflows and benefiting from scale economies. Academic centers maintain early-adopter status, piloting novel biomarkers and wearable integrations. Contract research organizations bolster their service portfolios to accommodate nuanced trial endpoints, underscoring the therapeutic drug monitoring market’s role across R&D and routine care. Digital-health overlays translate numeric drug levels into smartphone alerts, bridging clinician and patient, and reinforcing adherence to therapeutic windows.
Geography Analysis
The Americas, Europe, APAC and Middle East Therapeutic Drug Monitoring Market
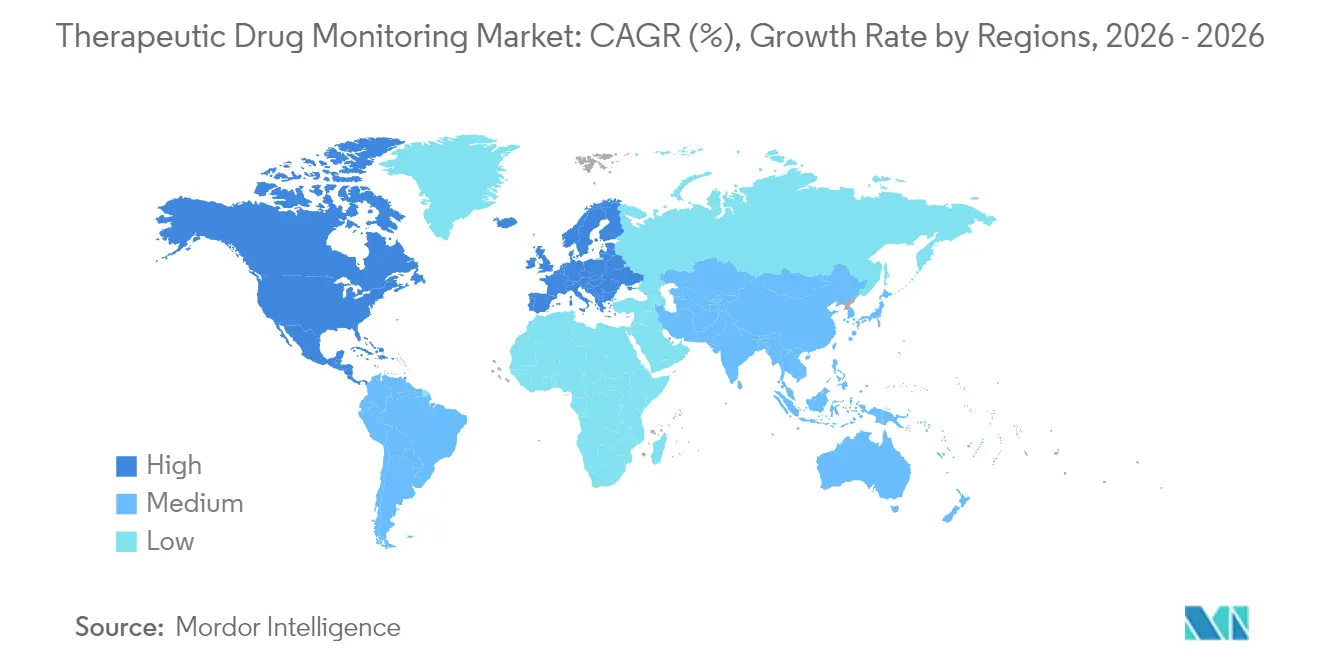
North America’s 41.80% contribution to the therapeutic drug monitoring market size in 2025 stems from entrenched reimbursement, extensive transplant programs, and pharmacogenomic leadership. Europe mirrors this maturity, albeit under cost-containment pressures that prioritize consolidated procurement and outcome-based pricing. Asia-Pacific exhibits a 10.27% CAGR through 2031, reflecting hospital construction booms, clinical-trial inflows, and national precision-health initiatives. China commands the region’s volume uplift, coupling public-sector infrastructure funding with stringent regulatory reforms that encourage local LC-MS/MS manufacturing. Japan’s super-aged demographics sustain high per-capita test ratios, while India’s expanding health-insurance coverage widens patient access to essential monitoring panels. Middle East and South America show nascent yet accelerating adoption curves as laboratory automation vendors partner with government agencies to modernize diagnostic capabilities, an endeavor that incrementally enlarges the therapeutic drug monitoring market.
Regulatory Landscape
Regulatory oversight is tightening for laboratory-developed tests (LDTs) used in therapeutic drug monitoring, alongside long-standing IVD requirements. In the United States, the FDA published its Final Rule in May 2024 to treat LDTs as medical devices under phased enforcement, with the first phase of the transition starting on May 6, 2025. This increases quality-system, documentation, and, for applicable tests, premarket expectations for laboratories and kit developers supporting narrow-therapeutic-index drug management.
In Europe, Regulation (EU) 2017/745 (MDR) remains the core framework for medical devices, with consolidated versions in effect in 2026, while COM(2025) 1023 proposes targeted changes across MDR and IVDR to streamline parts of the compliance burden and expert-support processes. Internationally, clinical-laboratory quality anchors such as ISO 17511:2020 (metrological traceability) were reviewed and confirmed in 2026, and ISO/CD TS 25646 (analytical performance specifications) advanced through Committee Draft review with comments closing in May 2026. These updates reinforce traceability and performance requirements for assays used in dose-adjustment workflows.
Value Chain Analysis
The therapeutic drug monitoring value chain covers assay and instrument design, critical raw-material sourcing, manufacturing and quality control, distribution and service, and downstream testing and interpretation in hospital, reference, CRO, and academic laboratories. Upstream inputs include monoclonal antibodies, recombinant proteins and enzymes for immunoassays, chemiluminescence components, high-purity chromatography solvents, and isotopically labeled internal standards for LC-MS/MS workflows.
Manufacturing and deployment vary by complexity: LC-MS/MS platforms depend on specialized manufacturing and applications-support footprints and are commonly supported through direct field-service models, while point-of-care devices and consumables rely more heavily on distributor networks. Bottlenecks include single-source specialty chemical synthesis, cold-chain handling for sensitive reagents, and closed-system instrumentation strategies that restrict open-channel reagent access, which increases switching costs for laboratories. Downstream, integrated delivery networks and core-lab automation concentrate purchasing power and favor enterprise contracts, while connectivity requirements (LIS integration and secure data exchange into dosing decision tools) increasingly shape vendor selection and post-sale service intensity.
Competitive Landscape
The therapeutic drug monitoring market is moderately consolidated. Abbott, Thermo Fisher, Roche, Siemens Healthineers, and Danaher leverage full-line diagnostic portfolios and established service footprints to protect incumbent positions. Their competitive edge lies in end-to-end offerings—sample collection devices, automation-ready analyzers, assay reagents, and middleware decision-support—that simplify procurement for hospital chains.
Mid-tier firms focus on niche innovation. Bio-Rad exploits multiplex immunoassay panels to shorten turnaround times for transplant monitoring, while niche start-ups deploy cloud-native dashboards that translate biosensor readings into dose-adjustment guidance within minutes. Strategic acquisitions characterize the past two years: Siemens Healthineers absorbed a wearable-sensor developer to accelerate outpatient revenue, and Thermo Fisher integrated an AI algorithm vendor to enhance LC-MS/MS interpretive reporting.
Collaborations between device makers and pharmaceutical companies are intensifying. Oncology drug sponsors embed proprietary assays into clinical-trial protocols to streamline regulatory filings, guaranteeing initial instrument placements. Reagent-rental contracts and outcomes-based pricing models are gaining traction, reflecting broader value-based-care trends. Vendors investing in cybersecurity layers and standardized data interoperability position themselves favorably as digital-health ecosystems mature, shaping long-term contest for therapeutic drug monitoring market leadership.
Therapeutic Drug Monitoring Industry Leaders
-
Thermo Fisher Scientific
-
Bio-Rad Laboratories
-
F. Hoffmann-La Roche Ltd
-
Danaher Corporation (Beckman Coulter, Inc.)
-
Siemens Healthcare GmbH
- *Disclaimer: Major Players sorted in no particular order
Therapeutic Drug Monitoring Market Companies Covered in this Report
- Abbott Laboratories
- Thermo Fisher Scientific
- F. Hoffmann-La Roche Ltd (Roche Diagnostics)
- Siemens Healthineers
- Danaher Corp (Beckman Coulter)
- Bio-Rad Laboratories
- Chromsystems Instruments & Chemicals
- Randox Laboratories
- Alpco Diagnostics
- ARK Diagnostics
- DiaSorin
- bioMérieux
- Tecan Group
- Waters Corporation
- Agilent Technologies
- Hitachi High-Tech Corp.
- Bruker Corp.
- JEOL Ltd.
- Quotient Ltd.
- LabCorp (Covance Labs)
Market Opportunities and Future Outlook
Decentralized sampling and near-patient workflows are creating whitespace in settings that cannot support LC-MS/MS capex or specialist staffing, particularly in emerging markets and for outpatient management of chronic therapies. Evidence from micro-sampling research in 2026 highlights practical routes to broaden access, including MSW2 microvolume liquid-phase microsampling reported for immunosuppressant quantification using as little as 5 microliters of blood. This supports clinical programs that want more frequent monitoring while reducing phlebotomy burden and fits the market shift toward dried-blood-spot and microvolume approaches for mailed kits, satellite clinics, and decentralized clinical-trial operations.
A second opportunity area is the convergence of TDM with precision decision support, combining pharmacogenomics and model-informed precision dosing. Thermo Fisher Scientific's TacroType pharmacogenetic test launch for tacrolimus dosing illustrates commercial movement toward genotype-informed starting doses that can be paired with concentration-based monitoring, and it complements hospital demand for standardized interpretive reporting within laboratory and EHR workflows. In Europe, ongoing clarification efforts around IVDR interpretation for investigational bioanalytical assays, including positions advanced by the European Bioanalysis Forum, point to process simplification for non-diagnostic research use. This supports CRO and sponsor adoption of broader monitoring panels without reclassifying early-phase bioanalysis as routine diagnostics.
Recent Industry Developments in Therapeutic Drug Monitoring Market
- April 2026: Bio-Rad Laboratories expanded its range of recombinant monoclonal anti-idiotypic antibodies by adding eight new specificities and introduced its first anti-Fc mutation antibody range for YTE-modified therapeutics. The update broadens reagent options used in bioanalysis and drug monitoring workflows for biologics and engineered antibody formats, supporting laboratories that need consistent reagents as therapeutic modalities diversify.
- February 2026: Thermo Fisher Scientific introduced the TacroType Pharmacogenetic Test, a laboratory developed test designed to inform tacrolimus dosing in transplant recipients using a buccal swab to determine CYP3A5 genotype. The launch strengthens the pharmacogenomics layer that complements concentration-based TDM, pushing vendors and labs toward integrated dose-initiation and follow-up monitoring pathways.
- December 2025: Roche announced CE Mark approval for an antibiotics drug monitoring mass spectrometry reagent pack as part of its cobas Mass Spec solution and positioned it within a 39-test in vitro diagnostic menu. This expands standardized, automated mass spectrometry offerings for routine TDM use in clinical laboratories, supporting a shift away from manual, lab-built methods toward regulated, scalable workflows.
Therapeutic Drug Monitoring Market Report Scope and Research Methodology
Market Definition and Coverage
This market covers testing used to measure drug levels in a patient sample and interpret results to support dose adjustment and safer therapy, mainly for narrow therapeutic index drugs. It includes routine monitoring performed through hospital labs and clinical labs using common analytical methods.
Scope exclusions: We exclude forensic toxicology, workplace or consumer drug screening, and research-only bioanalysis that is not tied to patient dosing decisions.
Segments Covered in This Report
- By Technology
- Immunoassays
- ELISA
- Chemiluminescence Immunoassay (CLIA)
- Fluorescence & Other IA Formats
- Proteomic / LC-MS/MS
- Chromatography (GC, HPLC)
- Biosensor-Based & Wearables
- Other Technologies
- Immunoassays
- By Drug Class
- Antiarrhythmic Drugs
- Antiepileptic Drugs
- Immunosuppressants
- Antibiotics (e.g., Vancomycin, Aminoglycosides)
- Antipsychotics & Mood Stabilizers
- Oncology & Targeted Therapies
- Other Drug Classes
- By End-user
- Hospital Laboratories
- Independent / Reference Laboratories
- Academic & Research Institutes
- Point-of-Care / Patient Self-Testing
- Contract Research & CRO Labs
- By Geography
- North America
- United States
- Canada
- Mexico
- Europe
- Germany
- United Kingdom
- France
- Italy
- Spain
- Rest of Europe
- Asia-Pacific
- China
- Japan
- India
- South Korea
- Australia
- Rest of Asia-Pacific
- Middle East
- GCC
- South Africa
- Rest of Middle East
- South America
- Brazil
- Argentina
- Rest of South America
- North America
Data Sources, Market Sizing, and Validation
Desk Research
Desk research is used to set the outer boundaries of the model and to anchor demand signals that can be observed publicly. We typically refer to sources such as the US FDA, the US CDC, the World Health Organization, and the US National Library of Medicine (PubMed) for guidance on drug safety, monitoring practice, and clinical evidence. Data points are also cross-checked using sources such as OECD health statistics, national health ministry portals, and selected customs trade data where relevant for lab equipment and reagents.
On the industry side, we review annual reports, 10-K style filings, investor presentations, and product documentation from companies active in lab diagnostics and clinical testing. When available, our team also uses paid subscriptions for company financials and intelligence, patent databases, and shipment-level import and export data to verify participation and direction of change. The specific desk sources mentioned here are illustrative only, and many other public references were also used for data collection, validation, and clarification.
Primary Interviews and Surveys
Primary work is used to translate clinical adoption into measurable testing volumes and realistic pricing. We speak with a mix of hospital lab leaders, clinical lab decision-makers, lab managers, and domain experts across APAC, EMEA, and the Americas to validate test mix, run rates, and how frequently repeat monitoring happens for key drug classes. These interviews also help us stress-test assumptions from desk research, and they close gaps where published statistics do not clearly separate routine therapeutic monitoring from adjacent toxicology testing.
Distribution of primary research fieldwork respondents
| Company type | Respondent position | Region |
|---|---|---|
| Top tier: 27% | CXOs: 17% | APAC: 43% |
| Mid tier: 53% | Functional/Unit leaders: 33% | EMEA: 30% |
| Smaller Players: 20% | Managers: 50% | Americas: 27% |
Market-Sizing & Forecasting
Sizing starts from a top-down demand pool built using observed patient care activity and lab testing intensity, which are then converted into annual testing volumes and value. In practice, we map likely monitoring demand using inputs such as the use of narrow therapeutic index drugs, transplant and oncology treatment activity, anti-infective use in complex cases, hospital admissions tied to drug safety risk, and the share of monitoring performed through immunoassays versus LC-MS/MS (which affects average pricing and throughput). After the model is built, we run selective bottom-up checks using supplier presence by region, sampled pricing ranges for key assay types, and channel feedback on typical utilization rates. Totals are adjusted if these checks indicate consistent gaps.
For forecasting, scenario analysis is applied around two to four drivers that respondents consistently flag as sensitive. These include guideline adoption pace, laboratory automation upgrades, and reimbursement or budget pressure that changes how often monitoring is ordered. Where bottom-up visibility is weaker, especially in smaller country markets, we treat the gap using proxy indicators like hospital lab capacity expansion and external quality program participation, then re-check the implied test volumes with interview feedback before finalizing the curve.
Data Validation & Update Cycle
Validation is done through multiple checks so results do not rely on one data stream. We compare modeled value against independent signals such as country-level healthcare activity trends, published clinical testing capacity indicators, and company-level diagnostics revenue direction, then investigate outliers that do not fit the story. Assumptions that drive larger swings, such as test frequency per patient and price progression, are reviewed by a second analyst and are re-confirmed with experts if the variance is material.
Reports are refreshed annually, and interim updates are triggered when meaningful events occur, such as major regulatory changes, shifts in reimbursement, or sudden disruptions in laboratory operations. Before delivery, a final pass is done to incorporate the latest publicly available releases so clients receive an updated view.
Mordor Intelligence's Therapeutic Drug Monitoring Market Size Versus Other Published Estimates
Published numbers for therapeutic drug monitoring often look different because each publisher draws the market boundary in its own way, and each chooses a specific base year and forecast window. Differences also come from how testing volume is converted into value, particularly when pricing and test mix shift across settings like hospital labs and independent clinical labs.
Testing volume signals from clinical adoption patterns and lab throughput checks are used to keep Mordor Intelligence's 2025 estimate aligned to routine dose-monitoring demand, instead of letting adjacent toxicology and research-only bioanalysis inflate the total. Other published figures can diverge when they use longer horizon forecasts with broader inclusions, apply aggressive or conservative pricing curves, or rely on a single reference year without re-contacting experts when key assumptions shift.
Benchmark comparison
| Source | Market Size | Gaps in Research Methodology |
|---|---|---|
| Mordor Intelligence | USD 1.36 B (2025) | |
| Global Research House A | USD 1.94 B (2025) | Uses a broader definition that can bundle adjacent clinical testing categories and wider solution components, which can lift the 2025 total even if routine dose-monitoring volumes are similar. |
| Industry Publisher B | USD 1.40 B (2025) | Keeps the market closer to core therapeutic monitoring, but its value build appears to lean more on a single year price assumption and a longer forward window, which can shift the current-year total when currency timing and test mix are not refreshed. |
The spread in the table is mainly explained by what gets counted as therapeutic monitoring and how value is built from test frequency and pricing. By keeping scope tied to routine dose adjustment use cases and by re-checking volume and pricing assumptions during validation, our estimate stays easier to trace back to clear demand drivers and repeatable steps.
Key Questions Answered in the Report
How big is the Therapeutic Drug Monitoring Market?
The Therapeutic Drug Monitoring Market size is expected to reach USD 1.48 billion in 2026 and grow at a CAGR of 9.03% to reach USD 2.29 billion by 2031.
Which technology segment dominates the therapeutic drug monitoring market?
Immunoassays dominate with a 58.74% revenue share in 2025, though biosensor platforms are the fastest-growing at 9.74% CAGR.
Who are the key players in Therapeutic Drug Monitoring Market?
Thermo Fisher Scientific, Bio-Rad Laboratories, F. Hoffmann-La Roche Ltd, Danaher Corporation (Beckman Coulter, Inc.) and Siemens Healthcare GmbH are the major companies operating in the Therapeutic Drug Monitoring Market.
Which is the fastest growing region in Therapeutic Drug Monitoring Market?
Government-backed hospital expansion, surging clinical-trial activity, and health-technology investments are generating a 10.27% CAGR through 2031 in Asia-Pacific.
Which region has the biggest share in Therapeutic Drug Monitoring Market?
In 2025, the North America accounts for the largest market share in Therapeutic Drug Monitoring Market.
What are the main restraints limiting wider adoption?
High capital costs for LC-MS/MS instruments and a shortage of trained clinical toxicologists—especially in emerging economies—continue to impede broader implementation.