
Thalassemia Treatment Market Size and Share
Market Overview
| Study Period | 2020 - 2031 |
|---|---|
| Market Size (2026) | USD 8.21 Billion |
| Market Size (2031) | USD 9.76 Billion |
| Growth Rate (2026 - 2031) | 3.52 % |
| Fastest Growing Market | Asia Pacific |
| Largest Market | North America |
| Market Concentration | Medium |
Major Players *Disclaimer: Major Players sorted in no particular order Image © Mordor Intelligence. Reuse requires attribution under CC BY 4.0. | |
Thalassemia Treatment Market Analysis by Mordor Intelligence
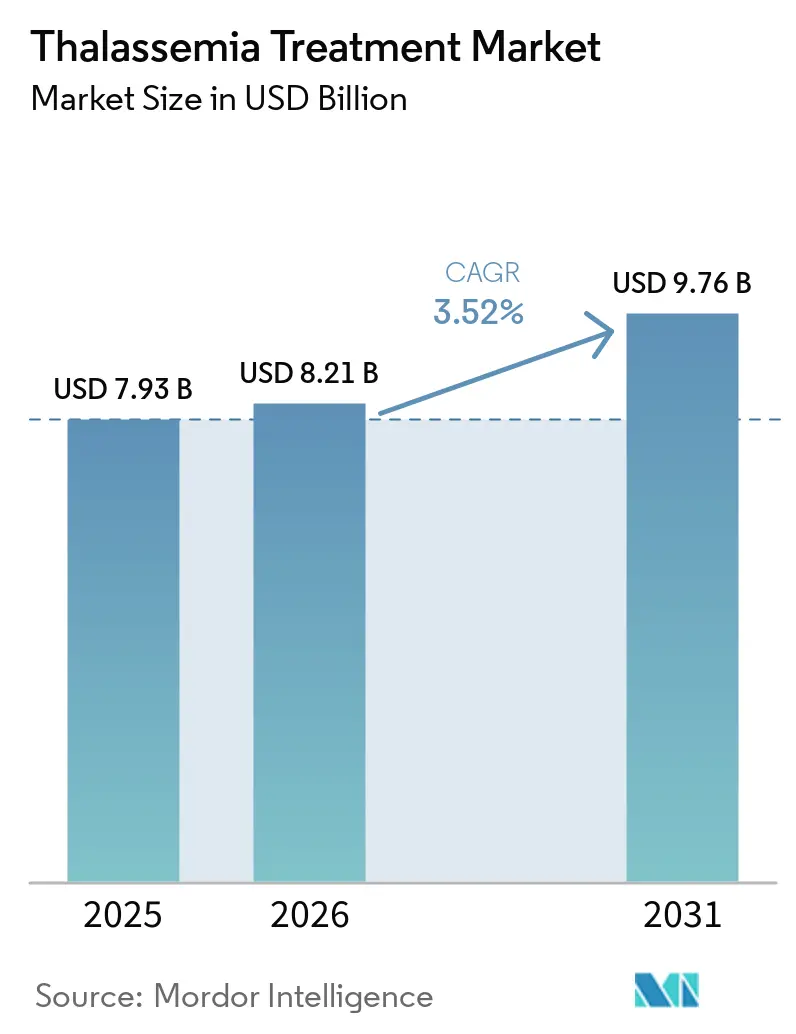
Thalassemia treatment market size in 2026 is estimated at USD 8.21 billion, growing from 2025 value of USD 7.93 billion with 2031 projections showing USD 9.76 billion, growing at 3.52% CAGR over 2026-2031. The thalassemia treatment market continues moving from supportive care to curative gene-editing solutions following the landmark approvals of CASGEVY and ZYNTEGLO in major economies FDA. Consistent demand from roughly 300,000 patients worldwide who live with severe forms of the disorder underpins revenue stability, even as curative options begin to narrow, transfusion volumes BDgene. Novel therapies, AI-enabled diagnostics and specialty clinic infrastructure are reshaping how payers, providers and manufacturers allocate resources inside the thalassemia treatment market. Investor confidence remains high, as illustrated by Carlyle and SK Capital’s purchase agreement for Bluebird Bio that hinges on ambitious USD 600 million sales milestones by 2027 Bluebird Bio. At the same time, access and affordability pressures—especially the USD 2.2 million list price for gene therapy—temper near-term adoption, forcing health systems to weigh large up-front payments against USD 5.4 million lifetime costs of conventional care HemaSphere.
Key Report Takeaways
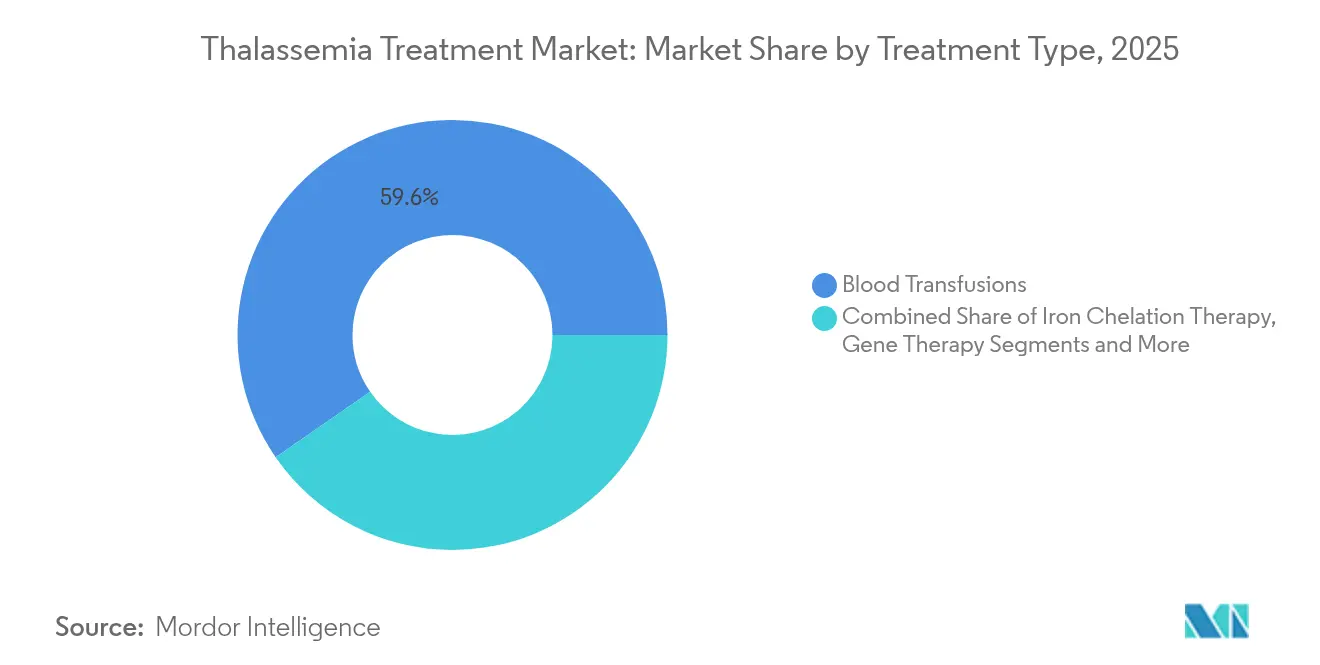
- By treatment type, blood transfusions dominated with a 59.62% share of the thalassemia treatment market in 2025, while gene therapy is on course for the fastest 12.97% CAGR through 2031.
- By disease type, beta thalassemia held 71.05% of thalassemia treatment market share in 2025; beta thalassemia major exhibits the quickest 9.23% expansion outlook to 2031.
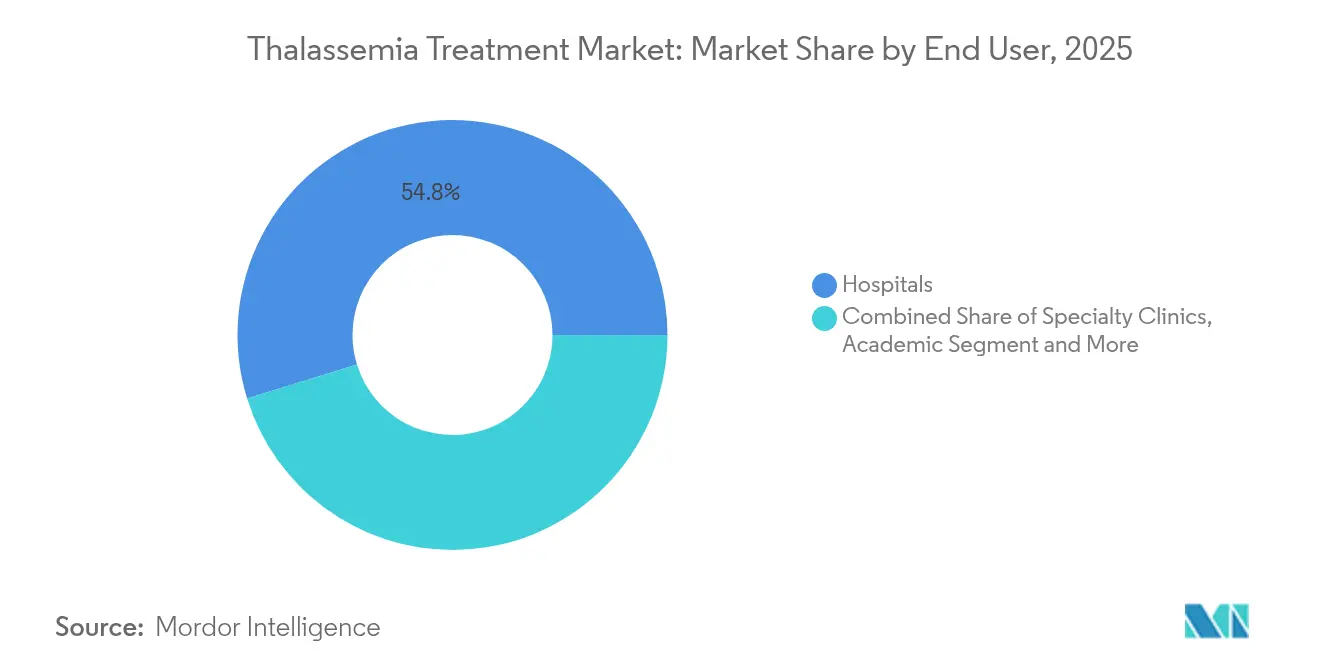
- By end user, hospitals accounted for 54.78% revenue in 2025, yet specialty clinics post an 8.18% CAGR as the preferred sites for gene-therapy delivery.
- By geography, Asia Pacific captured 48.12% of the thalassemia treatment market in 2025, whereas the Middle East & Africa region is projected to climb at a 7.01% CAGR through 2031.
Note: Market size and forecast figures in this report are generated using Mordor Intelligence’s proprietary estimation framework, updated with the latest available data and insights as of 2026.
Market Trends and Insights
Drivers Impact Analysis of Thalassemia Treatment Market*
| Driver | (~) % Impact on CAGR Forecast | Geographic Relevance | Impact Timeline |
|---|---|---|---|
| Rising Prevalence Of Thalassemia | +0.80% | Global, concentrated in Mediterranean, South Asia, Southeast Asia | Long term (≥ 4 years) |
| Increasing Awareness & Screening Programmes | +0.60% | Asia Pacific, Middle East & Africa, with expansion to North America & EU | Medium term (2-4 years) |
| Regulatory Approvals Of Advanced Gene Therapies | +1.20% | North America & EU primary, expanding to Asia Pacific | Short term (≤ 2 years) |
| Inclusion Of Thalassemia In Newborn Genomic Panels | +0.40% | Global, with early adoption in developed markets | Long term (≥ 4 years) |
| Low-Cost Oral Iron Chelators Improving Adherence | +0.30% | Global, particularly impactful in emerging markets | Medium term (2-4 years) |
| AI-Driven Blood-Match Algorithms Lowering Allo-Immunisation | +0.20% | Global, with faster adoption in technology-advanced healthcare systems | Medium term (2-4 years) |
| Source: Mordor Intelligence | |||
Rising Prevalence of Thalassemia
China hosts 47.48 million carriers and reports more than 20,000 affected births every year.[1]Comprehensive genetic screening uncovers additional undiagnosed cases and keeps the thalassemia treatment market expanding. Comparable patterns emerge in the Philippines, where 69.22% of tested individuals are positive, and alpha thalassemia dominates 65.77% of those in. High carrier frequencies of roughly 5% for alpha and 4% for beta thalassemia in southern China demand robust treatment capacity. In the Mediterranean, incidence varies widely—36.8 cases per 100,000 in southern countries versus 15.9 per 100,000 farther north, HAL Science. Together, these epidemiological realities secure long-run volume for every major therapy class.
Increasing Awareness & Screening Programmes
Newborn initiatives deliver earlier diagnoses and reshape patient funnels into the thalassemia treatment market. Saudi Arabia screened 5,715 babies and flagged 25.7% as positive, increasing the number of eligible patients for counseling and therapy. Denmark’s 16-year run saw diagnostic exams rise fivefold and yielded 5,142 trait and 136 intermediate/major confirmations.[2] Iowa’s two-decade data set proves hemoglobinopathy screening’s maturing relevance. The WHO’s prevention-first playbook reduced incidence across Cyprus, Greece, and Italy, showing that screening and prenatal counseling complement rather than diminish downstream therapy demand.
Regulatory Approvals of Advanced Gene Therapies
The FDA’s 2024 clearance of CASGEVY introduced CRISPR gene editing as a practical cure for transfusion-dependent beta thalassemia AABB. Ninety-one percent of recipients achieved transfusion independence, a result echoed by EMA’s conditional approval, where 39 of 42 patients sustained hemoglobin above 9 g/dL EMA. Vertex opened nine centers to deliver the product and priced treatment at USD 2.2 million, a figure benchmarked against lifetime costs of USD 5.4 million. Late-stage candidates such as BDgene’s lentiviral therapy signal a pipeline on track to widen over the forecast period. Regulatory endorsements, therefore, accelerate market uptake and cement payer frameworks.
Inclusion of Thalassemia in Newborn Genomic Panels
Genomic screens bundle thalassemia with a broad set of diseases, using long-read sequencing to detect complex variants. Molecular Cytogenetics. Discovery of the αααα280 duplication in Chinese families, Orphanet Journal illustrated how next-generation methods sharpen diagnostic accuracy, modify counseling, and steer care early in life.[3] Falling per-sample costs make these panels viable for population-scale programs, reinforcing the thalassemia treatment market’s patient base far into the future.
Restraints Impact Analysis of Thalassemia Treatment Market*
| Restraint | (~) % Impact on CAGR Forecast | Geographic Relevance | Impact Timeline |
|---|---|---|---|
| High Cost Of Curative Therapies | -0.90% | Global, particularly impactful in emerging markets | Short term (≤ 2 years) |
| Limited Voluntary Blood-Donor Pools | -0.50% | Global, with acute shortages in developing regions | Medium term (2-4 years) |
| Vector-Manufacturing Capacity Bottlenecks | -0.70% | North America & EU primary, expanding to Asia Pacific | Short term (≤ 2 years) |
| Regulatory Uncertainty For Genome-Edited Therapies | -0.40% | Global, with varying approval timelines across regions | Medium term (2-4 years) |
| Source: Mordor Intelligence | |||
High Cost of Curative Therapies
A list price of USD 2.2 million per gene-therapy infusion challenges immediate affordability. Conventional management costs USD 5.4 million spread across decades, yet budgeting models struggle with a single-year outlay. Bluebird Bio’s slow uptake and resulting USD 3.00 per-share buyout confirm how financing hurdles hinder adoption. Payers demand rigorous health-economic dossiers, pushing manufacturers toward installment plans or outcome-based contracts that remain nascent in most regions.
Limited Voluntary Blood-Donor Pools
Thalassemia patients may need multiple transfusions each week, but the donor supply remains inconsistent. Companies such as RedC Biotech are testing lab-grown red blood cells as a scalable solution for HospiMedica. Early-stage Israeli work on stem-cell-derived universal red cells shows promise, Ynet News, while the RESTORE trial studies their real-world efficacy. AI-driven matching cuts allo-immunisation, yet global expansion will take several years, leaving near-term gaps in traditional supply chains.
*Our forecasts treat driver/restraint impacts as directional, not additive. The impact forecasts reflect baseline growth, mix effects, and variable interactions.
Thalassemia Treatment Market Segment Analysis
By Treatment Type:
Gene Therapy Disrupts Traditional ParadigmsThe thalassemia treatment market size for the gene-therapy segment is forecast to expand at 12.97% CAGR, reflecting its capacity to end lifelong transfusion needs in 91% of treated patients. Blood transfusions still account for a 59.62% slice of the thalassemia treatment market, underscoring their indispensability for those not yet eligible for curative solutions. Combination iron chelation reduced serum ferritin by 34.99% after one year, maintaining relevance for transfusion-dependent patients. Stem-cell transplantation delivers 85-90% thalassemia-free survival for low-risk profiles at UCSF but remains limited by donor compatibility. Luspatercept yielded ≥33% transfusion reduction in 21% of BELIEVE trial participants Reblozyl Pro, positioning it as a bridge therapy. Folic-acid supplementation improves hemoglobin and bone-pain scores in beta thalassemia minor, Evidence-Based Practice, though its role in major disease remains supplementary. Collectively, these modalities coexist, but the momentum clearly favors gene-editing platforms that redefine the risk-benefit equation for payers and patients.
Demand for sustainability is reinforced by manufacturing capacity expansion at nine authorized CASGEVY centers. Yet the thalassemia treatment market size attributed to transfusions will contract gradually as curative uptake rises. Iron chelation manufacturers, led by Novartis and Apotex, are therefore launching adherence-enhancing formulations to defend revenue. Transition dynamics, along with luspatercept’s proven quality-of-life gains, signal an ecosystem in flux rather than immediate displacement of legacy options.

By Disease Type:
Beta Thalassemia Dominance Drives InnovationBeta thalassemia owns 71.05% of the thalassemia treatment market share in 2025 and leads growth at 9.23% CAGR as the most severe phenotype spurs aggressive therapy adoption. CASGEVY and ZYNTEGLO specifically target this cohort, rationalising their premium pricing. Alpha thalassemia, prevalent in Southeast Asia, has fewer options, though Bristol Myers Squibb’s Phase 2 luspatercept program for HbH disease marks progress for HemaSphere. Mutation diversity, such as the -α3.7 deletion responsible for 69.2% of Saudi cases, complicates universal solutions, reinforcing the need for genotype-specific approaches.
Beta thalassemia’s outsized burden attracts disproportionate R&D, leaving a therapeutic gap for alpha variants. Yet newborn screening in high-incidence geographies identifies alpha carriers earlier, ensuring that the thalassemia treatment market remains diverse. As fetal hemoglobin modulation strategies show promise for both subtypes, product pipelines may converge, but commercial priorities currently rest with beta-focused programs that match higher severity and willingness-to-pay profiles.
By End User:
Specialty Clinics Emerge as Gene Therapy HubsHospitals held 54.78% revenue in 2025 by delivering transfusions and multidisciplinary care. As autologous cell therapies reach commercial scale, specialty clinics record an 8.18% CAGR, reflecting stringent facility and staff requirements. Nine CASGEVY centers spotlight the hub model, with hospitals feeding candidates into specialized units for conditioning, infusion, and monitoring at Vertex Pharmaceuticals. Academic sites remain critical to clinical trials; UCSF leads registries and mitapivat investigations.
Smartphone hemoglobin prediction systems with MAE 1.34 and MSE 2.85 BMC Medical Informatics support remote management, allowing clinics to space in-person visits. Nursing protocols for stem-cell transplantation in China boosted discharge readiness and satisfaction scores. Together, these developments illustrate a distributed yet integrated care architecture, aligning with value-based reimbursement trends across the thalassemia treatment industry.
Geography Analysis
APAC and MEA Thalassemia Treatment Market
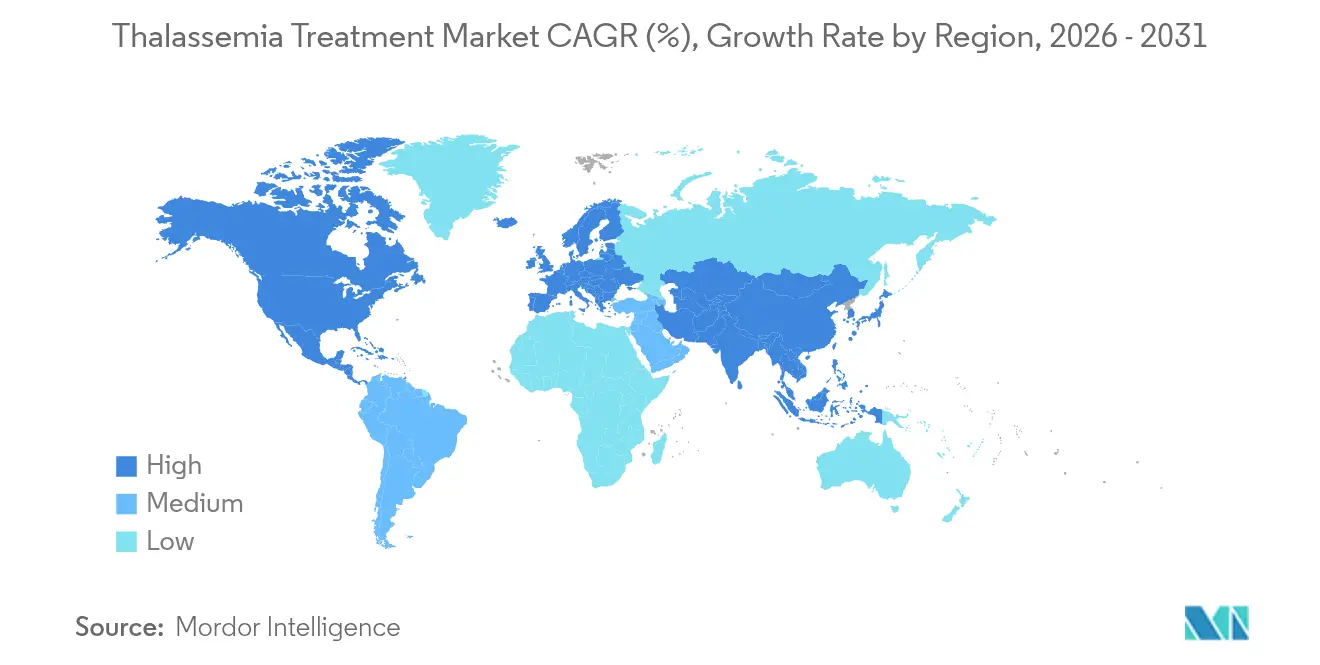
Asia Pacific’s 48.12% share of the thalassemia treatment market stems from endemic carrier rates and improved funding for diagnostics. China alone lifts demand through 47.48 million carriers and an expanding network of treatment centers UCSF. The thalassemia treatment market size in Asia Pacific is projected to widen as provincial reimbursements now cover parts of gene-therapy cost for eligible children. Middle East & Africa, though smaller, posts the fastest 7.01% CAGR thanks to Saudi Arabia’s high newborn positivity and public-health commitment HemaSphere. Regional insurers increasingly authorise luspatercept as an intermediate measure, bridging systemic capacity gaps.
Europe, North America, LATAM and APAC Thalassemia Treatment Market
Europe benefits from decades of prevention, yet still harbors concentrated patient pools in Italy, Greece and Cyprus where screening reduced incidence but not existing caseloads HAL Science. The United States accelerates adoption following January 2024 FDA approvals, with insurers evaluating outcomes-based instalments for curative products AABB. Latin America and parts of South Asia remain under-diagnosed; as awareness grows, newly identified patients will enlarge the global thalassemia treatment market.
Global Thalassemia Treatment Market
Healthcare expenditure disparities create unequal access, but technology transfer initiatives, long-term loan financing and donor-supported infrastructure programs intend to narrow the gap. The geography mix therefore sustains a two-speed market: advanced economies drive premium gene-therapy revenue while emerging regions continue anchoring transfusion and iron-chelation volumes.
Regulatory Landscape
Regulatory oversight for thalassemia therapeutics has broadened from transfusion support products to include small-molecule anemia therapies and genome-edited, autologous cell therapies. In the United States, the FDA has continued to expand labeling for advanced therapies, including a July 2026 supplemental approval that broadened CASGEVY (exagamglogene autotemcel) use to patients aged 2 years and older with transfusion-dependent beta thalassemia, reinforcing earlier intervention. The FDA also approved AQVESME (mitapivat) in December 2025 for anemia in adults with alpha- or beta-thalassemia, reflecting an expanding framework for disease-modifying, non-curative options alongside one-time therapies.
In Europe, access has advanced through centralized authorization and national reimbursement decisions. The European Commission granted marketing authorization in May 2026 for PYRUKYND (mitapivat) for anemia in adults with transfusion-dependent and non-transfusion-dependent alpha or beta thalassemia, while the EMA maintains product-level regulatory expectations for advanced therapy medicinal products such as CASGEVY. Payer and safety governance is also evolving: in September 2025, Italy's AIFA approved reimbursement for CASGEVY, and in April 2026 the U.S. Federal Register published a notice on next-generation sequencing approaches to assess genome-editing safety in human gene therapy products, signaling tighter alignment between post-treatment monitoring practices and regulatory expectations.
Competitive Landscape
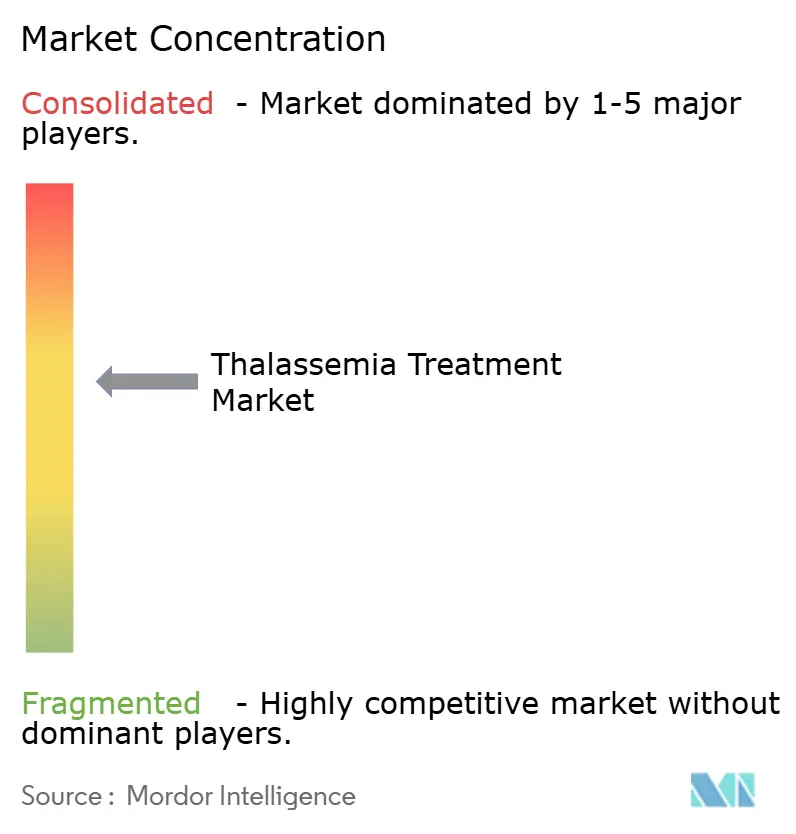
Moderate fragmentation persists as incumbents guard established categories and biotechs carve out the curative frontier. Novartis and Apotex still dominate iron chelation with Exjade and Ferriprox, but margins erode as generic deferiprone expands. Vertex Pharmaceuticals and CRISPR Therapeutics command the nascent gene-editing niche with CASGEVY, challenged by Bluebird Bio’s ZYNTEGLO and BDgene’s coming lentiviral entrant BioSpace. Carlyle and SK Capital’s acquisition of Bluebird signalled private-equity conviction that commercial hurdles can be solved with more capital and operational discipline.
Bristol Myers Squibb leverages to bridge transfusion dependence and curative therapies, illustrating how large firms diversify approaches. Technology differentiation also surfaces in AI-based monitoring tools; automated MRI iron-load quantification achieved 96% sensitivity and 98% specificity, HemaSphere, giving vendors analytics-as-a-service revenue lines. White-space remains in alpha-thalassemia therapeutics, presenting entry points for agile biotechs. Overall, the thalassemia treatment market rewards companies that align manufacturing, reimbursement, and logistics in addition to clinical performance.
Price dynamics add competitive tension. CASGEVY’s USD 2.2 million level set the ceiling, but pay-for-results contracts may compress average realizations. Meanwhile, CSL’s Ferinject faces European generics Live Mint, reminding investors that volume markets can turn rapid growth into price pressure. Strategy in this environment centers on portfolio breadth, manufacturing know-how, and payer engagement—capabilities that differentiate sustainable leaders from single-asset specialists.
Thalassemia Treatment Industry Leaders
-
Bluebird Bio
-
Novartis AG
-
ApoPharma Inc
-
Bellicum Pharmaceuticals
-
Pfizer, Inc.
- *Disclaimer: Major Players sorted in no particular order
Thalassemia Treatment Market Companies Covered in this Report
- Novartis
- Bluebird Bio
- CSL Vifor
- Pfizer
- Merck & Co. (Acceleron)
- Ionis Pharmaceuticals
- Chiesi Farmaceutici
- Vertex Pharmaceuticals
- CRISPR Therapeutic
- Editas Medicine
- Sangamo Therapeutics
- Bellicum Pharmaceuticals
- Agios Pharmaceuticals
- Kiadis Pharma
- ApoPharma Inc.
- SG Pharma Pvt Ltd
- Zydus Lifesciences
- Incyte
- Gamida Cell
- Intellia Therapeutics
Market Opportunities and Future Outlook
Commercial whitespace is developing at the intersection of broader labels, earlier patient identification, and delivery-network buildout. The July 2026 FDA expansion of CASGEVY to patients aged 2 years and older with transfusion-dependent beta thalassemia increases the pool of eligible pediatric patients, which lifts near-term demand for accredited cell-therapy treatment centers, apheresis and conditioning capacity, and longitudinal monitoring services. May 2026 European Commission authorization of PYRUKYND (mitapivat) for anemia in adults across both transfusion-dependent and non-transfusion-dependent alpha or beta thalassemia also enlarges the addressable population for an oral, chronic therapy, supporting opportunities in specialty-clinic prescribing pathways and patient-support programs that improve adherence and monitoring.
Manufacturing capacity and localization initiatives create additional entry points across the value chain. Vertex's long-term commercial supply agreement with Lonza (announced September 2024) for CASGEVY manufacturing, using Geleen (Netherlands) with planned expansion to Portsmouth (New Hampshire), underlines active investment in scaling gene-edited cell therapy supply and opens opportunities for qualified CDMOs, logistics providers, and testing labs supporting release assays and chain-of-identity workflows. Region-specific partnerships also support access-building strategies in high-prevalence markets, including moves toward localized manufacturing and commercialization arrangements in the Middle East for gene therapies, which can reduce operational friction for one-time treatments while expanding the footprint for supportive care (transfusion services and iron chelation) where curative capacity remains limited.
Recent Industry Developments in Thalassemia Treatment Market
- July 2026: Vertex Pharmaceuticals reported that the US FDA granted supplemental approval expanding CASGEVY (exagamglogene autotemcel) to people aged 2 years and older with transfusion-dependent beta thalassemia. The broader pediatric label increases the number of eligible patients and amplifies demand for qualified cell-therapy treatment centers, apheresis logistics, and long-term follow-up infrastructure.
- December 2025: The US FDA approved Agios Pharmaceuticals’ AQVESME (mitapivat) tablets for the treatment of anemia in adults with alpha- or beta-thalassemia. This introduced a newly regulated oral, disease-modifying option that complements transfusion and chelation pathways and expands the competitive set beyond one-time gene therapies.
- August 2024: NICE recommended CASGEVY for NHS coverage at seven centers in the United Kingdom, enabling access for a defined eligible patient group within a centralized delivery model. The decision strengthened reimbursement precedent for high-cost, one-time therapies and accelerated site readiness requirements across specialized hospital hubs.
Thalassemia Treatment Market Report Scope and Research Methodology
Market Definition and Coverage
This market measures the value of therapies and care used to treat thalassemia in clinical practice, including ongoing supportive regimens and newer disease-modifying approaches, as they are applied across major care settings and geographies.
Scope exclusions: This sizing excludes general anemia workups and unrelated hematology drugs that are not prescribed specifically for thalassemia management.
Segments Covered in This Report
- By Treatment Type
- Blood Transfusions
- Iron Chelation Therapy
- Gene Therapy
- Haematopoietic Stem-Cell Transplantation
- Luspatercept & Erythroid-maturation Agents
- Folic Acid & supportive supplements
- Others
- By Disease Type
- Alpha thalassemia
- Beta thalassemia
- By End User
- Hospitals
- Specialty Clinics
- Academic & Research Institutes
- Home-care settings
- Others
- By Geography
- North America
- United States
- Canada
- Mexico
- Europe
- Germany
- United Kingdom
- France
- Italy
- Spain
- Rest of Europe
- Asia Pacific
- China
- Japan
- India
- South Korea
- Australia
- Rest of Asia Pacific
- Middle East & Africa
- GCC
- South Africa
- Rest of Middle East & Africa
- South America
- Brazil
- Argentina
- Rest of South America
- North America
Data Sources, Market Sizing, and Validation
Desk Research
Desk research sets the base for the model by aligning epidemiology, treatment patterns, and pricing context in a way that can be repeated year after year. We used public sources such as the World Health Organization and the US CDC, plus national health ministries and open statistics portals, to understand prevalence signals and screening coverage in high burden regions.
To keep assumptions grounded, we also reviewed evidence from peer reviewed journals (for transfusion burden, chelation adherence, and outcomes) and from regulator and reimbursement portals such as the US FDA and EMA for approvals and label changes. Additional inputs came from company annual reports, investor presentations, and reputable press to map therapy uptake timing, access changes, and patient support programs. Where needed, paid subscriptions for company financials and patent databases were used to cross-check timelines and activity, but the core inputs were anchored in public material. This list is indicative only, and many other sources were reviewed for collection, validation, and clarification.
Primary Interviews and Surveys
Primary work was used to validate real-world treatment mix, dosing continuity, and the pace at which patients move between transfusion, chelation, and advanced therapies as eligibility and access change. We spoke with clinicians, hospital pharmacists, payers, and patient group stakeholders across Americas, EMEA, and APAC so the model reflects differences in screening rates, center availability, and coverage policy detail.
Distribution of primary research fieldwork respondents
| Company type | Respondent position | Region |
|---|---|---|
| Top tier: 28% | CXOs: 14% | APAC: 46% |
| Mid tier: 58% | Functional/Unit leaders: 39% | EMEA: 36% |
| Smaller Players: 14% | Managers: 47% | Americas: 18% |
Market-Sizing & Forecasting
For sizing, the core logic is a top-down build where prevalence and treated-patient pools are reconstructed by region, then converted into value using therapy mix and annual cost of therapy assumptions. The totals are checked using selective bottom-up approximations, such as a sampled price per regimen multiplied by estimated volumes in key care settings, followed by channel checks where data is available.
For thalassemia, the inputs that tend to drive variation are transfusion frequency bands, iron chelation utilization and persistence, the share of patients managed in specialty centers versus general hospitals, eligibility for disease-modifying therapies, and the timing of reimbursement expansion by country. When data is thin in smaller countries, we fill gaps with regional analogs and then adjust after interviews, so the model remains traceable.
Forecasts are built using scenario analysis supported by trend lines on treated prevalence, access expansion, and therapy adoption curves, and then stress-tested against switching rates and price evolution expectations expressed by clinicians and payers. We also use a simple regression check for large regions where longitudinal epidemiology and healthcare spend signals are consistent, to avoid overstating adoption in early years.
Data Validation & Update Cycle
Outputs are validated through multiple checks, including variance review by region, cross-comparison to epidemiology ranges, and sanity checks on implied annual therapy cost per treated patient. When an assumption creates an outlier, we revisit the driver, re-check the desk evidence, and re-contact relevant respondents if the change is material.
Before sign-off, the model and written insights go through stepwise analyst reviews to ensure arithmetic, scope boundaries, and year-on-year movements are consistent. The report is refreshed annually, and interim updates are triggered when approvals, safety updates, or reimbursement decisions materially change uptake. Right before delivery, a final pass is completed so clients receive the latest updated view with the most current currency timing and inputs available.
Mordor Intelligence's Thalassemia Treatment Market Size Compared Against Other Published Estimates
Published market sizes for thalassemia treatment can vary widely because the therapy set included, the year used for pricing, and the way uptake is staged over time are not always aligned. Differences also come from how one-time advanced therapies versus recurring supportive care are treated, and how quickly assumptions are updated after policy or label changes.
In a refresh-led reading of the numbers, the main gap drivers are usually currency timing, how average selling prices are rolled forward for chelation and newer agents, and whether reimbursement changes are validated with on-the-ground checks. Some estimates also blend thalassemia with adjacent hemoglobin disorders or count broader hematology supportive drugs, which expands the addressable pool compared with a tighter treated-patient boundary.
Benchmark comparison
| Source | Market Size | Gaps in Research Methodology |
|---|---|---|
| Mordor Intelligence | USD 8.21 B (2026) | |
| Industry Publisher A | USD 7.67 B (2024) | Uses an earlier base year and a longer horizon, and the pricing and therapy-mix updates appear to be applied less frequently around newer therapy launches and access changes. |
| Market Compendium B | USD 8.09 B (2025) | Shows a faster growth path that can reflect a more aggressive ASP progression and adoption curve for advanced therapies, with less visible adjustment for payer timing and center-level readiness. |
The spread across the table is largely explained by timing and how quickly assumptions are refreshed after material events, along with what is counted as recurring versus episodic spend. By anchoring price-year conversions, therapy-mix shifts, and interview-based checks close to the estimate year, Mordor Intelligence keeps the total tied to a realistic treated pool and repeatable steps.
Key Questions Answered in the Report
What is the current size of the thalassemia treatment market?
The thalassemia treatment market size reached USD 8.21 billion in 2026 and is projected to hit USD 9.76 billion by 2031.
How fast is the gene-therapy segment growing?
Gene therapy is expanding at a 12.97% CAGR through 2031, the fastest among all treatment categories, owing to CASGEVY and ZYNTEGLO approvals.
Which region leads thalassemia treatment revenue?
Asia Pacific generated 48.12% of global revenue in 2025, reflecting high carrier prevalence and growing access to advanced therapies.
Why are specialty clinics gaining traction?
Specialty clinics post an 8.18% CAGR because autologous gene-editing therapies require dedicated facilities, trained staff and strict quality controls.
What barriers limit curative therapy adoption?
Up-front pricing of USD 2.2 million per treatment and limited reimbursement structures slow widespread uptake despite long-term cost advantages.