Market Overview
| Study Period | 2017 - 2030 |
|---|---|
| Base Year For Estimation | 2024 |
| Forecast Data Period | 2025 - 2030 |
| Market Size (2025) | USD 515.21 Million |
| Market Size (2030) | USD 677.77 Million |
| Growth Rate (2025 - 2030) | 5.64% CAGR |
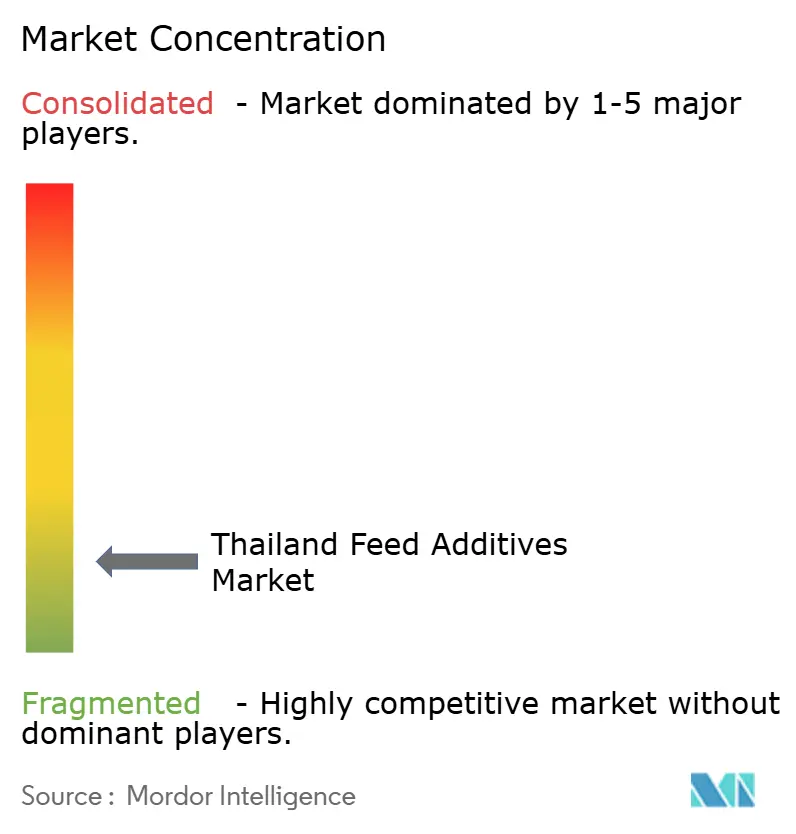
| Market Concentration | Low |
Major Players
*Disclaimer: Major Players sorted in no particular order Image © Mordor Intelligence. Reuse requires attribution under CC BY 4.0. |
|

Thailand Feed Additives Market Analysis by Mordor Intelligence
The Thailand feed additives market size is valued at USD 515.21 million in 2025 and is projected to reach USD 677.77 million by 2030, growing at a CAGR of 5.64% during the forecast period. Strong poultry production drives steady volume growth, while increasing precision-nutrition standards enhance premium additive adoption. Thailand's expanding livestock sector maintains consistent additive demand, with the Thai Feed Mill Association reporting 21.8 million metric tons of feed demand in 2025[1]Source: Thai Feed Mill Association, “Thailand Feed Industry Statistics 2025,” thaifeeds.com. Government incentives for feed mill automation and precision nutrition technologies increase the implementation of advanced additive formulations, particularly as companies, including Charoen Pokphand Foods, implement Smart Farm technologies that combine IoT sensors, artificial intelligence, and blockchain traceability. The focus on export-oriented meat production drives the adoption of enzymes, probiotics, and phytogenic blends. Multinational suppliers establish local partnerships to comply with Thailand's antimicrobial resistance regulations and ensure raw-material supply stability. The emergence of insect protein creates specialty additive opportunities for domestic formulators.
Key Report Takeaways
- By additive, amino acids led with 25.3% of the Thailand feed additives market share in 2024 and are forecast to expand at a 6.12% CAGR through 2030.
- By animal type, poultry captured 58.4% of the Thailand feed additives market size in 2024, while it also registers the highest projected 6.72% CAGR to 2030.
Thailand Feed Additives Market Trends and Insights
Drivers Impact Analysis
| Driver | (~) % Impact on CAGR Forecast | Geographic Relevance | Impact Timeline |
|---|---|---|---|
| Growing demand for animal protein | +1.0% | Central and Eastern regions | Medium term (2-4 years) |
| Expansion of livestock and aquaculture industries | +1.1% | Nationwide with aquaculture focus in the South | Long term (≥ 4 years) |
| Government incentives for feed-mill automation | +0.4% | National industrial zones | Short term (≤ 2 years) |
| Focus on animal health, performance and feed efficiency | +1.0% | Export-oriented facilities | Medium term (2-4 years) |
| Export-oriented meat production | +0.5% | Integrated production clusters | Long term (≥ 4 years) |
| Insect-protein inclusion boosting specialty additive demand | +0.3% | Pilot programs in Northern and Central Thailand | Long term (≥ 4 years) |
| Source: Mordor Intelligence | |||
Growing Demand for Animal Protein
Thailand's increasing per capita meat consumption is driving changes in feed additive requirements, as domestic protein demand aligns with export market quality standards. The growing middle class and urbanization create consistent demand for high-quality meat, requiring precise nutrition additives. Government food security policies support this trend through subsidies for herd expansion and smallholder integration programs. Feed companies, including Betagro, have implemented low-nitrogen pig feed formulations, reducing ammonia emissions while maintaining growth rates. The combination of domestic consumption patterns and export requirements generates steady demand for amino acid supplements, digestibility enhancers, and meat quality additives. Food security policies and consumer preferences for quality meat provide a foundation for expanding the feed additive market beyond conventional growth promoters.
Expansion of Livestock and Aquaculture Industries
Thailand's position as a regional protein hub drives the expansion of livestock and aquaculture capacity, increasing the demand for feed additives across species and production systems. The government's Eastern Economic Corridor development provides support for modern livestock facilities and aquaculture technology adoption, which increases the need for specialized additive formulations. The country's coastal geography and freshwater resources support aquaculture growth, particularly in shrimp and fish farming, which require specific enzymes, probiotics, and water quality management additives. The Eastern Economic Corridor directs investment toward automated barns and precision aquaculture ponds that use advanced enzymes and probiotics to optimize feed conversion. The Thailand feed additives market expands as each metric ton of new feed capacity requires additional additive inclusion.
Government Incentives for Feed-Mill Automation
Thailand's Industry 4.0 initiatives through the Board of Investment in 2023 accelerated the adoption of automated feed production technologies, improving additive integration and quality control capabilities. The government's tax incentives for smart manufacturing equipment and digital transformation enabled feed mills to implement precision dosing systems, real-time quality monitoring, and traceability platforms. In 2023, Betagro's Nong Bun Mak Animal Feed Plant achieved Thailand Industrial 4.0 Index Certification, showcasing the benefits of automated additive handling systems. The digital transformation improved traceability, allowing producers to measure additive performance through cloud-based analytics.
Export Oriented Meat Production
Thailand's position as one of the world's major chicken exporters creates specific requirements for feed additives that focus on consistency, shelf life, and international quality standards. Export market access requires compliance with various regulatory frameworks across destination countries, increasing the demand for additives that enhance meat quality, extend shelf life, and ensure residue-free production. The combination of export-oriented production and domestic food safety requirements has created premium market segments where additive innovation generates higher margins and long-term customer relationships. The Thai government's support for halal certification and organic production systems has developed additional market segments that require specialized additive formulations meeting religious and organic standards while maintaining performance requirements.
Restraints Impact Analysis
| Driver | (~) % Impact on CAGR Forecast | Geographic Relevance | Impact Timeline |
|---|---|---|---|
| Volatile prices of key raw materials | −1.8% | Import-dependent areas | Short term (≤ 2 years) |
| Limited cold-chain logistics for liquid additives | −0.6% | Rural and remote provinces | Medium term (2-4 years) |
| Stringent antimicrobial resistance (AMR) regulations | −0.4% | Nation-wide commercial farms | Long term (≥ 4 years) |
| Dependence on imports and supply chain risks | −1.1% | Coastal and border regions | Medium term (2-4 years) |
| Source: Mordor Intelligence | |||
Volatile Prices of Key Raw Material
Raw material price fluctuations influence feed additive adoption, as manufacturers reduce premium additive purchases during periods of elevated ingredient costs. Soybean meal prices of 16.2 THB per kg (USD 0.50 per kg) in 2024, a 24% decrease from the previous year, demonstrate the price volatility affecting additive procurement in Thailand's feed industry[2]Source: Department of Foreign Trade Thailand, “Agricultural Commodity Trade Statistics 2024,” dft.go.th. Thailand's dependence on imported protein meals and energy sources exposes feed manufacturers to currency fluctuations, global commodity cycles, and geopolitical supply disruptions, constraining the resources available for feed additive investments.
Limited Cold-Chain Logistics for Liquid Additives
Infrastructure constraints in Thailand's rural and remote regions limit the adoption of liquid feed additives that require temperature-controlled storage and transportation. The concentration of cold-chain facilities in urban and industrial areas creates uneven access to additives across regions, particularly affecting small-scale operations and remote aquaculture facilities that need liquid enzyme and probiotic products. The country's tropical climate and seasonal flooding increase logistics challenges, requiring specialized handling and backup storage systems, which raise distribution costs for temperature-sensitive additives.
Segment Analysis
By Additive: Amino Acids Drive Precision Nutrition
Amino acids held 25.3% of the Thailand feed additives market share in 2024 and represent the fastest-growing additive segment with a projected 6.12% CAGR through 2030. Broiler integrators use lysine and methionine to achieve export-grade feed conversion ratios, while threonine maintains gut health in tropical conditions. Feed manufacturers employ near-infrared analyzers to adjust synthetic amino acid levels based on protein variations in corn and soybean meal. The segment's expansion reflects the shift from crude protein to digestible amino acid formulation, optimizing feed costs while meeting international market performance requirements. Lysine and methionine remain the primary amino acids in demand for broiler growth and feed efficiency, with threonine and tryptophan gaining importance for stress management and immune support.
Vitamins and minerals maintain consistent demand across species, while probiotics and prebiotics see increased adoption as antibiotic alternatives in poultry and aquaculture. Phytogenics establishes a premium market position in export-oriented systems requiring natural performance enhancement. Acidifiers gain importance in young animal nutrition and aquaculture, while antioxidants support feed and meat product preservation. The regulatory environment for functional feed ingredients creates opportunities for specialty additives offering multiple benefits, including immune support, performance enhancement, and environmental impact reduction.

Note: Segment shares of all individual segments available upon report purchase
Get Detailed Market Forecasts at the Most Granular Levels
Download PDF
By Animal Type: Poultry Dominance Drives Innovation
Poultry applications account for 58.4% of the Thailand feed additives market size in 2024 and demonstrate the highest growth at 6.72% CAGR through 2030. This growth reflects Thailand's position as a major chicken exporter and the sector's implementation of precision nutrition technologies. Broiler production drives most poultry additive demand, requiring specific growth rates, feed conversion efficiency, and meat quality parameters to meet international export standards. Layer operations maintain consistent demand for calcium, phosphorus, and vitamin supplements, while additives for egg quality and shell strength gain traction in premium market segments. Integrators use IoT-enabled farm systems connected to cloud platforms to monitor additive inclusion rates per batch, providing validation for premium overseas buyers.
Swine applications concentrate on digestive health and growth promotion, while ruminant segments prioritize fiber digestion and methane reduction additives for environmental compliance. European and Japanese import requirements necessitate detailed documentation, increasing the adoption of digital feed management systems integrated with additive dosing equipment. Feed manufacturers focus on developing heat-stable phytogenics suitable for tropical conditions, while research continues on in-ovo nutrition methods to enhance day-old chick performance through direct amino acid delivery to embryos.

Note: Segment shares of all individual segments available upon report purchase
Get Detailed Market Forecasts at the Most Granular Levels
Download PDF
Geography Analysis
The Central Plains region dominates feed additive consumption through its established network of feed mills, slaughterhouses, and container ports. Manufacturing facilities near Bangkok benefit from direct access to raw material imports through Laem Chabang port, enabling efficient production of premium additives. The region, as the 14th largest destination for the United States' agricultural exports, received USD 1.2 billion worth of products in 2023[3]Source: U.S. Department of Agriculture, "Thailand-February 2025," fas.usda.gov. This trade relationship drives demand for feed ingredients and finished products through Central Thailand's logistics networks. Government incentives for smart manufacturing have concentrated industrial development in this region. The area's feed producers primarily use liquid enzymes and coated amino acids in their high-capacity, continuous pelleting operations.
The Eastern Economic Corridor contributes to market growth through its integrated broiler and swine production clusters. Modern feed plants in Chachoengsao and Rayong utilize precision micro-dosing technology, increasing the use of specialty additives. The proximity to Map Ta Phut port facilitates exports to Japan and the EU, increasing demand for antioxidants and natural mold inhibitors that meet international market requirements.
The Southern coastal provinces form Thailand's primary aquaculture region. Shrimp farms in Songkhla and Surat Thani extensively use probiotics, phytogenics, and water-stabilizing buffer salts. Automated aerator systems provide real-time oxygen data monitoring, enabling synchronized enzyme supplementation with plankton growth cycles. The region's seasonal weather patterns require feed mills to maintain higher inventory levels, increasing the need for antioxidants to maintain lipid stability in hot, humid conditions.
Competitive Landscape
DSM-Firmenich AG (DSM Nutritional Products AG), Archer Daniels Midland Company, SHV (Nutreco NV), Cargill, Incorporated, and BASF SE control a minor share of the Thailand feed additives market in 2024, indicating market fragmentation. DSM-Firmenich AG holds a significant market share through its comprehensive vitamin and enzyme portfolio and Bangkok application laboratory for customized blends. Archer Daniels Midland Company is leveraging its global soybean crushing operations to combine raw-material contracts with amino-acid products. SHV (Nutreco NV) is maintaining a strong market presence through its aquaculture specialization and research partnerships with Thai universities.
Companies compete through local manufacturing capabilities and digital services. AB Vista is establishing a regional premix facility to reduce lead times for customized xylanase complexes. DSM implements blockchain technology in vitamin shipments to streamline compliance documentation for feed mills. Local companies develop insect chitin derivatives as natural immune enhancers, targeting specialized market segments unaddressed by international corporations.
Companies differentiate themselves through environmental initiatives. Cargill operates renewable energy-powered premix production lines, while Kemin documents carbon footprint reductions in probiotic production. Thai Vegetable Oil's zero-waste achievement influences additive suppliers to demonstrate circular economy practices. Companies that provide verified environmental data gain advantages with processors preparing for Thailand's new (Environmental, Social, and Governance) reporting requirements.
Thailand Feed Additives Industry Leaders
-
DSM-Firmenich AG (DSM Nutritional Products AG)
-
Archer Daniels Midland Company
-
SHV (Nutreco NV)
-
Cargill, Incorporated
-
BASF SE
- *Disclaimer: Major Players sorted in no particular order
Need More Details on Market Players and Competitors?
Download PDF
Recent Industry Developments
- August 2025: Betagro Public Company (BTG), an integrated food company in Thailand, through its venture arm, Betagro Ventures, has partnered with global investors to fund BiomEdit, a U.S.-based animal health biotechnology company, in its Series B funding round. The investment supports BE-101, a probiotic vectored antibody (pvAb), which is BiomEdit's primary candidate for preventing necrotic enteritis (NE)-related mortality in broiler chickens, aiming to improve poultry production efficiency through sustainable methods.
- March 2025: Cargill, Incorporated, launched Notox solutions, advanced mycotoxin detoxifiers, at VIV Asia 2025 in Thailand. The solution improves risk assessment accuracy, manages and prevents mycotoxins, enhances livestock product quality, reduces production costs, and improves animal welfare.
- August 2024: Novus International, Inc. expanded its Asia-Pacific regional head office in Bangkok, Thailand. This office serves as the central hub for the company's feed additives business across the region and demonstrates the company's commitment to supporting protein producers in the Asia-Pacific region.
Thailand Feed Additives Market Report Scope
Acidifiers, Amino Acids, Antibiotics, Antioxidants, Binders, Enzymes, Flavors & Sweeteners, Minerals, Mycotoxin Detoxifiers, Phytogenics, Pigments, Prebiotics, Probiotics, Vitamins, Yeast are covered as segments by Additive. Aquaculture, Poultry, Ruminants, Swine are covered as segments by Animal.
By Additive
| Acidifiers | By Sub-Additive | Fumaric Acid |
| Lactic Acid | ||
| Propionic Acid | ||
| Other Acidifiers | ||
| Amino Acids | By Sub-Additive | Lysine |
| Methionine | ||
| Threonine | ||
| Tryptophan | ||
| Other Amino Acids | ||
| Antibiotics | By Sub-Additive | Bacitracin |
| Penicillins | ||
| Tetracyclines | ||
| Tylosin | ||
| Other Antibiotics | ||
| Antioxidants | By Sub-Additive | Butylated Hydroxyanisole (BHA) |
| Butylated Hydroxytoluene (BHT) | ||
| Citric Acid | ||
| Ethoxyquin | ||
| Propyl Gallate | ||
| Tocopherols | ||
| Other Antioxidants | ||
| Binders | By Sub-Additive | Natural Binders |
| Synthetic Binders | ||
| Enzymes | By Sub-Additive | Carbohydrases |
| Phytases | ||
| Other Enzymes | ||
| Flavors and Sweeteners | By Sub-Additive | Flavors |
| Sweeteners | ||
| Minerals | By Sub-Additive | Macrominerals |
| Microminerals | ||
| Mycotoxin Detoxifiers | By Sub-Additive | Binders |
| Biotransformers | ||
| Other Mycotoxin Detoxifiers | ||
| Phytogenics | By Sub-Additive | Essential Oil |
| Herbs and Spices | ||
| Other Phytogenics | ||
| Pigments | By Sub-Additive | Carotenoids |
| Curcumin and Spirulina | ||
| Prebiotics | By Sub-Additive | Fructo Oligosaccharides |
| Galacto Oligosaccharides | ||
| Inulin | ||
| Lactulose | ||
| Mannan Oligosaccharides | ||
| Xylo Oligosaccharides | ||
| Other Prebiotics | ||
| Probiotics | By Sub-Additive | Bifidobacteria |
| Enterococcus | ||
| Lactobacilli | ||
| Pediococcus | ||
| Streptococcus | ||
| Other Probiotics | ||
| Vitamins | By Sub-Additive | Vitamin A |
| Vitamin B | ||
| Vitamin C | ||
| Vitamin E | ||
| Other Vitamins | ||
| Yeast | By Sub-Additive | Live Yeast |
| Selenium Yeast | ||
| Spent Yeast | ||
| Torula Dried Yeast | ||
| Whey Yeast | ||
| Yeast Derivatives |
By Animal Type
| Aquaculture | By Sub-Animal | Fish |
| Shrimp | ||
| Other Aquaculture Species | ||
| Poultry | By Sub-Animal | Broiler |
| Layer | ||
| Other Poultry Birds | ||
| Ruminants | By Sub-Animal | Beef Cattle |
| Dairy Cattle | ||
| Other Ruminants | ||
| Swine | ||
| Other Animals |
| By Additive | Acidifiers | By Sub-Additive | Fumaric Acid |
| Lactic Acid | |||
| Propionic Acid | |||
| Other Acidifiers | |||
| Amino Acids | By Sub-Additive | Lysine | |
| Methionine | |||
| Threonine | |||
| Tryptophan | |||
| Other Amino Acids | |||
| Antibiotics | By Sub-Additive | Bacitracin | |
| Penicillins | |||
| Tetracyclines | |||
| Tylosin | |||
| Other Antibiotics | |||
| Antioxidants | By Sub-Additive | Butylated Hydroxyanisole (BHA) | |
| Butylated Hydroxytoluene (BHT) | |||
| Citric Acid | |||
| Ethoxyquin | |||
| Propyl Gallate | |||
| Tocopherols | |||
| Other Antioxidants | |||
| Binders | By Sub-Additive | Natural Binders | |
| Synthetic Binders | |||
| Enzymes | By Sub-Additive | Carbohydrases | |
| Phytases | |||
| Other Enzymes | |||
| Flavors and Sweeteners | By Sub-Additive | Flavors | |
| Sweeteners | |||
| Minerals | By Sub-Additive | Macrominerals | |
| Microminerals | |||
| Mycotoxin Detoxifiers | By Sub-Additive | Binders | |
| Biotransformers | |||
| Other Mycotoxin Detoxifiers | |||
| Phytogenics | By Sub-Additive | Essential Oil | |
| Herbs and Spices | |||
| Other Phytogenics | |||
| Pigments | By Sub-Additive | Carotenoids | |
| Curcumin and Spirulina | |||
| Prebiotics | By Sub-Additive | Fructo Oligosaccharides | |
| Galacto Oligosaccharides | |||
| Inulin | |||
| Lactulose | |||
| Mannan Oligosaccharides | |||
| Xylo Oligosaccharides | |||
| Other Prebiotics | |||
| Probiotics | By Sub-Additive | Bifidobacteria | |
| Enterococcus | |||
| Lactobacilli | |||
| Pediococcus | |||
| Streptococcus | |||
| Other Probiotics | |||
| Vitamins | By Sub-Additive | Vitamin A | |
| Vitamin B | |||
| Vitamin C | |||
| Vitamin E | |||
| Other Vitamins | |||
| Yeast | By Sub-Additive | Live Yeast | |
| Selenium Yeast | |||
| Spent Yeast | |||
| Torula Dried Yeast | |||
| Whey Yeast | |||
| Yeast Derivatives | |||
| By Animal Type | Aquaculture | By Sub-Animal | Fish |
| Shrimp | |||
| Other Aquaculture Species | |||
| Poultry | By Sub-Animal | Broiler | |
| Layer | |||
| Other Poultry Birds | |||
| Ruminants | By Sub-Animal | Beef Cattle | |
| Dairy Cattle | |||
| Other Ruminants | |||
| Swine | |||
| Other Animals | |||
Need A Different Region or Segment?
Customize Now
Market Definition
- FUNCTIONS - For the study, feed additives are considered to be commercially manufactured products that are used to enhance characteristics such as weight gain, feed conversion ratio, and feed intake when fed in appropriate proportions.
- RESELLERS - Companies engaged in reselling feed additives without value addition have been excluded from the market scope, to avoid double counting.
- END CONSUMERS - Compound feed manufacturers are considered to be end-consumers in the market studied. The scope excludes farmers buying feed additives to be used directly as supplements or premixes.
- INTERNAL COMPANY CONSUMPTION - Companies engaged in the production of compound feed as well as the manufacturing of feed additives are part of the study. However, while estimating the market sizes, the internal consumption of feed additives by such companies has been excluded.
| Keyword | Definition |
|---|---|
| Feed additives | Feed additives are products used in animal nutrition for purposes of improving the quality of feed and the quality of food from animal origin, or to improve the animals’ performance and health. |
| Probiotics | Probiotics are microorganisms introduced into the body for their beneficial qualities. (It maintains or restores beneficial bacteria to the gut). |
| Antibiotics | Antibiotic is a drug that is specifically used to inhibit the growth of bacteria. |
| Prebiotics | A non-digestible food ingredient that promotes the growth of beneficial microorganisms in the intestines. |
| Antioxidants | Antioxidants are compounds that inhibit oxidation, a chemical reaction that produces free radicals. |
| Phytogenics | Phytogenics are a group of natural and non-antibiotic growth promoters derived from herbs, spices, essential oils, and oleoresins. |
| Vitamins | Vitamins are organic compounds, which are required for normal growth and maintenance of the body. |
| Metabolism | A chemical process that occurs within a living organism in order to maintain life. |
| Amino acids | Amino acids are the building blocks of proteins and play an important role in metabolic pathways. |
| Enzymes | Enzyme is a substance that acts as a catalyst to bring about a specific biochemical reaction. |
| Anti-microbial resistance | The ability of a microorganism to resist the effects of an antimicrobial agent. |
| Anti-microbial | Destroying or inhibiting the growth of microorganisms. |
| Osmotic balance | It is a process of maintaining salt and water balance across membranes within the body's fluids. |
| Bacteriocin | Bacteriocins are the toxins produced by bacteria to inhibit the growth of similar or closely related bacterial strains. |
| Biohydrogenation | It is a process that occurs in the rumen of an animal in which bacteria convert unsaturated fatty acids (USFA) to saturated fatty acids (SFA). |
| Oxidative rancidity | It is a reaction of fatty acids with oxygen, which generally causes unpleasant odors in animals. To prevent these, antioxidants were added. |
| Mycotoxicosis | Any condition or disease caused by fungal toxins, mainly due to contamination of animal feed with mycotoxins. |
| Mycotoxins | Mycotoxins are toxin compounds that are naturally produced by certain types of molds (fungi). |
| Feed Probiotics | Microbial feed supplements positively affect gastrointestinal microbial balance. |
| Probiotic yeast | Feed yeast (single-cell fungi) and other fungi used as probiotics. |
| Feed enzymes | They are used to supplement digestive enzymes in an animal’s stomach to break down food. Enzymes also ensure that meat and egg production is improved. |
| Mycotoxin detoxifiers | They are used to prevent fungal growth and to stop any harmful mold from being absorbed in the gut and blood. |
| Feed antibiotics | They are used both for the prevention and treatment of diseases but also for rapid growth and development. |
| Feed antioxidants | They are used to protect the deterioration of other feed nutrients in the feed such as fats, vitamins, pigments, and flavoring agents, thus providing nutrient security to the animals. |
| Feed phytogenics | Phytogenics are natural substances, added to livestock feed to promote growth, aid in digestion, and act as anti-microbial agents. |
| Feed vitamins | They are used to maintain the normal physiological function and normal growth and development of animals. |
| Feed flavors and sweetners | These flavors and sweeteners help to mask tastes and odors during changes in additives or medications and make them ideal for animal diets undergoing transition. |
| Feed acidifiers | Animal feed acidifiers are organic acids incorporated into the feed for nutritional or preservative purposes. Acidifiers enhance congestion and microbiological balance in the alimentary and digestive tracts of livestock. |
| Feed minerals | Feed minerals play an important role in the regular dietary requirements of animal feed. |
| Feed binders | Feed binders are the binding agents used in the manufacture of safe animal feed products. It enhances the taste of food and prolongs the storage period of the feed. |
| Key Terms | Abbreviation |
| LSDV | Lumpy Skin Disease Virus |
| ASF | African Swine Fever |
| GPA | Growth Promoter Antibiotics |
| NSP | Non-Starch Polysaccharides |
| PUFA | Polyunsaturated Fatty Acid |
| Afs | Aflatoxins |
| AGP | Antibiotic Growth Promoters |
| FAO | The Food And Agriculture Organization of the United Nations |
| USDA | The United States Department of Agriculture |
Need More Details on Market Definition?
Ask a Question
Research Methodology
Mordor Intelligence follows a four-step methodology in all our reports.
- Step-1: IDENTIFY KEY VARIABLES: In order to build a robust forecasting methodology, the variables and factors identified in Step-1 are tested against available historical market numbers. Through an iterative process, the variables required for market forecast are set and the model is built on the basis of these variables.
- Step-2: Build a Market Model: Market-size estimations for the forecast years are in nominal terms. Inflation is not a part of the pricing, and the average selling price (ASP) is kept constant throughout the forecast period.
- Step-3: Validate and Finalize: In this important step, all market numbers, variables and analyst calls are validated through an extensive network of primary research experts from the market studied. The respondents are selected across levels and functions to generate a holistic picture of the market studied.
- Step-4: Research Outputs: Syndicated Reports, Custom Consulting Assignments, Databases & Subscription Platforms

Get More Details On Research Methodology
Download PDF


