
Food And Agriculture Testing, Inspection, And Certification Market Size and Share
Market Overview
| Study Period | 2020 - 2031 |
|---|---|
| Market Size (2026) | USD 32.27 Billion |
| Market Size (2031) | USD 43.92 Billion |
| Growth Rate (2026 - 2031) | 6.36% CAGR |
| Fastest Growing Market | Asia Pacific |
| Largest Market | Asia Pacific |
| Market Concentration | Medium |
Major Players *Disclaimer: Major Players sorted in no particular order Image © Mordor Intelligence. Reuse requires attribution under CC BY 4.0. | |
Food And Agriculture Testing, Inspection, And Certification Market Analysis by Mordor Intelligence
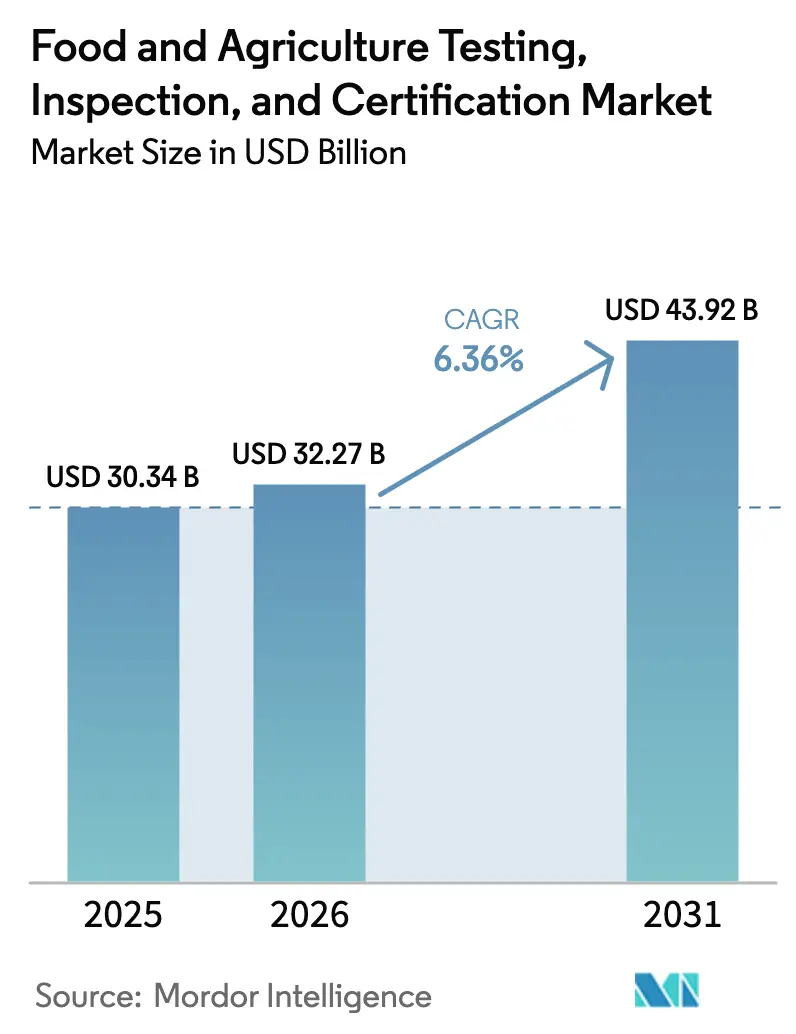
The food and agriculture testing, inspection, and certification market size is expected to grow from USD 30.34 billion in 2025 to USD 32.27 billion in 2026 and is forecast to reach USD 43.92 billion by 2031 at 6.36% CAGR over 2026-2031. Heightened regulatory scrutiny, rapid expansion of cross-border food trade, and the shift toward outsourced compliance verification propel this upward trajectory. Demand remains resilient because testing and certification are legal requirements rather than discretionary quality upgrades. Advances in artificial intelligence and blockchain strengthen predictive risk profiling and traceability, enabling faster detection of contaminants and tighter supply-chain oversight. Consolidation among third-party laboratories continues as players scale analytical capacity, pursue multi-standard accreditations, and invest in next-generation sequencing and LC-MS/MS platforms.
Key Report Takeaways
- By service type, testing services commanded 57.62% of the food and agriculture testing, inspection, and certification market share in 2025; certification services are forecast to expand at a 6.72% CAGR through 2031.
- By sourcing type, outsourced providers accounted for 72.34% of 2025 revenue; this channel is expected to grow at a 6.62% CAGR through 2031.
- By geography, Asia-Pacific held 43.12% of 2025 revenue and is projected to grow at a 6.98% CAGR through 2031, the highest among regions.
Note: Market size and forecast figures in this report are generated using Mordor Intelligence’s proprietary estimation framework, updated with the latest available data and insights as of 2026.
Global Food And Agriculture Testing, Inspection, And Certification Market Trends and Insights
Drivers Impact Analysis*
| Driver | (~) % Impact on CAGR Forecast | Geographic Relevance | Impact Timeline |
|---|---|---|---|
| Growing stringency of global food-safety regulations | +1.8% | Global, with the strongest impact in North America and the EU | Medium term (2-4 years) |
| Rising cross-border agri-food trade volumes | +1.2% | Asia-Pacific core, spill-over to MEA and Americas | Long term (≥ 4 years) |
| Expansion of retail private-label food brands | +0.9% | North America and the EU primarily, expanding to the Asia-Pacific | Medium term (2-4 years) |
| Consolidation of third-party laboratories | +0.7% | Global, concentrated in mature markets | Short term (≤ 2 years) |
| AI-driven predictive risk profiling of farms | +0.5% | North America and the EU are early adoption, and Asia-Pacific is following. | Long term (≥ 4 years) |
| Blockchain-enabled end-to-end traceability mandates | +0.4% | EU leading, North America and Asia-Pacific gradual adoption | Long term (≥ 4 years) |
| Source: Mordor Intelligence | |||
Growing stringency of global food-safety regulations
The United States FSMA LAAF program became fully operational in 2024 and requires laboratories to secure specific accreditations for designated analyses, increasing compliance costs and pushing food companies toward accredited third-party providers.[1]U.S. Food and Drug Administration, “Laboratory Accreditation for Analyses of Foods (LAAF) Program,” fda.gov Comparable tightening is visible in the European Union, where EFSA broadens risk-assessment frameworks and enforces stricter maximum residue limits, thereby expanding mandatory test panels. ISO 22000 and GFSI-benchmarked schemes such as BRCGS, IFS, and FSSC 22000 reduce regulatory fragmentation, yet they simultaneously elevate the minimum technical bar. As a result, smaller producers that once relied on basic in-house tests must now outsource more complex analyses, enlarging the food safety testing, inspection, and certification market. The requirement for multi-standard compliance turns safety verification into a fixed operating expense, insulating spending from normal economic cycles. Consolidated laboratory networks leverage their accreditation breadth to win long-term contracts and secure price premiums.
Rising cross-border agri-food trade volumes
Global food trade exposes single shipments to multiple regulatory regimes, multiplying the number of required assays per product. An exporter shipping processed seafood from Vietnam to the European Union must satisfy origin and destination pesticide, heavy-metal, microbiological, and labeling standards in parallel, creating incremental testing demand.[2]Baker McKenzie, “Asia-Pacific Food Law Guide 2024,” bakermckenzie.com Laboratories with multi-jurisdictional accreditations are well-positioned as exporters consolidate work with providers that deliver certificates accepted worldwide. Asia-Pacific anchors the growth because it is simultaneously a manufacturing base and a consumer market, leading to bidirectional flows that require verification at both ends. Mutual recognition agreements streamline some documentation yet paradoxically raise total assay counts by lowering barriers for smaller producers to reach new destinations. This dynamic sustains double-digit volume growth for regional laboratories, particularly in hubs such as Thailand and Vietnam.
Expansion of retail private-label food brands
Major retailers increasingly specify proprietary safety protocols, shifting responsibility for verification away from suppliers. Walmart, Carrefour, and Tesco require third-party confirmation that products meet brand-specific criteria, generating incremental test panels that go beyond statutory minima. Laboratories add value by bundling authenticity checks and supply-chain audits with classic pathogen and residue tests. Smaller manufacturers must navigate distinct retail requirements, often commissioning separate test programs for identical products. Retailers adopt blockchain QR codes that expose certification data to consumers at the point of sale, reinforcing transparency and consumer trust. As private-label penetration climbs in packaged foods, recurring testing volume expands, further enlarging the food safety testing, inspection, and certification market.
Consolidation of third-party laboratories
Mérieux NutriSciences acquired Bureau Veritas’ food testing business for EUR 360 million (USD 390 million) in January 2025, creating a network of more than 140 laboratories across 32 countries. Consolidated groups achieve economies of scale in accreditation maintenance, capital equipment utilization, and geographic reach. They can pool sample loads across facilities, introduce integrated data hubs, and negotiate higher volumes with equipment suppliers. Smaller labs face escalating capital requirements for advanced LC-MS/MS or next-generation sequencing platforms and therefore either specialize or seek acquisition. The concentration trend strengthens competitive moats for large incumbents and accelerates the shift to outsourced models.
Restraints Impact Analysis*
| Restraint | (~) % Impact on CAGR Forecast | Geographic Relevance | Impact Timeline |
|---|---|---|---|
| Fragmented compliance regimes across emerging markets | -0.8% | Emerging markets in Asia-Pacific, MEA, and Latin America | Medium term (2-4 years) |
| High cost of multi-standard accreditations for SMEs | -0.6% | Global, particularly affecting developing economies | Short term (≤ 2 years) |
| Shortage of qualified food toxicologists and auditors | -0.4% | Global, most acute in Asia-Pacific and MEA | Long term (≥ 4 years) |
| Climate-driven volatility in sampling representativeness | -0.3% | Global, with regional variations in severity | Long term (≥ 4 years) |
| Source: Mordor Intelligence | |||
Fragmented compliance regimes across emerging markets
Country-specific rules in emerging economies diverge from international standards, forcing exporters to navigate overlapping and sometimes conflicting test requirements. Vietnam and Nigeria, for example, introduced new residue limits and certification frameworks that are not yet harmonized with GFSI schemes, driving repeat sampling and duplicate documentation. Laboratories must maintain multiple accreditations, raising operating costs and lengthening turnaround times. Food companies adjust by limiting product lines or avoiding certain destinations, temporarily suppressing testing growth in those corridors until regulatory alignment improves.
High cost of multi-standard accreditations for SMEs
Securing ISO 17025 plus programs such as FSSC 22000 often requires initial outlays above USD 100,000 and recurring expenses near USD 50,000 per year, levels that strain the budgets of smaller processors and regional laboratories. Without accreditation, SMEs cannot access premium export channels, curbing the volume of outsourced work they generate. The financial hurdle is most acute in developing regions where profit margins are slim and credit availability is limited. While collaborative initiatives such as bioMérieux’s Trusted Third Party reduce some data costs, they do not eliminate upfront accreditation fees.
*Our forecasts treat driver/restraint impacts as directional, not additive. The impact forecasts reflect baseline growth, mix effects, and variable interactions.
Segment Analysis
By Service Type: Testing Services Lead Despite Certification Growth
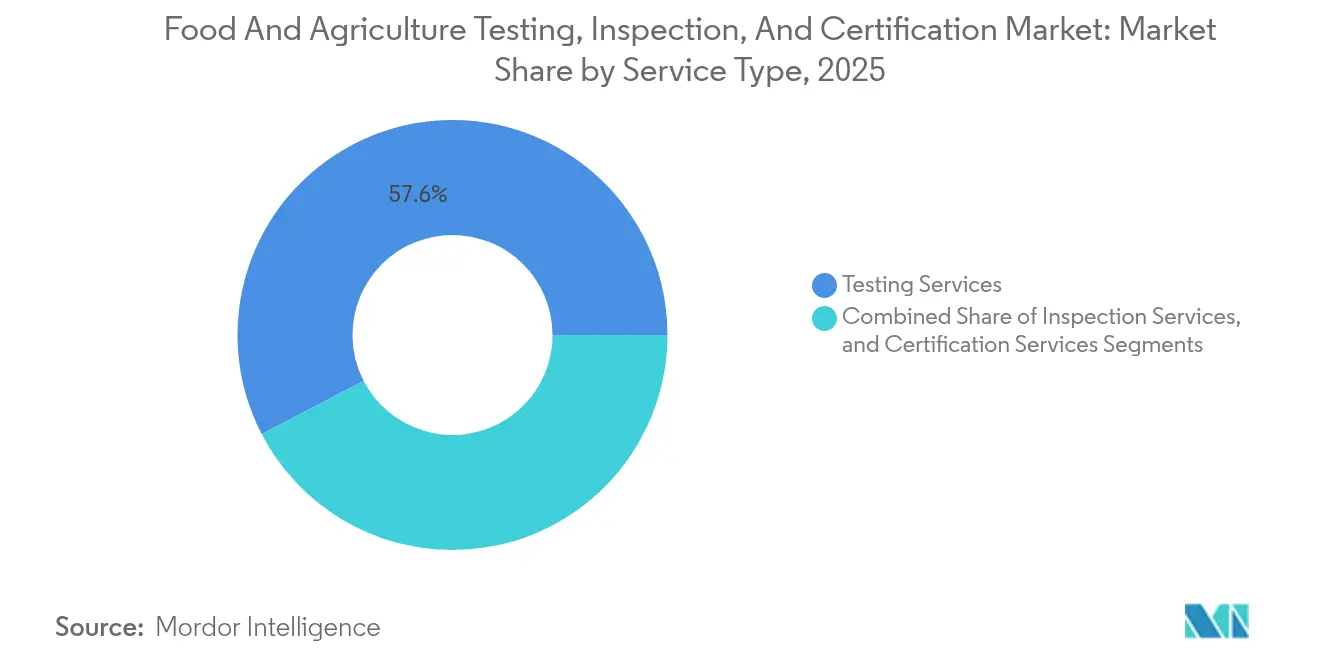
Testing Services accounted for 57.62% of the food and agriculture testing, inspection, and certification market in 2025, reflecting mandated pathogen, chemical residue, and nutritional analyses that every producer must complete. Certification Services grow faster at a 6.72% CAGR because brands use third-party stamps to differentiate on supermarket shelves. Inspection Services remain a smaller component, constrained by labor intensity yet indispensable for facility audits and process validation. Within Testing Services, demand for next-generation sequencing and LC-MS/MS drives premium pricing, while integrated data portals such as SGS SMART support value-added analytics. Over the forecast period, convergence between testing and certification will create bundled compliance solutions that lock in recurring revenue streams for providers.
Testing Services retain a critical mass because every new regulation, from allergen cross-contact thresholds to microplastic contamination limits, lengthens the assay checklist. Certification’s momentum stems from private-label retailers seeking consumer-visible assurances. Laboratories that invest in both categories can cross-sell, secure long contracts, and maintain utilization rates above 80%. SGS’s SMART illustrates how real-time dashboards integrate lab data and audit findings, establishing a single compliance narrative for clients. This end-to-end visibility reinforces the importance of outsourcing to large, tech-enabled providers.


By Sourcing Type: Outsourced Model Dominance Reflects Specialization Trends
Outsourced providers generated 72.34% of 2025 revenue and are set to expand at a 6.62% CAGR to 2031, cementing their lead. Complex regulations, rapid technology turnover, and high capital expenditure tilt the cost-benefit equation toward third-party labs except for the highest-throughput processors. In-house facilities survive where immediate line-release decisions are vital, yet even these plants outsource confirmatory tests for legal defensibility. The Trusted Third Party program launched by bioMérieux and Mérieux NutriSciences illustrates the network advantages of the outsourced model: pooled anonymized data generates supplier risk scores unavailable to isolated labs.
Companies discover that outsourcing not only supplies accredited results but also reduces liability because responsibility transfers to the certifier. Large laboratories further sweeten the proposition by offering subscription plans that bundle routine assays, unannounced audits, and traceability dashboards. As cross-border trade intensifies, producers prefer single points of service that carry global accreditations, a status unattainable for most in-house labs.
Geography Analysis
Asia-Pacific posted 43.12% of global revenue in 2025 and is forecast to grow at a 6.98% CAGR through 2031. China, India, and Southeast Asia expand both processing capacity and consumer demand, prompting investments in accredited laboratories. The Government of India funded 100 new NABL-accredited labs in the 2024 budget to support domestic safety oversight and export competitiveness. North America remains a center of regulatory innovation with the FDA’s LAAF program driving accreditation upgrades and increasing outsourced sample flows. Europe, while mature, shows steady demand for novel contaminant screening and premium certification services anchored on sustainability and animal-welfare criteria.
The Middle East and Africa represent the fastest emerging opportunity due to rising food imports and infrastructure development. The Philippines set up its first food quality lab in Cagayan Valley with PHP 5 million DOST funding to improve regional safety oversight. Countries in the Gulf Cooperation Council implement unified residue limits modeled on Codex Alimentarius, stimulating assay harmonization. Latin America benefits from soybean and meat export volumes that require multi-jurisdiction certificates, yet fragmented domestic regulations temper growth rates.
Regional comparison highlights divergent drivers. Asia-Pacific’s expansion originates from manufacturing scale and export orientation, whereas North America and Europe rely on stringent enforcement and private-label uptake. Africa’s growth is tied to donor-funded capacity building and import surveillance. Providers with global lab footprints and digital data networks can arbitrage these regional nuances and maintain high utilization.


Regulatory Landscape
Regulation-led compliance continues to be the primary demand anchor for food and agriculture TIC, with enforcement expanding beyond basic pathogen panels into residues, allergens, and ready-to-eat (RTE) microbiological controls. In the United States, the FDA FSMA Laboratory Accreditation for Analyses of Foods (LAAF) program, fully operational since 2024, increases the need for accredited laboratory capacity for designated analyses and reinforces third-party reliance for legally defensible results. In Europe, implementation timelines for updated microbiological criteria, including Regulation (EU) 2024/2895 applying from July 1, 2026, add specificity to Listeria monocytogenes controls for RTE foods, which increases routine environmental monitoring and drives more confirmation testing.
International and private standards updates add additional audit and certification demand. The Codex Alimentarius Commission adopted new standards at its 49th session (July 6-10, 2026), including guidance on precautionary allergen labeling and revised control measures for key pathogens. While this supports harmonization, it also raises documentation and verification requirements for exporters. On the analytical side, Regulation (EU) 2026/765 (adopted April 1, 2026, effective January 1, 2027) sets new rules for pesticide residue sampling and analysis in food and feed, prompting method updates and laboratory readiness work. In parallel, GFSI-recognized scheme updates, including FSSC 22000 Version 7 published in May 2026 and BRCGS updates effective August 10, 2026, along with the ISO 22002:2025 PRP series, increase audit scope across processing and retail/wholesale, expanding opportunities for multi-standard certification bodies and inspection teams.
Value Chain Analysis
Demand starts with growers, livestock producers, aquaculture operators, ingredient suppliers, processors, and brand owners that must demonstrate compliance to regulators, import authorities, and retail customers. From there, work moves through sampling and pre-analytics, including collection kits, cold-chain logistics, and chain-of-custody, into accredited laboratories for microbiology, chemistry, residues, allergens, and authenticity testing. Inspection and audit services run alongside laboratory workflows for facility programs (PRPs), HACCP/FSMS verification, and supplier assessments, while certification bodies provide scheme certifications (ISO 22000, FSSC 22000, BRCGS, IFS, SQF) that convert test and audit evidence into market-access credentials. Results management increasingly feeds into client QA systems through portals and regulatory intelligence subscriptions that consolidate specifications, limits, and documentation for multi-market trade.
Upstream TIC suppliers include analytical instrumentation and consumables, reference materials, LIMS and data platforms, and qualified technical labor such as toxicologists, microbiologists, and auditors. Consolidated lab networks and outsourced models dominate execution, using multi-site capacity to balance sample loads and maintain broad accreditations. In-house labs persist for high-throughput, rapid release testing, while they outsource confirmatory or specialized assays. Capability investments for emerging risks move through the value chain as new methods are validated and added to service catalogs, as seen in Intertek expanding cereulide toxin detection capacity in its Shanghai laboratories (February 2026), which supports additional testing demand from manufacturers into accredited third-party infrastructure.
Competitive Landscape
The top seven companies account for a majority of global revenue, indicating moderate concentration. SGS, Eurofins, Intertek, Bureau Veritas, and Mérieux NutriSciences compete on geographic coverage, accreditation scope, and technology adoption rather than on price. M&A remains the fastest route to capability expansion as demonstrated by Mérieux NutriSciences’ EUR 360 million purchase of Bureau Veritas’ food testing assets in 2025. Eurofins widened its U.S. footprint by opening a microbiology lab in Louisville, enabling faster turnaround times for regional processors.[4]Eurofins, “Signing of MOU between CDC and Eurofins,” eurofins.vnSGS strengthened its analytics suite by acquiring RTI Laboratories and 41% of Aster Global Environmental Solutions in January 2025.
Technology integration shapes the next competitive phase. SGS SMART delivers real-time dashboards that fuse lab data, blockchain traceability, and AI-powered risk alerts. Digital-native entrants deploy IoT sensors for continuous line monitoring, bypassing batch sampling cycles. Incumbents respond by partnering with sensor firms or integrating cloud platforms. Consolidation lowers unit costs for accreditation upkeep and accelerates innovation adoption, yet also raises regulatory scrutiny over market power.
White-space opportunities appear in novel food ingredient testing, cell-cultured protein verification, and carbon-footprint certification. Large incumbents allocate R&D budgets to these niches while forming alliances with start-ups. Competitive intensity stays moderate because accreditation and audit credentials act as barriers; nonetheless, digitally enabled challengers can win share in rapid growing niches.
Food And Agriculture Testing, Inspection, And Certification Industry Leaders
Bureau Veritas SA
SGS SA
Intertek Group Plc
TÜV SÜD AG
TÜV Rheinland AG
- *Disclaimer: Major Players sorted in no particular order


Market Opportunities and Future Outlook
Opportunities are most visible where compliance requirements become more data-driven and multi-standard, supporting integrated offerings that bundle testing, audits, certification, and digital evidence management. The FDA shift toward risk-based oversight, with greater reliance on state partners for routine inspections and increased use of AI and data-sharing to target higher-risk facilities, increases demand for continuous monitoring data, defensible documentation, and rapid response testing programs that can withstand regulatory scrutiny across domestic and imported supply chains. Scheme updates, including FSSC 22000 Version 7 and the ISO 22002:2025 PRP series, also create a renewal cycle for gap assessments, auditor capacity, and combined certification packages, particularly for manufacturers serving private-label retailers with brand-specific protocols.
A second opportunity area is proactive, platform-enabled compliance that reduces fragmentation across export corridors. SGS launched its FoodNexus platform in March 2026 to combine regulatory intelligence with risk analytics, indicating a move from point-in-time certificates toward subscription-style compliance management where laboratories and certifiers monetize data interpretation and supplier risk scoring alongside assays. On public standards, the Codex Alimentarius Commission Strategic Plan 2026-2031 prioritizes horizon-scanning and stronger use of scientific data, supporting expansion of test menus for emerging hazards and more frequent method updates by accredited labs. In regions where governments are building accredited capacity, such as India funding 100 new NABL-accredited labs in its 2024 budget, whitespace remains for international TIC providers to partner with local networks, train auditors, and support multi-standard accreditation while still serving exporters that need globally accepted certificates.
Recent Industry Developments
- July 2026: SGS published guidance on Regulation (EU) 2024/2895 for Listeria monocytogenes compliance in ready-to-eat foods. The guidance clarifies compliance pathways and expands SGS's service offerings for food safety regulation adherence.
- July 2026: SGS awarded the first automotive 5G performance mark to Li Auto for its L9 Livis 5G intelligent cockpit platform. The award strengthens market credibility and expands SGS's certification footprint in connected vehicle ecosystems.
- June 2026: Bureau Veritas announced support for FSSC 22000 Version 7 transition including gap analysis and certification services. The support helps clients upgrade certifications efficiently and sustains standard momentum.


Research Methodology Framework and Report Scope
Market Definition and Coverage
This market covers third-party and in-house revenue generated from testing, inspection, and certification activities used to verify safety, quality, and compliance for agriculture inputs and food products across the farm-to-fork chain, including lab testing, on-site inspections, and standards-based certifications.
Scope exclusions: It excludes pure consulting, non-assurance training services, and stand-alone software platforms that do not include testing, inspection, or certification delivery.
Segmentation Overview
- By Service Type
- Testing Services
- Inspection Services
- Certification Services
- By Sourcing Type
- In-house
- Outsourced
- By Geography
- North America
- United States
- Canada
- Mexico
- South America
- Brazil
- Argentina
- Rest of South America
- Europe
- Germany
- United Kingdom
- France
- Italy
- Spain
- Russia
- Rest of Europe
- Asia-Pacific
- China
- Japan
- India
- South Korea
- South-East Asia
- Rest of Asia-Pacific
- Middle East and Africa
- Middle East
- Saudi Arabia
- United Arab Emirates
- Turkey
- Rest of Middle East
- Africa
- South Africa
- Nigeria
- Rest of Africa
- Middle East
- North America
Data Sources, Market Sizing, and Validation
Desk Research
To build the starting data backbone, we first mapped regulatory and trade signals that typically drive TIC demand in agriculture and food. Public sources such as the US FDA, USDA, EFSA, the European Commission, and Codex Alimentarius were used to understand testing triggers, inspection intensity, and how compliance requirements differ by product category and origin country.
We then connected those triggers with measurable market indicators using sources such as UN Comtrade trade statistics, government border inspection releases where available, and published accreditation and standard directories (for example, ISO related registries and national accreditation bodies). Company annual reports, investor materials, and reputable press were used to sanity-check service mix and outsourcing trends, while a paid subscription for company financials and news helped standardize currency, fiscal-year timing, and corporate structure mapping. These desk sources are illustrative only, and many other public references were also used for data collection, validation, and clarification.
Primary Interviews and Surveys
Primary work was used to fill the gaps that desk sources rarely explain well, especially pricing logic, how bundled programs are billed, and the split between testing, inspection, and certification in real contracts. We spoke with quality and compliance leaders, laboratory and audit operations managers, procurement teams at food brands and agri-input suppliers, and selected channel stakeholders across major consuming and exporting regions so assumptions could be corrected before finalizing the model.
Distribution of primary research fieldwork respondents
| Company type | Respondent position | Region |
|---|---|---|
| Top tier: 34% | CXOs: 14% | APAC: 45% |
| Mid tier: 45% | Functional/Unit leaders: 28% | EMEA: 32% |
| Smaller Players: 21% | Managers: 58% | Americas: 23% |
Market-Sizing & Forecasting
Sizing was done using a top-down and bottom-up approach, where regulatory driven activity levels were first reconstructed into a demand pool and then tested against supply-side reality checks. On the top-down side, food trade flows and border compliance intensity were paired with typical testing panels and inspection frequency to estimate the addressable volume of assurance activity that is likely to be paid for.
To keep the model grounded, we corroborated totals with selective bottom-up approximations such as sampled price-per-test and audit day-rates, laboratory utilization discussions, and roll-ups from a tracked set of service providers across key regions. Inputs that materially move the model included cross-border food trade value, share of high-risk categories requiring higher test frequency, recall and non-compliance signals that affect inspection intensity, outsourcing share versus in-house labs, and average price progression for multi-residue panels and certification audits.
Forecasts were developed using scenario analysis, where baseline growth is linked to expected tightening of traceability and import requirements, and then adjusted using expert views on price inflation, lab capacity additions, and shifts toward bundled farm-to-fork programs. Where bottom-up gaps existed for smaller local providers, we used conservative penetration assumptions by region and service mix, which were then revisited during validation calls.
Data Validation & Update Cycle
Outputs were checked through multiple steps so the final numbers do not rely on any single input. We compared modeled totals with independent signals such as trade exposure, enforcement intensity, and announced lab and audit capacity changes, and then investigated outliers at country and service-type levels before sign-off.
During review, assumptions that drove large variances were re-tested through follow-up outreach, and sensitivity checks were used to confirm the estimate stays stable when any one variable moves within a realistic range. Reports are refreshed annually, with interim updates when material events occur, and a final pre-delivery pass is completed so clients receive the most current view available at that time.
Mordor Intelligence's Testing Inspection and Certification Market for Agriculture and Food Market Sizing Compared With Other Published Estimates
Published market sizes for agriculture and food TIC can look far apart because the service boundary is not consistent across sources, and the same activity is sometimes counted twice when programs bundle testing, inspection, and certification under one fee. Differences also come from whether the estimate is built around food-only safety testing, or whether it also includes upstream agriculture inputs and farm audits.
The spread is usually driven by what gets included as billable TIC revenue (for example, product testing plus on-site verification versus testing alone), how in-house quality labs are treated, and whether cross-border compliance volumes are tied to actual trade and enforcement signals or assumed penetration rates. Some sources also apply aggressive price escalation to lab panels without checking it against the real shift toward bundled contracts, which is why the table shows a wide range, with the tighter scope and refresh cadence applied here near the end of the modeling steps by Mordor Intelligence.
Benchmark comparison
| Source | Market Size | Gaps in Research Methodology |
|---|---|---|
| Mordor Intelligence | USD 32.27 B (2026) | |
| Industry Association A | USD 28.90 B (2026) | Often reflects testing-heavy programs and may exclude a portion of inspection days and certification audit revenue, especially upstream farm and feed assurance activities, which reduces the counted service pool. |
| Global Consultancy B | USD 38.60 B (2026) | Typically uses broader inclusion rules that can fold adjacent assurance services into TIC, and it may apply higher blended ASP uplift assumptions without consistent checks against bundled contract pricing and outsourcing shares. |
Overall, the differences mostly come down to service inclusions and how price and volume are translated from compliance activity into revenue. By keeping variables tied to observable enforcement and trade signals, and then re-checking pricing and service mix through interviews, the estimate stays traceable to repeatable steps that a buyer can audit and update.


Key Questions Answered in the Report
How large is the food and agriculture testing, inspection, and certification market in 2026?
It is valued at USD 32.27 billion in 2026, with a projected 6.36% CAGR to 2031.
Which region leads revenue today?
Asia-Pacific generated 43.12% of 2025 revenue and is also the fastest-growing at 6.98% CAGR.
What segment shows the quickest growth?
Certification Services are forecast to expand at a 6.72% CAGR through 2031 as brands leverage third-party verification.
Why do companies favor outsourced testing?
Outsourcing offers broader accreditations, specialized expertise, and lower per-sample costs than maintaining in-house labs.
What technologies influence future demand?
Artificial intelligence, blockchain traceability, next-generation sequencing, and LC-MS/MS drive accuracy and speed, expanding testing scope.
Page last updated on:






