
Temperature Data Logger Market Size and Share
Market Overview
| Study Period | 2020 - 2031 |
|---|---|
| Market Size (2026) | USD 1.43 Billion |
| Market Size (2031) | USD 1.76 Billion |
| Growth Rate (2026 - 2031) | 4.24 % |
| Fastest Growing Market | Asia Pacific |
| Largest Market | North America |
| Market Concentration | Medium |
Major Players *Disclaimer: Major Players sorted in no particular order Image © Mordor Intelligence. Reuse requires attribution under CC BY 4.0. | |
Temperature Data Logger Market Analysis by Mordor Intelligence
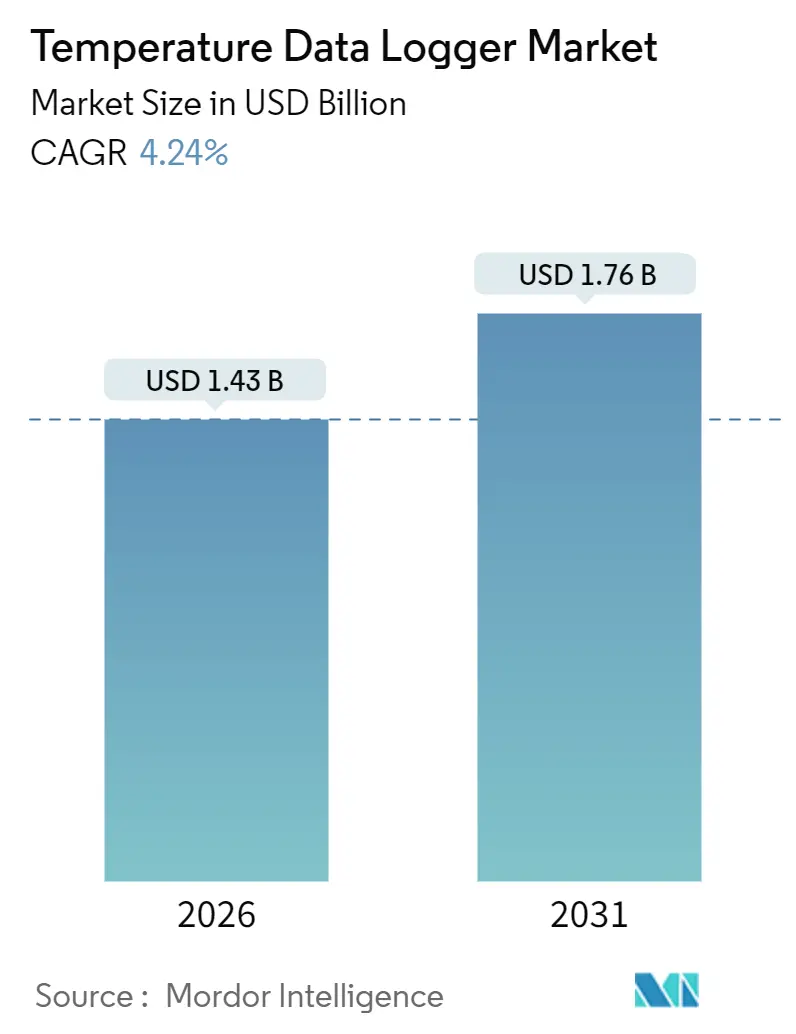
The Temperature Data Logger Market size is estimated at USD 1.43 billion in 2026, and is expected to reach USD 1.76 billion by 2031, at a CAGR of 4.24% during the forecast period (2026-2031).
Demand is shifting toward cellular and IoT-connected devices, which are growing 7.06% annually, while Wi-Fi loggers that held 41.68% share in 2025 face battery-life and interoperability pressures. Regulatory mandates for digital cold-chain compliance in emerging economies, the rapid scale-up of mRNA vaccine pipelines that require ultra-cold tracking, and the expansion of hyper-local grocery fulfillment centers are widening the application base. Competition is intensifying as IoT-platform specialists bundle hardware at cost and monetize analytics subscriptions, forcing traditional instrument makers to add over-the-air updates and encrypted transmission. Lithium battery price volatility and connectivity fragmentation in Europe continue to weigh on margins, yet long-life sensors and miniaturized electronics are lowering ownership costs and extending device cycles, supporting steady growth across sectors.
Key Report Takeaways
- By utility, reusable loggers led with 57.73% revenue share in 2025, while single-use devices are advancing at a 4.71% CAGR through 2031.
- By type, USB devices accounted for 34.91% of the temperature data logger market share in 2025, whereas Bluetooth Low Energy loggers are set to expand at a 5.23% CAGR to 2031.
- By connectivity, Wi-Fi systems commanded 41.68% share in 2025, yet cellular and IoT-connected units are on course for a 7.06% CAGR over the same horizon.
- By application, life sciences and healthcare held 34.19% share in 2025, while cold-storage logistics remain the fastest climber at a 5.47% CAGR.
- By geography, North America dominated with 37.26% share in 2025, but Asia-Pacific is forecast to post a 5.67% CAGR through 2031.
Note: Market size and forecast figures in this report are generated using Mordor Intelligence’s proprietary estimation framework, updated with the latest available data and insights as of January 2026.
Market Trends and Insights
Drivers Impact Analysis of Temperature Data Logger Market*
| Driver | (~) % Impact on CAGR Forecast | Geographic Relevance | Impact Timeline |
|---|---|---|---|
| Mandated Digital Cold-Chain Compliance in Emerging Economies | +1.2% | Asia-Pacific, Middle East and Africa, South America | Medium term (2-4 years) |
| Proliferation of mRNA Vaccine Pipelines Requiring Ultra-Cold Monitoring | +0.9% | Global, with concentration in North America and Europe | Short term (≤ 2 years) |
| IoT-Enabled Asset Visibility Platforms Driving Logger Bundling | +0.8% | Global, led by North America and Asia-Pacific | Medium term (2-4 years) |
| Miniaturization of Low-Power Sensors Extending Battery Life Beyond 5 Years | +0.6% | Global | Long term (≥ 4 years) |
| Expansion of Hyper-Local Fulfillment Centers Boosting Ambient Logger Demand | +0.5% | North America, Europe, urban Asia-Pacific | Short term (≤ 2 years) |
| Real-Time AI Analytics Unlocking Predictive Maintenance of Cold Storage | +0.4% | North America, Europe, select Asia-Pacific hubs | Long term (≥ 4 years) |
| Source: Mordor Intelligence | |||
Mandated Digital Cold-Chain Compliance in Emerging Economies
Regulators in India, Kenya, and South Africa began enforcing real-time temperature logging between 2024 and 2025, pushing distributors to retrofit fleets with cellular loggers that broadcast every 15 minutes.[1] Compressed implementation windows have replaced manual USB retrieval with always-connected units, accelerating hardware replacement cycles. Single-use shipments to sub-Saharan Africa rose 34% year over year in 2025 as distributors opted for tamper-evident devices that simplify audits. Vendors offering turnkey dashboards and local-language interfaces are gaining early footholds. The rising compliance bar is expected to cascade to other emerging markets, creating a secular pull for the temperature data logger market. Even regional food regulators are adopting the same digital templates, broadening the rule’s impact beyond pharmaceuticals.
Proliferation of mRNA Vaccine Pipelines Requiring Ultra-Cold Monitoring
World Health Organization guidance issued in 2024 cemented −70 °C to −80 °C as the storage benchmark for next-generation mRNA products.[2] Maintaining this band reduced potency loss to below 2%, compelling manufacturers to specify loggers with ±0.5 °C accuracy and one-minute sampling. Ultra-cold freezer makers now bundle calibrated loggers by default, turning an aftermarket accessory into standard equipment. Twelve CEPI-funded mRNA candidates under development each consume thousands of single-use loggers during validation trials. North American and European distributors fast-tracked upgrades, spurring above-market growth for ultra-cold-capable models. This dynamic positions the temperature data logger market as an essential enabler of mRNA supply chains over the next decade.
IoT-Enabled Asset-Visibility Platforms Driving Logger Bundling
Logistics operators are migrating from temperature-only monitoring to multi-sensor dashboards that merge location, shock, humidity, and thermal data. The 2024 Sensitech-Qualcomm collaboration embedded 5G modems into loggers, delivering geofencing alerts that cut claim rates by 23% for early adopters. Subscription pricing of USD 8-15 per shipment is replacing capital purchases, lowering barriers for smaller shippers. Retailers such as Walmart require platform-compatible loggers for preferred-vendor status, forcing suppliers to standardize. Device vendors lacking cloud ecosystems risk commoditization, while analytics-first players monetize long-tail data. The resulting shift concentrates value in software even as hardware volumes climb.
Miniaturization of Low-Power Sensors Extending Battery Life Beyond 5 Years
New sensor and timer chips launched in 2024 shaved power draw to microampere levels. Reusable loggers equipped with these components can operate for 7 years on a coin cell, eliminating the need for annual battery swaps. NOAA field deployments in 2025 validated the maintenance savings, and pharmaceutical protocols now accept reusable devices with documented five-year stability. Extended life reduces e-waste and total cost per shipment, prompting buyers to consider reusable units even in previously disposable-only scenarios. The innovation cycle supports gradual margin recovery for premium devices within the temperature data logger market.
Restraints Impact Analysis of Temperature Data Logger Market*
| Restraint | (~) % Impact on CAGR Forecast | Geographic Relevance | Impact Timeline |
|---|---|---|---|
| Fragmented Connectivity Standards Hindering Interoperability | -0.7% | Global, acute in Europe and Asia-Pacific | Medium term (2-4 years) |
| Rising Lithium Supply Constraints Increasing Battery Costs | -0.5% | Global | Short term (≤ 2 years) |
| Cyber-Security Vulnerabilities Undermining Data Integrity Trust | -0.4% | Global, concentrated in regulated sectors | Medium term (2-4 years) |
| End-User Skill Gaps in Data Analytics Slowing Full Deployment | -0.3% | Emerging markets in Asia-Pacific, Middle East and Africa, South America | Long term (≥ 4 years) |
| Source: Mordor Intelligence | |||
Fragmented Connectivity Standards Hindering Interoperability
Europe’s patchwork of LTE-M, NB-IoT, and LoRaWAN forces shippers to maintain parallel logger fleets or tolerate data blackouts when crossing borders.[3] Integration testing stretched DHL’s 2025 pilot across 18 countries over 14 months, delaying rollouts. Cloud gateways add another layer of complexity as AWS, Azure, and Google Cloud require distinct provisioning flows. The resulting friction nudges smaller importers back to offline USB models, limiting real-time visibility gains. Although 3GPP Release 18 introduced RedCap to harmonize IoT radios, adoption remained below 5% of new logger shipments in late 2025.
Rising Lithium Supply Constraints Increasing Battery Costs
Lithium carbonate prices peaked at USD 28,000 per metric ton in early 2025 as electric-vehicle packs soaked up supply. Single-use logger makers dependent on lithium-thionyl chloride cells saw unit costs jump 54%, squeezing margins they could not pass on to price-sensitive pharmaceutical distributors. Berlinger disclosed a 320-basis-point margin erosion in its 2024 report. Sodium-ion pilots offer hope but lack low-temperature performance, leaving ambient-only niches for substitution. Until new mines ramp up, battery inflation will cap profitability despite healthy volume growth in the temperature data logger market.
*Our forecasts treat driver/restraint impacts as directional, not additive. The impact forecasts reflect baseline growth, mix effects, and variable interactions.
Temperature Data Logger Market Segment Analysis
By Utility:
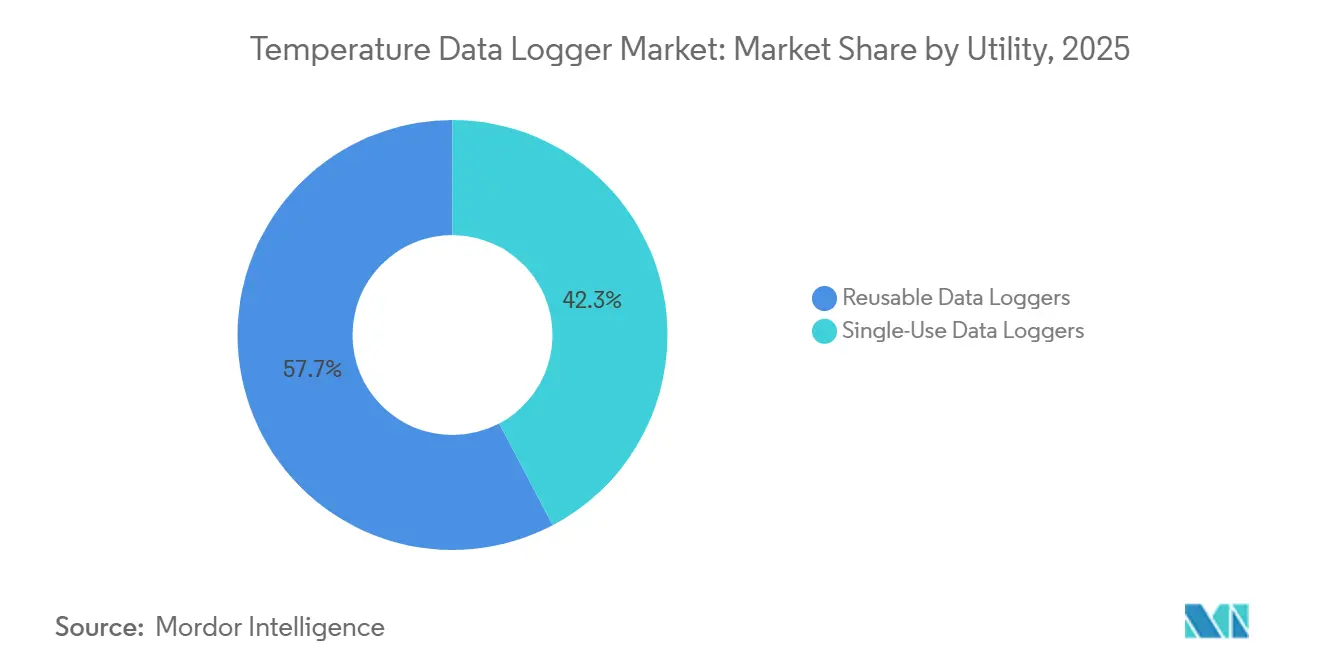
Single-Use Devices Capture Clinical-Trial ShipmentsSingle-use loggers expanded at a 4.71% CAGR through 2031, yet reusable devices retained 57.73% share in 2025. The single-use value proposition resonates with pharmaceutical sponsors that prioritize NIST-traceable calibration and zero cross-contamination between trials. Pfizer’s 2024 protocol update made disposable units mandatory for investigational products, a policy Merck mirrored within a year. Reusable loggers continue to dominate environmental monitoring and food processing, where multi-year calibration cycles dovetail with plant maintenance. The cost crossover occurs after 8-10 uses, above which reusable devices with swap-out battery packs, such as DicksonOne units introduced in 2025, become economical.
Longer life sensors and over-the-air recalibration are tipping the calculus in favor of reusable models for warehouse fleets. However, accelerated clinical pipelines and strict chain-of-custody rules in emerging markets keep disposable demand robust. The temperature data logger market thus supports dual tracks: high-end reusable systems for stationary facilities and scalable single-use units for point-to-point logistics. Vendors that offer unified dashboards spanning both formats are gaining preferred-supplier status, reinforcing the ecosystem play.
By Type:
Bluetooth Low Energy Loggers Outpace USB MainstaysBluetooth Low Energy units are on track for a 5.23% CAGR through 2031, while USB devices that held 34.91% share in 2025 continue to decline. BLE’s appeal lies in its frictionless pairing with smartphones, enabling instant data sync without Wi-Fi or cables. Testo’s Saveris 2 gateway architecture cuts connectivity costs by 70% compared with direct cellular, supporting scale-up in multi-room cold stores.[4] USB models such as Lascar’s EL-USB-TC persist where air-gapped security is paramount, including defense and nuclear medicine labs. Web-based Ethernet loggers occupy a niche in fixed hospital pharmacies already wired for LAN access.
Hardware consolidation around BLE 5.2 simplifies firmware maintenance and accelerates adoption. As corporates deploy hybrid fleets, data harmonization becomes critical, spurring demand for cloud connectors that normalize USB CSV dumps and BLE real-time feeds. The temperature data logger market, therefore, balances legacy inertia with mobile-first innovation, a dynamic that shapes vendor roadmaps through the forecast period.
By Connectivity:
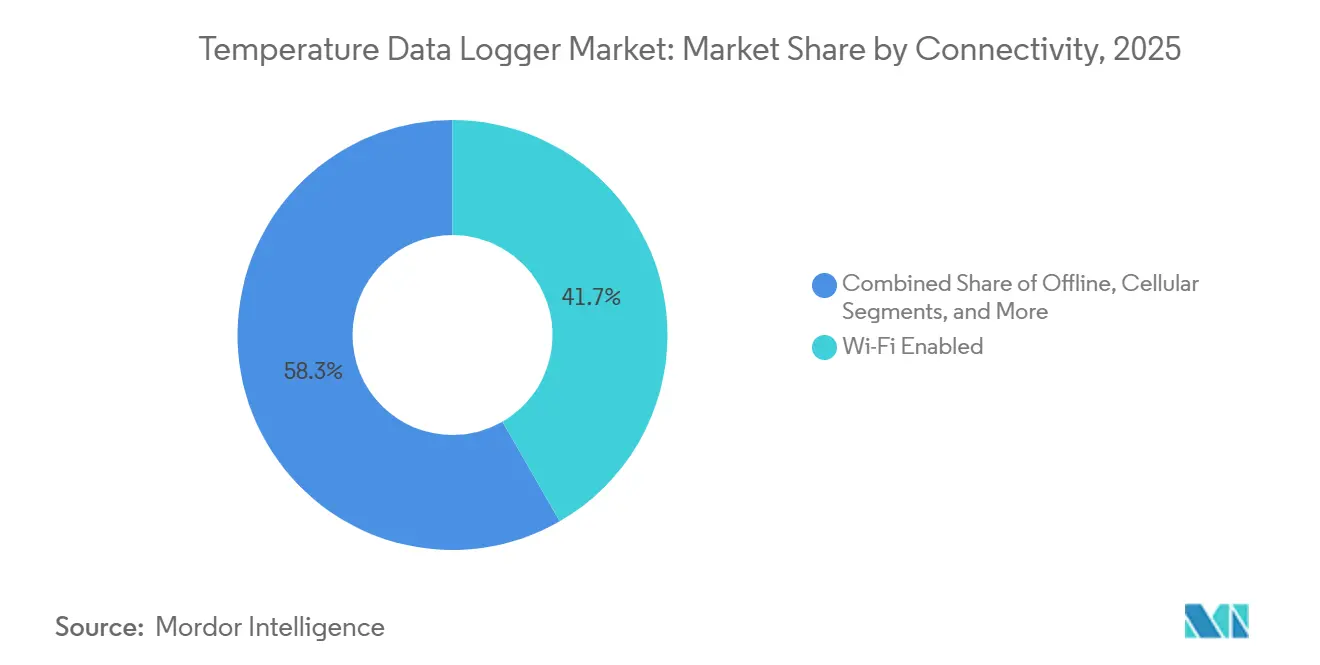
Cellular IoT Leads Real-Time VisibilityCellular and IoT-connected devices are expanding at 7.06% CAGR, the highest among connectivity types, as cross-border shippers demand uninterrupted telemetry. Wi-Fi loggers, which held a 41.68% share in 2025, remain entrenched in laboratories and retail pharmacies where access points are stable. Rotronic’s dual-radio HL-NT3 mitigates roaming losses by switching between LTE-M and NB-IoT within 30 seconds, covering 120 countries without manual SIM updates. Wi-Fi systems face network security hurdles that slow provisioning, though Vaisala’s on-premises servers help navigate strict compliance regimes.
RFID and NFC tags fill serialization niches, with Avery Dennison integrating blockchain to seal audit trails. Offline stand-alone units survive in expeditionary science and remote agriculture where power and coverage remain absent. As operators evaluate the total cost of cellular data versus Wi-Fi infrastructure, hybrid architectures that pool logger traffic through gateways are gaining attention. This coexistence underpins steady diversification inside the temperature data logger market.

By Application:
Cold-Storage Logistics Become Fastest-Growing Use CaseLife sciences and healthcare commanded 34.19% of 2025 demand, but cold-storage logistics are growing at 5.47% CAGR as e-grocery chains roll out hyper-local hubs. Amazon Fresh runs 200-plus ambient loggers per micro-fulfillment center, integrating location and thermal alerts into routing algorithms. The U.S. Department of Agriculture’s 8 °C, 20-minute dairy threshold serves as the anchor for alert logic. High-value biologics now pair cellular telemetry with shock sensors, whereas lower-priced vaccines migrate to BLE devices that download data on arrival, balancing cost and compliance.
Food processing remains price-sensitive, favoring USD 50–80 USB models to cover HACCP checkpoints. Industrial environmental monitoring is moving toward wireless sensor networks that consolidate pressure and humidity measurements, trimming installation costs by 40% compared with discrete loggers. Museums, horticulture, and specialty manufacturing together contribute 12% of shipments, expanding in line with the broader temperature data logger market. Vendors that tailor firmware profiles to vertical-specific alarm thresholds gain traction as buyers prioritize plug-and-play validation.
Geography Analysis
APAC Temperature Data Logger Market
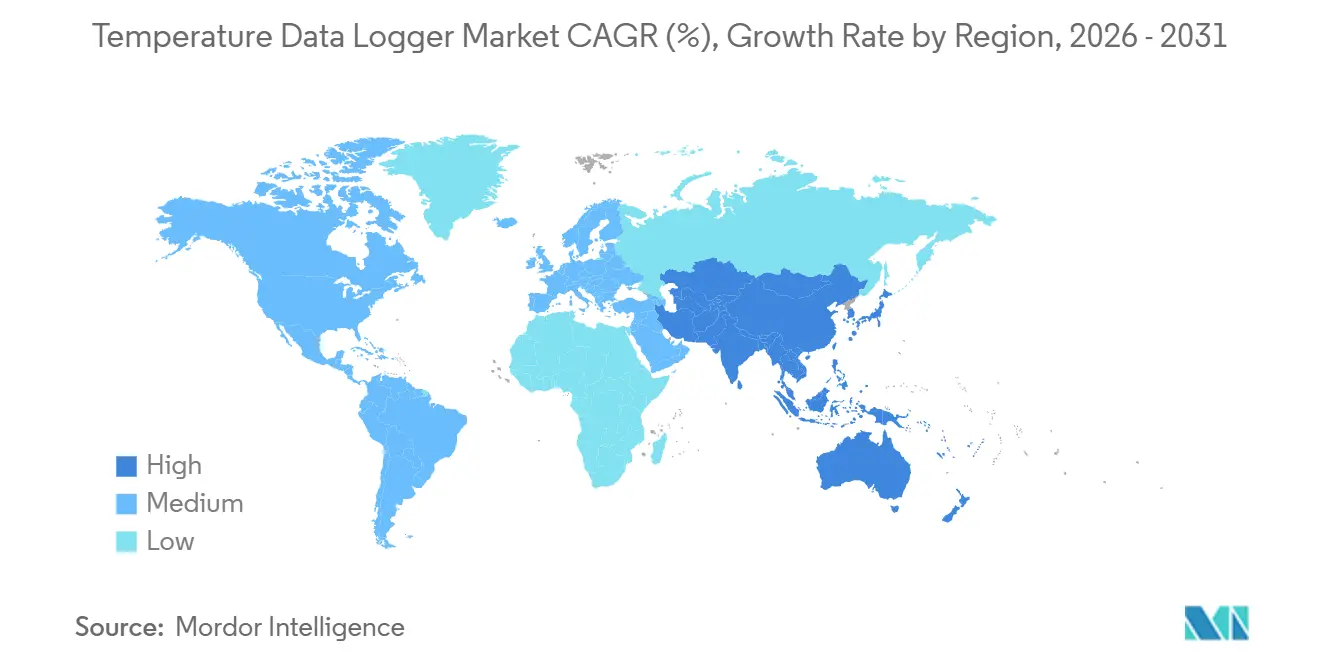
Asia-Pacific delivers the fastest regional trajectory at a 5.67% CAGR to 2031, propelled by China’s cold-chain guidelines and India’s real-time vaccine mandate. China added 14 million m³ of refrigerated capacity in tier-2 cities in 2024, each new warehouse requiring 500-800 compliant loggers. India’s Food Safety and Standards Authority ordered live temperature feeds for every vaccine lane in 2025, triggering the replacement of 180,000 legacy USB units. Japan shortened calibration intervals to six months, steering hospitals toward reusable loggers with cloud certificates. These synchronized rules are expanding the temperature data logger market across the region, despite price sensitivity in lower-income economies.
North America Temperature Data Logger Market
North America retained a 37.26% share in 2025, supported by robust Food Safety Modernization Act enforcement and stringent good distribution practice audits. Platform adoption is mature; 62% of U.S. pharmaceutical distributors already use IoT-enabled loggers, evidencing the market’s pivot toward analytics. Hyper-local grocery expansion further boosts ambient logger volumes, while federal agencies advance cybersecurity baselines that favor vendors offering over-the-air patching. Stable regulatory clarity cushions demand against economic swings.
EMEA and South America Temperature Data Logger Market
Europe’s adoption pace is tempered by connectivity fragmentation, even though good distribution practice updates issued in 2024 created a retrofit wave. Logistics providers juggle LTE-M, NB-IoT, and LoRa fleets, raising ownership costs and slowing device turnover. Nevertheless, GDP compliance still drives 40% of regional purchases, and subsidy programs in Germany and France offset part of the hardware upgrade costs. South America, the Middle East, and Africa remain sub-scale but invest in solar-powered cellular loggers for off-grid depots financed by Gavi grants. These long-tail markets offer attractive growth runways as digital cold-chain standards globalize.
Regulatory Landscape
Regulation for temperature data loggers sits at the intersection of public-health mandates and performance/verification standards that define how temperature records are created, retained, and audited across cold-chain use cases. In 2024-2025, enforcement tightened in several emerging markets (including India, Kenya, and South Africa) around real-time temperature logging for regulated distribution lanes, which accelerated adoption of connected loggers over manual USB retrieval. At the public procurement level, WHO PQS E006/DL01.3 (revised May 2025) provides an international specification reference for integrated data loggers and machine-to-machine interfaces used in vaccine cold-chain equipment.
On the standards side, IEC 63206:2024 established performance evaluation methods for data loggers and industrial recorders, with EU-aligned adoption via EN IEC 63206:2025. Verification and metrology practices are reinforced by standards such as SIST EN 13486:2024, which details periodic verification procedures for temperature recorders spanning ultra-cold through ambient ranges (-80 C to +85 C). In the United States, state-level public health requirements (for example, Massachusetts data logger requirements published for 2026) codify minimum behaviors such as capturing and storing min/max temperatures at least twice daily, supporting audit readiness for immunization and related programs.
Value Chain Analysis
The value chain begins with core components, including temperature sensing elements, microcontrollers and timing chips, memory, batteries, and wireless modules such as BLE, Wi-Fi, LTE-M/NB-IoT, and LoRaWAN. This is followed by firmware development, device assembly, and calibration. For regulated customers, calibration is often aligned to ISO 17025 and functions as a gating step for pharma, healthcare, and validated cold-chain deployments, while connectivity fragmentation, cybersecurity hardening, and battery-cost volatility shape upstream design decisions, especially for cellular and single-use devices.
Go-to-market typically splits between direct enterprise sales for life sciences, healthcare, and large logistics operators, and channel partners or distributors that handle local inventory, installation, and ongoing services such as re-calibration, device replacement, and dashboard onboarding. A growing share of value is also captured after shipment through cloud platforms that bundle hardware with subscriptions, analytics, and compliance workflows, shifting margin emphasis from the logger itself to data services and integration. Vendors with global distribution and installation footprints, for example Dickson Data operating decision-making centers across the United States, France, and Malaysia for its monitoring network, use regional partners to support validation documentation, field service, and multi-site rollouts.
Competitive Landscape
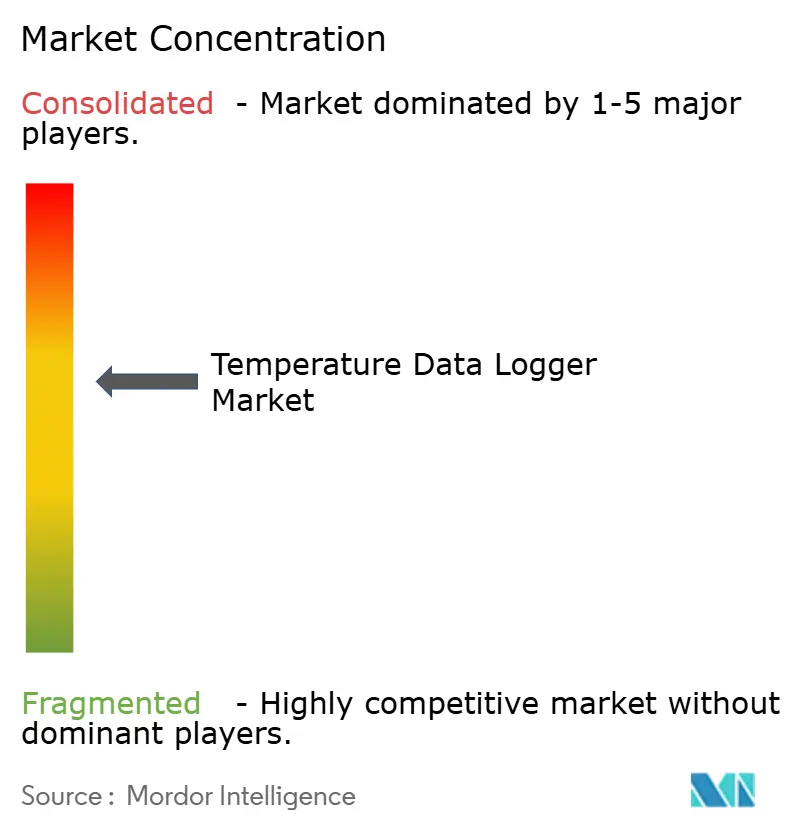
The temperature data logger market is moderately fragmented; the top five suppliers (Vaisala, Testo, Sensitech, Rotronic, and Onset) controlled a fair share of market revenue in 2025. Traditional instrument makers defend turf with ISO 17025 calibration and high-accuracy probes, while IoT specialists bundle devices at cost and monetize data subscriptions. Carrier’s 2024 purchase of Sensitech folded logger telemetry into the Lynx Fleet refrigeration suite, forging an end-to-end cold-chain platform that locks in trucking fleets. Startups such as Roambee deploy zero-upfront pricing, charging per shipment to lure cash-constrained regional distributors.
Technology differentiation now centers on firmware updateability and security compliance, following NIST's 2024 baseline update. Vendors can patch devices remotely, without retrieving devices, lowering total costs and liability for pharmaceutical clients. Patent filings cluster around low-power radio and battery algorithms, with Texas Instruments securing 14 new patents in 2024. Regional specialists remain relevant by localizing dashboards and offering 24-hour field support, but cross-border trade increasingly favors global platforms. Strategic moves in 2025 included Testo’s partnership with Siemens for HVAC predictive maintenance and Rotronic’s rollout of its dual-radio logger, underscoring the convergence between building automation and cold-chain telemetry. Competitive intensity is therefore poised to rise as service-centric models gain ground.
Temperature Data Logger Industry Leaders
-
OMEGA Engineering Inc. (Spectrics)
-
Sensitech Inc.
-
Testo SE & CO. KGaA
-
ELPRO-BUCHS AG
-
Onset Computer Engineering
- *Disclaimer: Major Players sorted in no particular order
Temperature Data Logger Market Companies Covered in this Report
- OMEGA Engineering Inc.
- Cryopak
- Hioki EE Corporation
- Testo SE & Co. KGaA
- Rotronic AG
- Onset Computer Corporation
- Lascar Electronics Limited
- NOVUS Automation Inc.
- Protimeter
- MadgeTech Inc.
- Global Cold Chain Solutions Pty Limited
- ThermoWorks Inc.
- Kimo Instruments
- ELPRO-BUCHS AG
- Softbox Systems Limited
- Roambee Corporation
- Sensitech Inc.
- DeltaTrak Inc.
- Vaisala Oyj
- LogTag Recorders Ltd.
- Dickson Data
- Campbell Scientific Inc.
- Berlinger & Co. AG
Market Opportunities and Future Outlook
Near-term whitespace is concentrated in compliance-grade, always-connected logging that reduces manual retrieval and improves audit trails, particularly as regulators move from periodic checks to continuous monitoring. WHO guidance issued in 2024 reinforced ultra-cold storage expectations for next-generation mRNA products (-70 C to -80 C), and buyers increasingly specify tighter accuracy (such as +/-0.5 C) and higher sampling rates, creating demand for ultra-cold capable models, calibrated probes, and bundled freezer-plus-logger packages. Platform-driven procurement is also reshaping selection criteria: retailers such as Walmart require platform-compatible loggers for preferred-vendor status, increasing demand for interoperable devices and cloud connectors that normalize mixed fleets (USB CSV archives alongside BLE and cellular real-time streams).
A second opportunity area is logistics-scale standardization and integration with broader asset-visibility programs, where temperature becomes one of several telemetry layers (location, shock, humidity) used to manage claims and service quality. Maersk has highlighted this direction by deploying next-generation IoT connectivity devices across a significant portion of its refrigerated container fleet, which points to requirements for ruggedized, low-maintenance, energy-harvesting or long-life designs that can operate across global routes. In parallel, regulatory and data-governance changes in Europe push connected-product suppliers toward secure, structured user access to generated operational data, encouraging vendors to build stronger APIs, governance controls, and exportable audit evidence as productized features rather than custom integrations.
Recent Industry Developments in Temperature Data Logger Market
- February 2026: Sensitech expanded the SensiWatch platform to include vessel location integration and predictive arrival time insights. The upgrade strengthens end-to-end visibility across multiple cold-chain networks and ties temperature excursions to in-transit risk signals. This development supports broader data-driven decision making and continuous compliance workflows.
- November 2025: Rhenus Logistics expanded deployment of the testo Saveris 1 monitoring system, using more than 250 measuring points across 150 devices at a single site. The rollout illustrates scaling of networked monitoring from point solutions to facility-wide systems that support continuous compliance and centralized documentation.
- October 2024: Sensitech entered a strategic collaboration with Qualcomm Technologies to incorporate the Qualcomm Aware Platform into TempTale GEO X for improved location precision. Bringing a major IoT location platform into a cold-chain logger ecosystem supports tighter geofencing, improved traceability, and stronger integration into multi-sensor asset-visibility stacks.
Temperature Data Logger Market Report Scope and Research Methodology
Market Definition and Coverage
This market covers devices that measure and record temperature over time, store the readings, and enable retrieval for monitoring, compliance, and traceability in real-world operations.
Scope exclusions: We exclude general-purpose data loggers that are not designed or sold for temperature monitoring, as well as pure temperature sensors sold without a logging function.
Segments Covered in This Report
- By Utility
- Single-use Data Loggers
- Reusable Data Loggers
- By Type
- USB Data Loggers
- Bluetooth Low Energy (BLE) Enabled Data Loggers
- Web-Based Data Loggers
- Wireless Data Loggers
- By Connectivity
- Offline / Stand-Alone
- Wi-Fi Enabled
- Cellular / IoT-Connected
- RFID / NFC-Enabled
- By Application
- Life Sciences and Healthcare (Hospitals, Laboratories, Pharmaceutical)
- Food Processing
- Industrial (Environmental Data Logging)
- Cold Storage and Transportation (Logistics)
- Other Applications
- By Geography
- North America
- United States
- Canada
- Mexico
- South America
- Brazil
- Argentina
- Rest of South America
- Europe
- Germany
- United Kingdom
- France
- Italy
- Spain
- Rest of Europe
- Asia-Pacific
- China
- Japan
- India
- South Korea
- ASEAN
- Rest of Asia-Pacific
- Middle East
- Saudi Arabia
- United Arab Emirates
- Rest of Middle East
- Africa
- South Africa
- Nigeria
- Rest of Africa
- North America
Data Sources, Market Sizing, and Validation
Desk Research
For desk research, we first built a fact base around regulated temperature monitoring and cold chain growth, because these are steady demand anchors for temperature data loggers. Public sources such as the US FDA, the CDC, the European Medicines Agency, and the WHO were reviewed to understand compliance expectations and handling practices that drive adoption.
We also referenced datasets such as UN Comtrade for trade direction checks, World Bank indicators for logistics and healthcare context, and peer-reviewed journals for validation of use patterns in life sciences, food safety, and industrial environments. To keep company coverage consistent, we used filings, investor presentations, association websites, and reputable press to map product portfolios and typical pricing bands, supported by paid subscriptions for company financials and intelligence, patents, and import or export shipment-level screening where it helped validate flows. These desk sources are not exhaustive, and we relied on other public and paid references to cross-check numbers and clarify assumptions.
Primary Interviews and Surveys
Primary work included expert interviews and surveys with manufacturers, channel partners, cold chain operators, and quality and compliance users in life sciences, food, and industrial settings. We used these inputs to confirm buying triggers, connectivity preferences, replacement cycles, and practical price ranges across major regions, so the model did not rely on desk assumptions alone.
Distribution of primary research fieldwork respondents
| Company type | Respondent position | Region |
|---|---|---|
| Top tier: 28% | CXOs: 18% | APAC: 45% |
| Mid tier: 54% | Functional/Unit leaders: 33% | EMEA: 35% |
| Smaller Players: 18% | Managers: 49% | Americas: 20% |
Market-Sizing & Forecasting
Sizing starts with a top-down build that reconstructs the demand pool from end-use activity where temperature traceability is enforced or strongly preferred, then applies adoption and replacement behavior discussed by industry participants. To avoid overcounting, the model separates single-use versus reusable purchases and treats offline units differently from connected loggers when estimating average selling price movement.
Selective bottom-up checks were then used to corroborate totals, such as sampled ASP times estimated unit shipments for key applications and channel checks on typical order sizes. Inputs that matter in this market include cold storage capacity additions, life sciences shipment intensity, food processing safety compliance activity, shifts in the connectivity mix (offline, Wi-Fi, cellular or IoT, RFID or NFC), and how often audit-ready records are required for validation. Forecasts were produced using scenario analysis supported by simple trend fits on the strongest drivers, and then adjusted where interview feedback indicated a different adoption curve by region. Where data was thin, we used conservative proxy ranges and scaled them only after checks aligned with visible demand signals.
Data Validation & Update Cycle
Validation is handled through repeated cross-checks so the final number stays consistent with what the market can realistically absorb. We compare outputs against independent signals like trade direction, application growth indicators, and pricing bands observed in public catalogs and interviews, then investigate any large variances before sign-off.
A second analyst review re-checks formulas, unit assumptions, and currency conversions, followed by a targeted re-contact step when a change in compliance practices, connectivity adoption, or end-user spending creates a visible mismatch. Reports are refreshed annually, and we also push interim updates when material events occur, such as a regulation shift or a demand shock. Before delivery, an analyst performs a fresh pass so clients receive the latest updated view.
Mordor Intelligence's Temperature Data Logger Market Size Measured Against Other Published Estimates
Published market sizes for temperature data loggers often do not line up, and this usually comes from small differences in what is counted and when it is counted. In practice, scope boundaries, pricing logic, and the year used as the starting point can each move the final value even if the growth story is similar.
The benchmark table shows a clear spread that is mainly driven by whether studies blend temperature data loggers with adjacent monitoring devices, plus how single-use units and connectivity-enabled products are priced over time, and in the Mordor Intelligence model the value is limited to dedicated temperature data loggers across utility, type, connectivity, and application, rather than including broader data logger categories.
Benchmark comparison
| Source | Market Size | Gaps in Research Methodology |
|---|---|---|
| Mordor Intelligence | USD 1.43 B (2026) | |
| Regional Consultancy A | USD 1.10 B (2024) | Uses an earlier base year and appears to apply broad growth assumptions with limited visibility on connectivity mix and reusable versus single-use replacement cycles, which can shift the implied 2026 level when carried forward. |
| Industry Publisher B | USD 1.20 B (2024) | Describes a broad market label without consistently separating temperature-only loggers from multi-parameter logging devices, which can expand the counted demand pool and change the implied ASP range. |
Taken together, the comparison suggests the biggest swings come from scope mixing and base-year alignment, not from a single dramatic growth assumption. When totals are tied back to practical demand indicators and then checked against pricing reality, the final market value stays easier to replicate and update year after year.
Key Questions Answered in the Report
How large is the temperature data logger market in 2026?
The temperature data logger market size reached USD 1.43 billion in 2026 and is forecast to climb steadily through 2031.
Which segment is growing fastest within temperature data logging?
Cellular and IoT-connected loggers post the highest growth, advancing at a 7.06% CAGR driven by real-time visibility needs.
Why are single-use loggers still in demand?
Pharmaceutical sponsors prefer factory-calibrated, tamper-evident single-use devices for clinical-trial shipments, keeping disposable volumes high despite reusable gains.
What regional market shows the strongest growth outlook?
Asia-Pacific leads with a projected 5.67% CAGR as China and India tighten digital cold-chain mandates and expand refrigerated infrastructure.
How are vendors addressing battery cost inflation?
Suppliers mitigate lithium price spikes by adopting ultra-low-power sensors that stretch battery life to seven years and by piloting sodium-ion alternatives for ambient monitoring.
What is driving the shift toward subscription pricing?
IoT-enabled asset-visibility platforms bundle low-cost hardware with analytics services, turning one-time device sales into recurring per-shipment fees.