
Teleradiology Software Market Size and Share
Market Overview
| Study Period | 2020 - 2031 |
|---|---|
| Market Size (2026) | USD 3.02 Billion |
| Market Size (2031) | USD 5.25 Billion |
| Growth Rate (2026 - 2031) | 11.73 % |
| Fastest Growing Market | Asia Pacific |
| Largest Market | North America |
| Market Concentration | Medium |
Major Players *Disclaimer: Major Players sorted in no particular order Image © Mordor Intelligence. Reuse requires attribution under CC BY 4.0. | |
Teleradiology Software Market Analysis by Mordor Intelligence
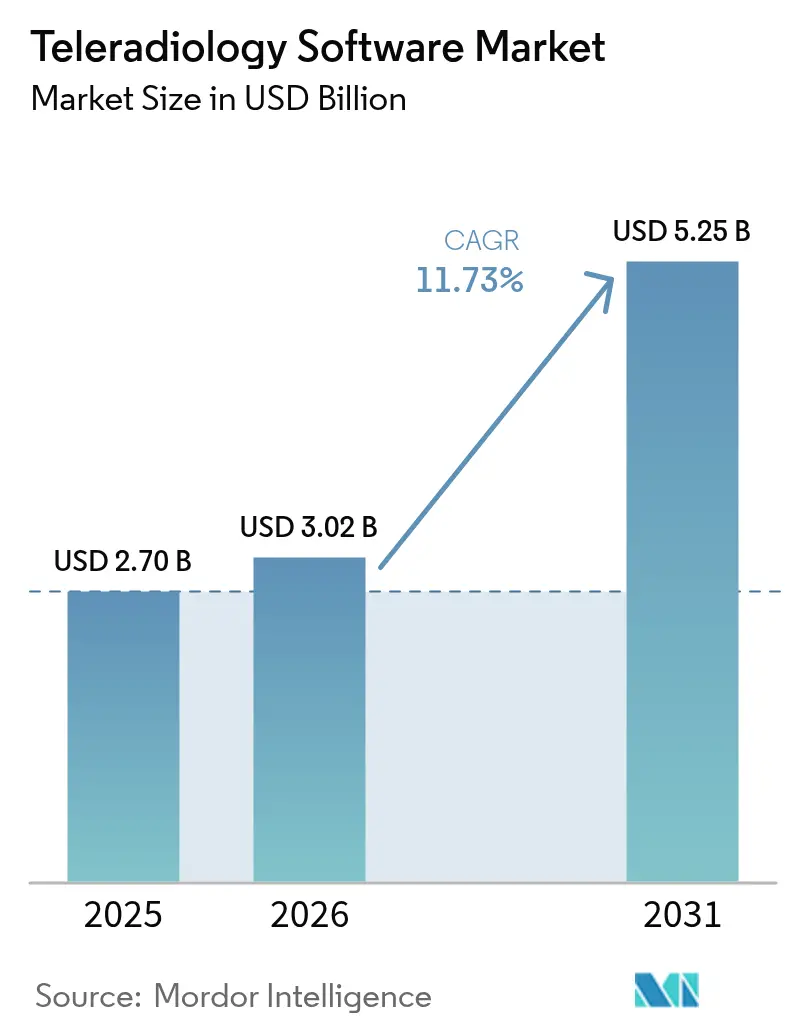
The Teleradiology Software market size is expected to grow from USD 2.70 billion in 2025 to USD 3.02 billion in 2026 and is forecast to reach USD 5.25 billion by 2031 at 11.73% CAGR over 2026-2031. The teleradiology software market size trajectory rests on three mutually reinforcing forces: a widening global radiologist shortfall, imaging volumes that climb 3-4% a year, and cloud architectures that allow instant scale. Hospitals deploy the platforms to secure 24/7 subspecialist coverage, while diagnostic centers harness them to extend hours without hiring on-site radiologists. Technology vendors are embedding AI triage and structured-report modules, which boost reading productivity by up to 30% and help mitigate burnout. Regulations now formally recognize remote preliminary reads, and growing reimbursement parity is steering budgets toward digital infrastructure. Together, these dynamics sustain double-digit growth while intensifying competition around cloud-native, AI-ready ecosystems.
Key Report Takeaways
- By solution type, Picture Archiving and Communication Systems (PACS) led with 44.78% revenue share in 2025, whereas Vendor-Neutral Archive (VNA) is projected to advance at a 12.83% CAGR through 2031.
- By deployment mode, cloud-based platforms accounted for 61.83% of the teleradiology software market share in 2025 and are slated to grow at 12.55% CAGR to 2031.
- By imaging modality, Computed Tomography (CT) captured 30.74% of the teleradiology software market size in 2025; Magnetic Resonance Imaging (MRI) shows the fastest 12.71% CAGR to 2031.
- By end user, hospitals retained 60.52% share in 2025, while diagnostic imaging centers exhibit the quickest 12.42% CAGR up to 2031.
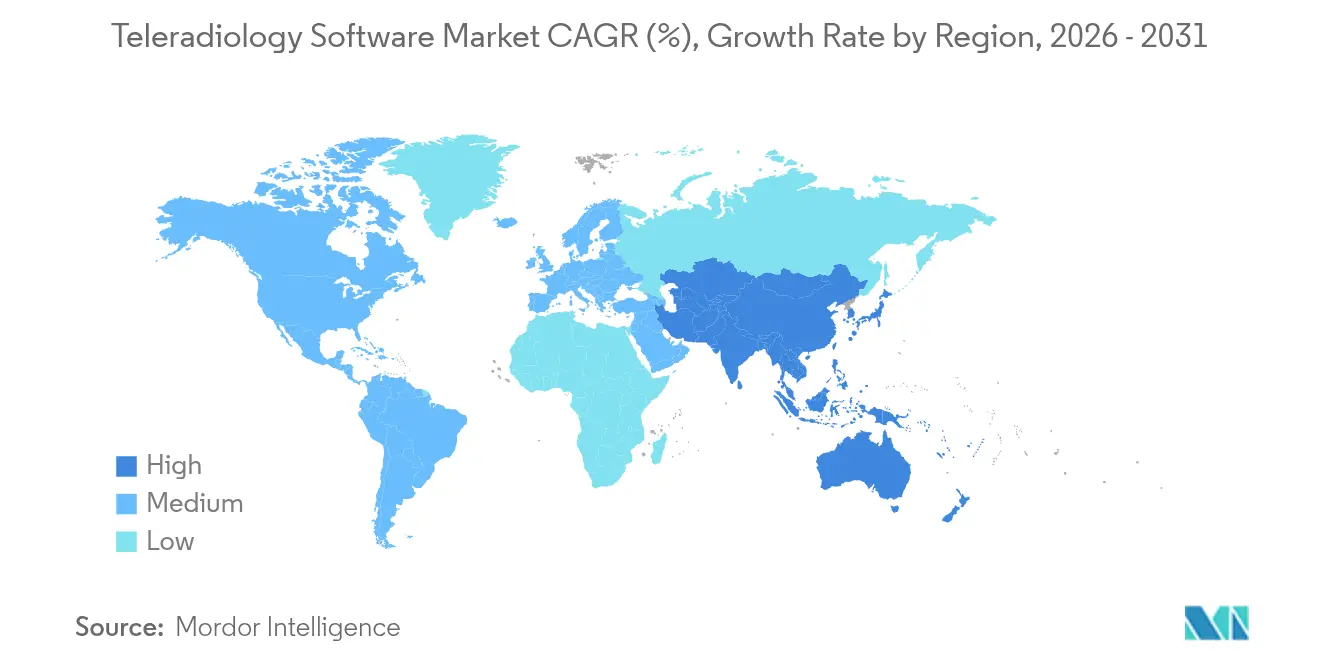
- By geography, North America commanded 39.27% share in 2025, yet Asia-Pacific is on course for a 13.18% CAGR over the forecast horizon.
Note: Market size and forecast figures in this report are generated using Mordor Intelligence’s proprietary estimation framework, updated with the latest available data and insights as of 2026.
Market Trends and Insights
Drivers Impact Analysis of Teleradiology Software Market*
| Driver | (~) % Impact on CAGR Forecast | Geographic Relevance | Impact Timeline |
|---|---|---|---|
| Growing Chronic Disease Burden and Imaging Volume | +2.8% | Global, with concentration in aging populations of North America, Europe, and Japan | Long term (≥ 4 years) |
| Global Radiologist Shortage and Outsourcing Surge | +3.2% | Global, most acute in rural areas of US, UK, and emerging markets | Medium term (2-4 years) |
| Rapid Adoption of Cloud PACS / VNA Architectures | +2.1% | North America & EU leading, APAC following rapidly | Medium term (2-4 years) |
| Rise of Telehealth and Remote Care Trends | +1.9% | Global, accelerated in post-COVID healthcare systems | Short term (≤ 2 years) |
| Stronger Regulatory and Infrastructure Support | +1.6% | North America & EU primarily, expanding to APAC | Medium term (2-4 years) |
| Hardware and Edge AI Integration at Point-of-Care | +1.4% | North America & EU leading, selective adoption in APAC | Long term (≥ 4 years) |
| Source: Mordor Intelligence | |||
Growing Chronic Disease Burden and Imaging Volume
Medical imaging demand is set to climb another 27% by 2055, amplifying pressure on limited radiology resources.[1] CT studies alone could rise 25.1%, while nuclear medicine and X-ray work keep pace. With 4.2 billion examinations already performed each year, health systems depend on teleradiology to flex reading capacity, distribute subspecialist expertise, and keep turnaround times within quality benchmarks. The ability to route overflow studies across national or even continental networks preserves continuity of care and mitigates appointment backlogs.
Global Radiologist Shortage and Outsourcing Surge
The United States may face a deficit of up to 124,000 physicians by 2034, and radiology posts are among the hardest to fill. The United Kingdom reports a 30% radiologist gap, while attrition sits near 13% annually. Productivity metrics show teleradiology groups processing as many as one-third more studies per reader than conventional onsite teams. As rural and community hospitals struggle to staff night and weekend shifts, outsourcing becomes a structural solution, solidifying demand for software that coordinates multi-site workflows and credentialing.
Rapid Adoption of Cloud PACS / VNA Architectures
Hospitals migrating imaging archives to the cloud cut operational expenses by up to 30% and sidestep recurrent hardware-refresh cycles. VNA rollouts further ease vendor lock-in and enable seamless AI integration, evidenced by the Children’s Hospital of Philadelphia saving USD 3 million across five years after its VNA move. These economics underpin the sustained cloud preference throughout the teleradiology software market.
Rise of Telehealth and Remote-Care Trends
Virtual consultations have jumped from 1% to 17% of all visits post-2020, normalizing remote service delivery. National funding schemes, such as the EU Recovery and Resilience Facility that allocates 20% of health budgets for digital initiatives, embed imaging interoperability into wider telehealth ecosystems, reinforcing cross-border reading workflows.
Restraints Impact Analysis of Teleradiology Software Market*
| Restraint | (~) % Impact on CAGR Forecast | Geographic Relevance | Impact Timeline |
|---|---|---|---|
| Stringent Data-Privacy Compliance (HIPAA/GDPR) Costs | -1.8% | North America & EU primarily, expanding globally | Long term (≥ 4 years) |
| High Integration and Change-Management Costs for Small Sites | -1.5% | Global, particularly affecting smaller healthcare providers | Medium term (2-4 years) |
| Cloud-Vendor Lock-In Via High Egress Fees | -1.2% | Global, most significant in multi-cloud environments | Medium term (2-4 years) |
| Cross-Border Medico-Legal Liability for AI Preliminary Reads | -1.0% | Global, particularly affecting international teleradiology providers | Medium term (2-4 years) |
| Source: Mordor Intelligence | |||
Stringent Data-Privacy Compliance (HIPAA/GDPR) Costs
Meeting HIPAA encryption rules in the United States and GDPR restrictions in Europe raises deployment expenses, particularly for smaller clinics that lack dedicated security staff. Organizations managing cross-border reads must navigate overlapping consent regulations and incident-reporting duties, often commissioning third-party audits that inflate total cost of ownership. Cybersecurity investments become mandatory as healthcare organizations address increasing cyber threats, with legal implications for clinicians requiring robust incident response plans and encryption protocols.[2]
Cross-Border Medico-Legal Liability for AI Preliminary Reads
When AI flags urgent findings across jurisdictions, questions arise over which clinician, algorithm vendor, or facility holds ultimate responsibility. Analysis of 299 teleradiology malpractice cases shows 35.6% related to patient death and higher median indemnities compared with onsite radiology. The proposed EU AI Liability Directive heightens exposure by treating diagnostic algorithms as high-risk medical devices. Insurers respond by raising premiums, making some providers wary of aggressive AI rollouts.
*Our forecasts treat driver/restraint impacts as directional, not additive. The impact forecasts reflect baseline growth, mix effects, and variable interactions.
Teleradiology Software Market Segment Analysis
By Solution Type:
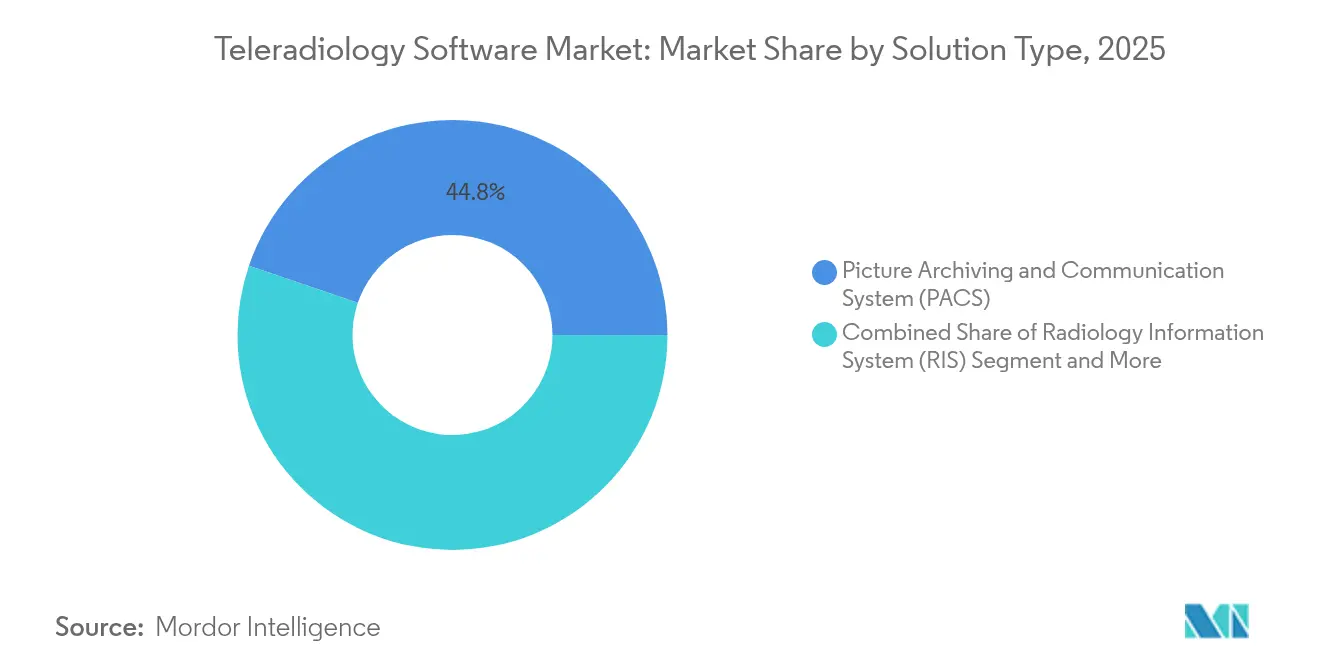
VNA Disrupts Traditional PACS DominancePACS remained the anchor technology with 44.78% share in 2025. At the same time, VNA logged a 12.83% CAGR outlook, signaling a pivot toward vendor neutrality and enterprise imaging consolidation. The teleradiology software market size attached to VNA is set to rise sharply as organizations migrate away from siloed archives. Children’s Hospital of Philadelphia reported USD 3 million savings in five years after its VNA transition.
RIS and nascent enterprise platforms now integrate over 110 certified AI apps through single interfaces, as shown by CARPL.ai’s FDA-cleared hub. Such interoperability compresses report-turnaround times and reduces costly data migrations, giving VNAs tangible economic and clinical advantages.

By Deployment Mode:
Cloud Infrastructure Accelerates Market TransformationCloud installations represented 61.83% of the teleradiology software market in 2025 and are on track for a 12.55% CAGR. Amazon Web Services underpins GE HealthCare’s Genesis portfolio, which promises one-click elasticity and AI scalability.
On-premise systems persist in defense and academic centers with bespoke latency or sovereignty mandates. Yet hybrid setups emerge, allowing sensitive studies to remain local while leveraging cloud analytics for population health. This balanced approach reconciles compliance with innovation and keeps demand for multi-tier deployment orchestration strong within the teleradiology software market.
By Imaging Modality Supported:
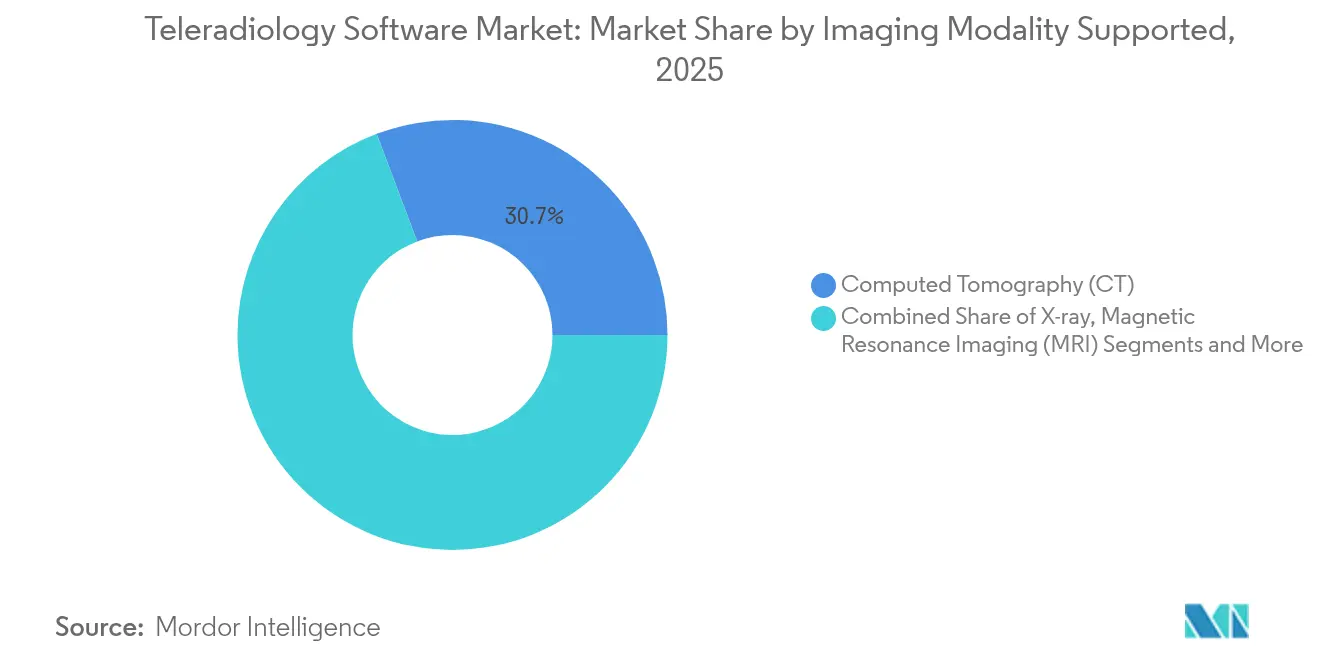
MRI Growth Outpaces Traditional DominanceCT retained 30.74% revenue share in 2025, but MRI posts the fastest 12.71% CAGR through 2031. Increased neurological and musculoskeletal referrals, combined with AI-assisted sequence optimization, elevate MRI throughput and the associated slice count per exam. The teleradiology software market size for MRI workflows grows parallel to these trends.
Ultrasound gains ground via point-of-care probes and autonomous capture pilots co-developed by GE HealthCare and NVIDIA. Mammography incorporates SmartMammo AI to cut recall rates, while PET/SPECT leverages quantitative analytics for oncology staging. Platform vendors therefore configure multimodality viewers and structured reporting templates, cementing ecosystem lock-in.
By End User:
Diagnostic Centers Drive Market ExpansionHospitals controlled 60.52% share in 2025, yet diagnostic imaging centers are sprinting ahead at 12.42% CAGR on the back of outpatient procedure shifts. The teleradiology software market share attached to these centers benefits from evening and weekend coverage strategies that favor outsourced reading.
Consolidation is reshaping the professional landscape: the number of groups with 100+ radiologists has risen 350% over the last decade. Larger entities negotiate enterprise contracts that bundle AI triage, analytics dashboards, and native speech recognition into long-term software-as-a-service deals.
Geography Analysis
North America Teleradiology Software Market
North America led with 39.27% share in 2025, buoyed by reimbursable telehealth policies and FDA clearance of more than 1,000 clinical AI tools, 758 of which target radiology. Rural access initiatives channel grants to small hospitals, further propelling the teleradiology software market. Ongoing mergers, such as ONRAD absorbing Direct Radiology, extend independent coverage networks and promote standardized workflow software.
APAC Teleradiology Software Market
Asia-Pacific registers the quickest 13.18% CAGR, underpinned by India’s Ayushman Bharat Digital Mission that issues unique health IDs ready for image exchange. Indonesia’s launch of PT. Teleradiologi Center Indonesia widens subspecialist access, while Australia’s National Digital Health Strategy funds secure image-sharing grids. Combined, these initiatives lower entry barriers for cloud PACS vendors and local startups.
EMEA and South America Teleradiology Software Market
Europe shows steady adoption, aided by the EUR 4 billion Hospital Future Act that scored German hospitals at just 33.3 on a 100-point digitization index, spotlighting investment gaps. The EU Recovery and Resilience Facility stipulates that a fifth of spending targets digital infrastructure, catalyzing cross-border image-sharing pilots and harmonized medico-legal frameworks. Middle East, Africa, and South America remain nascent, yet public cloud rollouts and urban cancer-center build-outs are laying foundational demand for the teleradiology software market.
Regulatory Landscape
Teleradiology software sits across medical device oversight, privacy law, and cross-border care rules. In the United States, imaging viewing and quantitative analysis capabilities that meet the device definition are regulated as Software as a Medical Device (SaMD), and the FDA has been clarifying how clinical decision support (CDS) interpretations apply to diagnostic outputs (updated final guidance issued in January 2026). Alongside HIPAA-driven security and audit requirements, vendors are being pushed toward clearer documentation of intended use, human-in-the-loop workflows, and post-market monitoring to track performance drift in AI-enabled modules.
In Europe, MDR/IVDR conformity assessment and notified-body capacity remain key gating factors for imaging IT and AI components that fall under medical device rules. In 2026, European Commission implementing measures within the MDR/IVDR framework add transition and transparency obligations, affecting how imaging software is brought to market and monitored over time. The European Health Data Space (EHDS) direction of travel also reinforces interoperability and governed data sharing for secondary use, shaping how platforms design consent, access control, and cross-border image exchange while maintaining GDPR-aligned safeguards.
Competitive Landscape
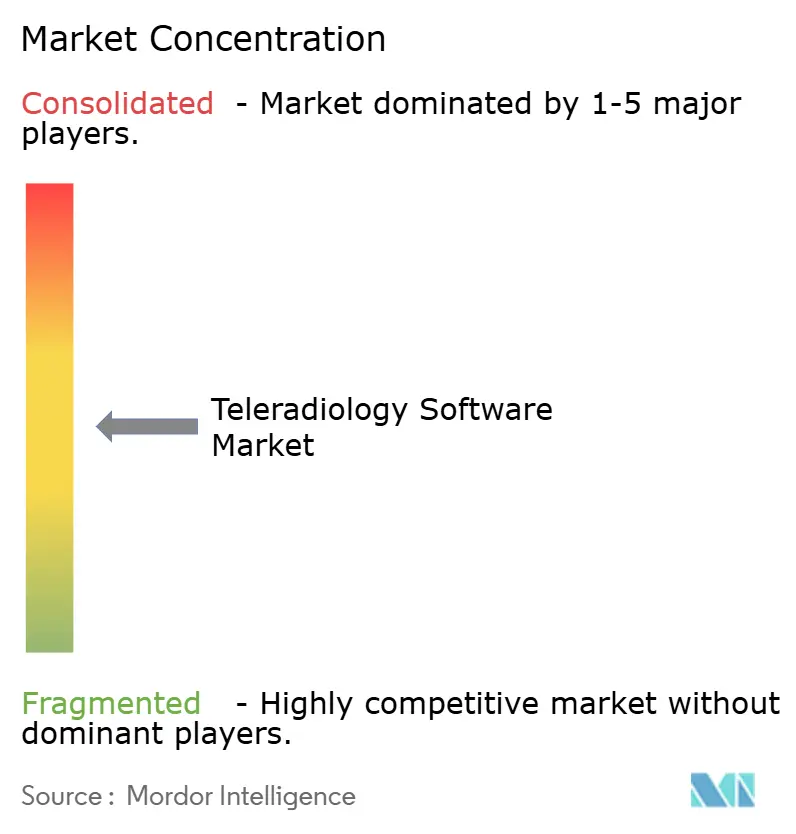
Consolidation is accelerating, though the top five vendors still control a substantial combined revenue, pointing to moderate fragmentation. Private-equity activity funds roll-ups such as Radiology Partners’ multistate acquisitions that create scale to negotiate AI licences.
Competitive moats now revolve around cloud readiness and end-to-end orchestration. GE HealthCare links its Centricity viewer to NVIDIA Clara for de-noising and triage, Siemens Healthineers embeds DeepHealth mammography AI, and Sectra integrates zero-footprint viewers. Pure-play providers like Intelerad differentiate through vendor-neutral ingestion and outcome analytics, partnering with RADPAIR to speed structured reports.
Strategic moves center on AI portfolios, multi-tenant cloud hosting, and reimbursement consultancy. Konica Minolta pairs its Exa platform with NewVue’s curation engine, while ZettaHealth debuts the first ERP tuned to radiology group billing. These offerings bundle revenue-cycle modules and credentialing management, locking customers into broader ecosystems and augmenting the teleradiology software market growth curve.
Teleradiology Software Industry Leaders
-
Carestream Health
-
Telerad Tech
-
GE HealthCare
-
Koninklijke Philips N.V.
-
Siemens Healthineers AG
- *Disclaimer: Major Players sorted in no particular order
Teleradiology Software Market Companies Covered in this Report
- GE Healthcare
- Koninklijke Philips
- Siemens Healthineers
- Sectra
- Change Healthcare
- Carestream Health
- Agfa-Gevaert
- FUJIFILM
- Visage Imaging
- Telerad Tech
- Comarch
- Medsynaptic
- Perfect Imaging
- Imagebytes Pvt Ltd
- Morton & Partners Radiologists
- Radical Imaging
- ONRAD Inc.
- Everrtech
- TeleSpecialists LLC
- Virtual Radiologic (vRad)
Market Opportunities and Future Outlook
Interoperability and quality standardization are creating whitespace for vendors that can package teleradiology workflows as enterprise imaging infrastructure rather than standalone point solutions. In the United States, the ASTP/ONC 2024-2030 Federal Health IT Strategic Plan and related Cures Act interoperability efforts lift expectations for standardized exchange, APIs, and longitudinal access to clinical data. That direction increases demand for PACS/VNA modernization, zero-footprint viewers, and integration tooling that reduces the burden of multi-site deployments.
Europe adds a further procurement reference point with the publication of EN 18167:2026, which covers quality-system requirements for remote radiology practices across the patient pathway. This supports buying discussions focused on consistent service levels, auditability, and governance in distributed reading models. Meanwhile, industry consolidation and platform expansion highlight where buyers are placing spend, including I-MED Radiology acquiring StatRad in July 2024 to enter the United States market through a cloud-based platform and an established radiologist network. Together, these developments point to practical opportunities for cloud-native offerings that combine workflow orchestration, secure exchange, and embedded AI assistance, with compliance and service quality documented across sites and jurisdictions.
Recent Industry Developments in Teleradiology Software Market
- March 2026: GE HealthCare completed its acquisition of Intelerad, expanding its imaging software footprint across enterprise imaging and remote reading workflows. The deal strengthens GE HealthCare's ability to offer a more integrated cloud-first stack spanning hospitals, ambulatory sites, and teleradiology operations, increasing competitive pressure on standalone PACS and workflow vendors.
- March 2026: GE HealthCare received U.S. FDA 510(k) clearance for View, a zero-footprint diagnostic viewer within the Genesis Radiology Workspace designed for remote access. Regulatory-cleared, browser-based viewing supports anywhere reading models and reduces reliance on specialized workstations, which aligns with cloud deployment priorities across multi-site radiology groups.
- November 2025: GE HealthCare announced it would acquire Intelerad to advance cloud-enabled enterprise imaging across care settings. The announcement signaled acceleration in consolidation around imaging IT platforms that can connect hospital departments with outpatient networks and teleradiology providers under unified workflows and governance.
Teleradiology Software Market Report Scope and Research Methodology
Market Definition and Coverage
This market covers software platforms and modules that enable remote sharing, viewing, workflow routing, and reporting of medical imaging studies between imaging sites and radiologists, along with related implementation and support sold with the software.
Scope exclusions: It excludes pure teleradiology reading services, imaging equipment hardware, and general-purpose telehealth platforms that do not perform radiology image workflow and reporting.
Segments Covered in This Report
- By Solution Type
- Radiology Information System (RIS)
- Picture Archiving & Communication System (PACS)
- Vendor-Neutral Archive (VNA)
- Other Solution Types
- By Deployment Mode
- Cloud-Based
- On-Premise
- By Imaging Modality Supported
- X-ray
- Computed Tomography (CT)
- Magnetic Resonance Imaging (MRI)
- Ultrasound
- Nuclear Imaging (PET/SPECT)
- Mammography
- By End User
- Hospitals
- Diagnostic Imaging Centers
- Other End Users
- By Geography
- North America
- United States
- Canada
- Mexico
- Europe
- Germany
- United Kingdom
- France
- Italy
- Spain
- Rest of Europe
- Asia-Pacific
- China
- Japan
- India
- Australia
- South Korea
- Rest of Asia-Pacific
- Middle East and Africa
- GCC
- South Africa
- Rest of Middle East and Africa
- South America
- Brazil
- Argentina
- Rest of South America
- North America
Data Sources, Market Sizing, and Validation
Desk Research
Desk research is used to build the starting view of demand signals, policy direction, and installation trends for remote radiology workflows. We mainly reviewed public sources such as the US FDA device databases (where relevant to imaging IT), CMS and other public payer rule updates, and national health statistics releases such as CDC data that indicate diagnostic burden and care utilization.
To keep sizing inputs grounded, we also referred to sources such as peer-reviewed radiology informatics journals, the American College of Radiology guidance pages, and public procurement notices that show multi-year imaging IT modernization activity. Company annual reports, investor presentations, and credible press coverage were used to understand pricing models, deployment mix, and go-to-market shifts. Select paid databases were used for company financials and patent lookups to cross-check commercialization timelines. These sources are illustrative only, and many other public documents were also consulted to complete, verify, and clarify the data used in the model.
Primary Interviews and Surveys
Primary work focused on interviews and structured surveys with software providers, hospital and imaging-center IT leaders, and radiology workflow users who manage day-to-day reporting queues. For this global topic, inputs were balanced across Americas, EMEA, and APAC so that deployment constraints, procurement cycles, and cloud adoption patterns could be checked before finalizing assumptions.
Distribution of primary research fieldwork respondents
| Company type | Respondent position | Region |
|---|---|---|
| Top tier: 28% | CXOs: 12% | APAC: 46% |
| Mid tier: 54% | Functional/Unit leaders: 30% | EMEA: 29% |
| Smaller Players: 18% | Managers: 58% | Americas: 25% |
Market-Sizing & Forecasting
Sizing starts with a top-down build that reconstructs the demand pool from imaging activity and the share of studies that move through remote reading and digital exchange workflows, which is then translated into software spending using typical contract structures. The totals are tested using selective bottom-up approximations like sampled vendor revenue disclosure ranges, channel partner checks, and sampled average annual contract values multiplied by estimated active site counts.
Key inputs used in the model include imaging procedure volumes by modality (CT, MRI, X-ray), radiologist availability indicators that influence outsourcing and after-hours coverage, cloud versus on-premise deployment mix, integration intensity with PACS and RIS environments, and observed pricing patterns by facility size and user counts. When a direct data point is missing for a country, we filled gaps using proxy indicators such as hospital bed counts, diagnostic center density, and digital health infrastructure readiness, then rechecked outputs with regional experts. Forecasting uses scenario analysis supported by a simple multivariate regression layer, where growth is linked to imaging growth, staffing pressure, and cloud migration pace that respondents expect over the next few years.
Data Validation & Update Cycle
Outputs are checked through multiple passes so that sudden jumps in penetration, pricing, or regional shares are flagged and explained before sign-off. We compare the model results with independent signals like imaging utilization trends, hospital IT spending direction, and contract activity patterns, then resolve variances through follow-up calls when the spread is meaningful.
Before publication, the workbook is reviewed by another analyst to confirm that units, currency conversion timing, and growth links are consistent across countries and regions. Reports are refreshed annually, and interim updates are made when major regulatory changes, reimbursement shifts, or large contract announcements can move near-term demand. Right before delivery, a final review pass is completed so clients receive the latest updated view.
Mordor Intelligence's Teleradiology Software Market Size Versus Other Published Estimates
Published market values for teleradiology software can differ even when the topic name looks the same, because the included revenue streams and the year basis are not always aligned. Differences also come from how firms convert currencies, treat multi-year contracts, and decide whether to count adjacent IT modules that sit next to PACS and RIS.
A common gap driver in this market is whether the number includes only software revenue or also folds in teleradiology reading services and broader imaging IT services bundled inside contracts. Another driver is how cloud subscriptions are recognized across years, since annual recurring revenue can be counted differently from one-time licenses, and how fast price assumptions change as cloud adoption rises in hospitals and imaging centers.
Benchmark comparison
| Source | Market Size | Gaps in Research Methodology |
|---|---|---|
| Mordor Intelligence | USD 3.02 B (2026) | |
| Global Consultancy A | USD 2.18 B (2024) | Uses an earlier base year and can understate the run-rate when newer cloud subscription ramps and post-pandemic backlog normalization are not fully reflected, which compresses the nearer-term total versus a later-year build. |
| Industry Publisher B | USD 2.16 B (2024) | Often differs on revenue recognition for multi-year software contracts and whether implementation and support sold with the platform are counted, which can shift totals up or down depending on the assumed attach rates. |
The spread across the three figures is mainly explained by year alignment and by what gets counted as software value versus adjacent services, and those choices change the addressable revenue pool quickly in this category. By keeping the build anchored to imaging workflow software and tying penetration and pricing to modality volumes and deployment mix, the 2026 estimate stays traceable to repeatable steps, which is the approach applied by Mordor Intelligence.
Key Questions Answered in the Report
What is the current value of the teleradiology software market?
The market is valued at USD 3.02 billion in 2026 and is forecast to hit USD 5.25 billion by 2031.
Which deployment model is growing fastest?
Cloud-based platforms, already holding 61.83% share in 2025, are expanding at 12.55% CAGR thanks to scalability and lower maintenance costs.
Why are diagnostic imaging centers adopting teleradiology faster than hospitals?
Outpatient migration and the need for subspecialist coverage without on-site hires drive a 12.42% CAGR among diagnostic centers.
Which imaging modality will contribute most to future growth?
MRI is projected to grow at 12.71% CAGR, outpacing CT even though CT remains the largest revenue contributor.
What regions present the strongest expansion opportunities?
Asia-Pacific is on track for a 13.18% CAGR due to national digitization programs and investments in imaging infrastructure.
How is AI influencing competitive dynamics?
FDA clearance of 1,000+ clinical AI applications, most in radiology, favors vendors that can embed triage and structured-report tools within cloud-native workflows, creating new competitive advantages.