
Telecom Managed Services Market Size and Share
Market Overview
| Study Period | 2022 - 2031 |
|---|---|
| Market Size (2026) | USD 31.93 Billion |
| Market Size (2031) | USD 53.83 Billion |
| Growth Rate (2026 - 2031) | 11.02% CAGR |
| Fastest Growing Market | Asia Pacific |
| Largest Market | North America |
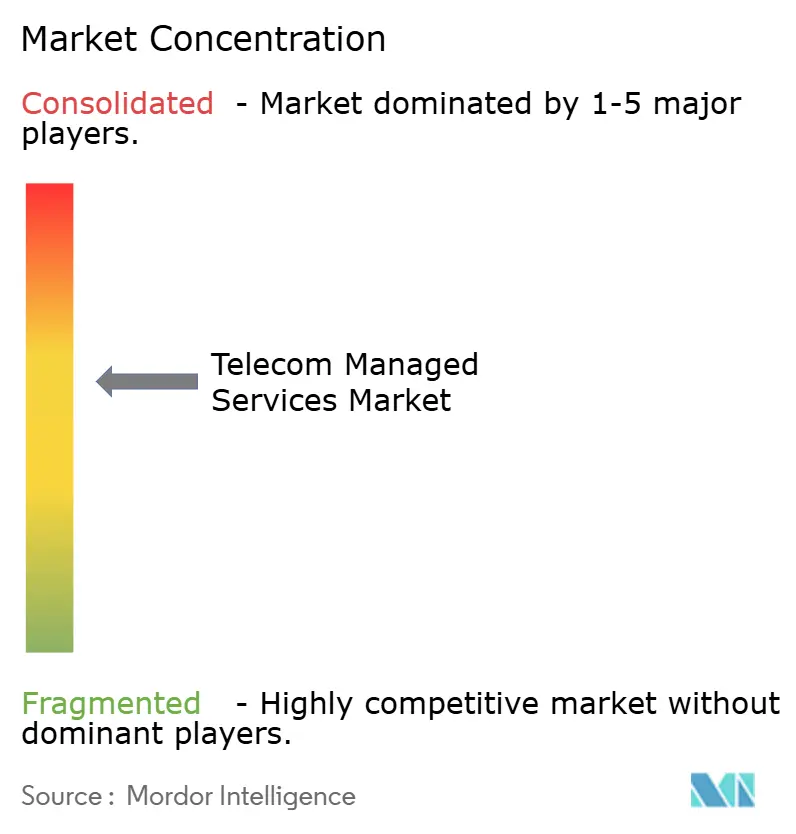
| Market Concentration | Medium |
Major Players *Disclaimer: Major Players sorted in no particular order Image © Mordor Intelligence. Reuse requires attribution under CC BY 4.0. | |
Telecom Managed Services Market Analysis by Mordor Intelligence
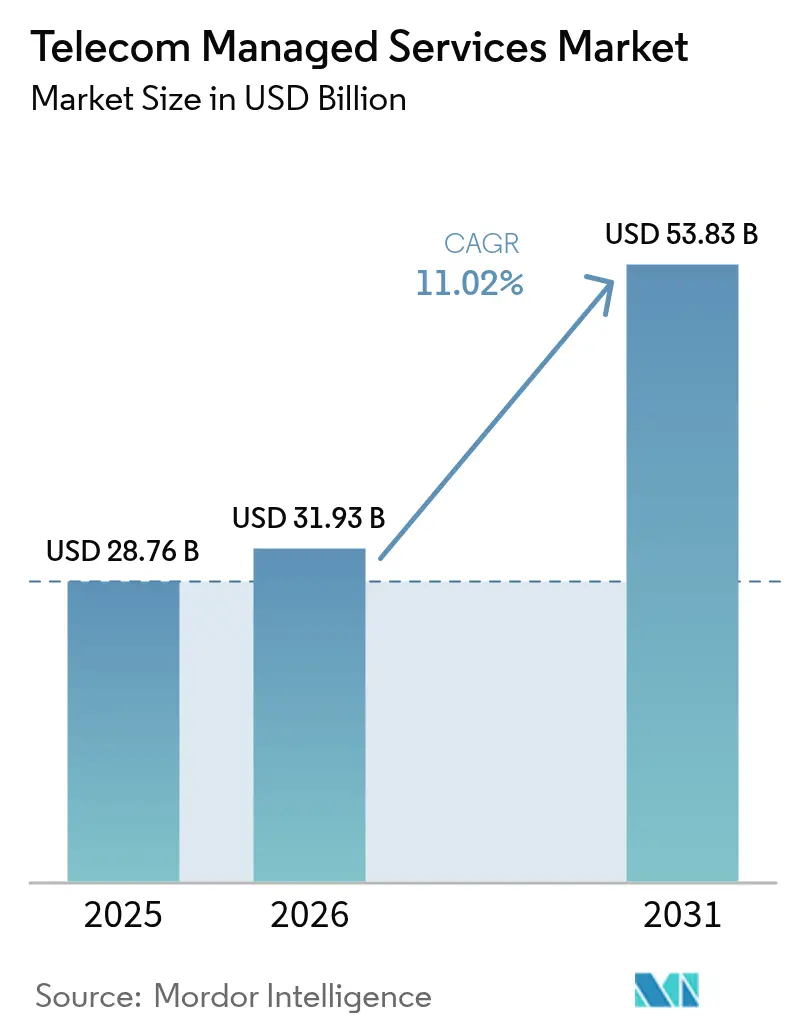
The telecom managed services market size was valued at USD 28.76 billion in 2025 and estimated to grow from USD 31.93 billion in 2026 to reach USD 53.83 billion by 2031, at a CAGR of 11.02% during the forecast period (2026-2031). This translates into a 70% expansion over the forecast period, reflecting operators’ pivot from capital-intensive in-house activities to outcome-based partnerships that streamline operating costs and accelerate 5G roll-outs. Demand is strongest for cloud-hosted operations support systems because they shorten service-launch cycles and enable network automation at scale. Enterprises are adopting managed network slicing to secure predictable latency and bandwidth, while mobile operators rely on predictive maintenance to curb unplanned outages and protect revenues. Competitive bidding now revolves around AI-driven analytics, zero-trust security frameworks and multicloud orchestration skills, creating headroom for specialized providers that can guarantee performance-based SLAs.
Key Report Takeaways
- By organization size, large enterprises led with 55.72% of telecom managed services market share in 2025, while SMEs are set to grow at 11.15% CAGR through 2031.
- By service type, managed network services held 32.08% revenue share in 2025; managed security is forecast to expand at a 11.78% CAGR to 2031.
- By deployment model, cloud-hosted platforms accounted for 62.15% of the telecom managed services market size in 2025 and are advancing at a 12.74% CAGR through 2031.
- By telecom operator, mobile network operators commanded 50.86% share of the telecom managed services market size in 2025, but internet service providers record the highest projected CAGR at 12.02% to 2031.
- By end-user vertical, the consumer segment captured 46.21% revenue share in 2025; enterprise demand is climbing at 11.91% CAGR on the back of Industry 4.0 projects.
- By geography, North America held 30.88% revenue share in 2025, whereas Asia Pacific is the fastest-growing region at an 11.53% CAGR through 2031.
Note: Market size and forecast figures in this report are generated using Mordor Intelligence’s proprietary estimation framework, updated with the latest available data and insights as of 2026.
Global Telecom Managed Services Market Trends and Insights
Drivers Impact Analysis*
| Driver | (~) % Impact on CAGR Forecast | Geographic Relevance | Impact Timeline |
|---|---|---|---|
| 5G roll-out accelerating enterprise demand for managed network slicing | +2.1% | Global, with early gains in North America, Europe, Asia Pacific | Medium term (2-4 years) |
| Cloud-native OSS/BSS adoption among Tier-1 operators | +1.8% | Global, concentrated in developed markets | Long term (≥ 4 years) |
| Shift to outcome-based SLAs lowering churn for MSPs | +1.4% | North America and EU, expanding to Asia-Pacific | Medium term (2-4 years) |
| AI-driven predictive maintenance cutting OPEX | +1.6% | Global, with advanced deployment in Asia-Pacific core | Short term (≤ 2 years) |
| Demand for zero-trust architectures pushing managed security | +1.9% | Global, regulatory-driven in EU and North America | Short term (≤ 2 years) |
| Private 5G campus networks for Industry 4.0 | +1.3% | Asia-Pacific core, spill-over to North America and EU | Medium term (2-4 years) |
| Source: Mordor Intelligence | |||
5G Network Slicing Drives Enterprise Transformation
Enterprise adoption of 5G network slicing is reshaping the telecom managed services market as organizations require isolated virtual networks with guaranteed performance for mission-critical applications. Verizon’s collaboration with FIFA for the 2026 World Cup highlights how event operators rely on private slices to deliver low-latency video streams and interactive fan experiences. Manufacturing leaders such as Tesla use private 5G to orchestrate autonomous production lines, pushing specialized managed service contracts that traditional IT teams cannot support. Singtel’s Southeast Asian smart-factory deployments demonstrate monetization potential by offering premium slices that lock in stringent latency and reliability targets.[1]Singtel, “Singtel powers smart manufacturing with 5G slicing,” singtel.com The complexity of simultaneously operating multiple slices each with distinct QoS parameters makes external expertise indispensable, stimulating multi-year outsourcing deals across automotive, healthcare and entertainment verticals.
Cloud-Native OSS/BSS Adoption Accelerates Operational Efficiency
Operators are migrating from monolithic systems to cloud-native architectures, generating sustained demand in the telecom managed services market. Ericsson’s cloud-native suite helped T-Mobile cut network operations costs by 30% and compress service-launch cycles from weeks to hours. Nokia’s USD 2.3 billion purchase of Infinera in 2024 indicates that integrated hardware-software portfolios are critical for seamless migration to containerized environments. Managed service providers (MSPs) supply Kubernetes engineering, CI/CD pipelines and microservices orchestration skills that remain scarce in-house. As operators decommission legacy platforms, cloud-hosted models unlock elastic scaling, enabling rapid introduction of edge computing services for industrial IoT.
AI-Driven Predictive Maintenance Transforms Network Operations
Artificial intelligence has moved network management from reactive fault handling to predictive prevention. Huawei reports 40% fewer outages among operators deploying its AI-based management suite, which analyzes multiband radio data to flag performance anomalies days in advance.[2]Huawei Technologies, “AI-enabled autonomous driving network,” huawei.com NTT Docomo’s self-optimizing network adjusts parameters on the fly, reducing manual interventions by 60% while boosting user-experience scores. Generative AI now synthesizes root-cause analyses and recommends remediation steps in real time, enabling MSPs to commit to tighter SLA thresholds and differentiate on guaranteed uptime.
Zero-Trust Security Architectures Drive Managed Security Demand
The shift toward virtualized network functions expands the attack surface, prompting operators to adopt zero-trust frameworks that authenticate every device, user and application. Palo Alto Networks found that 78% of operators intend to deploy zero-trust by 2026, yet only 23% possess sufficient internal talent.[3]Palo Alto Networks, “Zero Trust adoption in telecom 2025 survey,” paloaltonetworks.com Dish Network’s cloud-native 5G core on AWS required an end-to-end zero-trust overlay delivered by external security specialists. EU directives such as the Digital Operational Resilience Act intensify compliance pressures, steering operators toward managed security providers that combine threat intelligence, policy automation and multicloud visibility.
Restraints Impact Analysis*
| Restraint | (~) % Impact on CAGR Forecast | Geographic Relevance | Impact Timeline |
|---|---|---|---|
| Skill-gap inflation in telecom DevSecOps talent | -1.2% | Global, acute in North America and Europe | Short term (≤ 2 years) |
| Vendor lock-in fears for cloud-hosted network functions | -0.8% | Global, regulatory concerns in EU | Medium term (2-4 years) |
| Latency-sensitive 5G URLLC use-cases limiting off-prem outsourcing | -0.6% | Asia-Pacific and North America, industrial applications | Long term (≥ 4 years) |
| Fragmented regulatory compliance across regions | -0.9% | Global, varying by jurisdiction | Medium term (2-4 years) |
| Source: Mordor Intelligence | |||
DevSecOps Talent Shortage Constrains Service Delivery
Telecommunications DevSecOps vacancies remain open for 4.2 months on average versus 2.8 months for general IT roles, pushing wage inflation to 18% annually. The scarcity is most acute in 5G cloud-native environments, where engineers must combine radio expertise with container security. MSPs are responding with global training hubs and graduate academies, but onboarding cycles lengthen project timelines and limit the speed at which providers can scale service portfolios.
Vendor Lock-in Concerns Slow Cloud Migration
High-profile dependence on hyperscale clouds such as Dish Network’s AWS-centric 5G rollout has raised alarms with regulators seeking to preserve competitive neutrality. The European Commission now requires operators to document multicloud strategies for critical functions. Operators are therefore negotiating exit clauses and federation architectures before signing managed service contracts, extending procurement cycles and tempering migration momentum.
*Our forecasts treat driver/restraint impacts as directional, not additive. The impact forecasts reflect baseline growth, mix effects, and variable interactions.
Segment Analysis
By Organization Size: SMEs Build Adoption Momentum
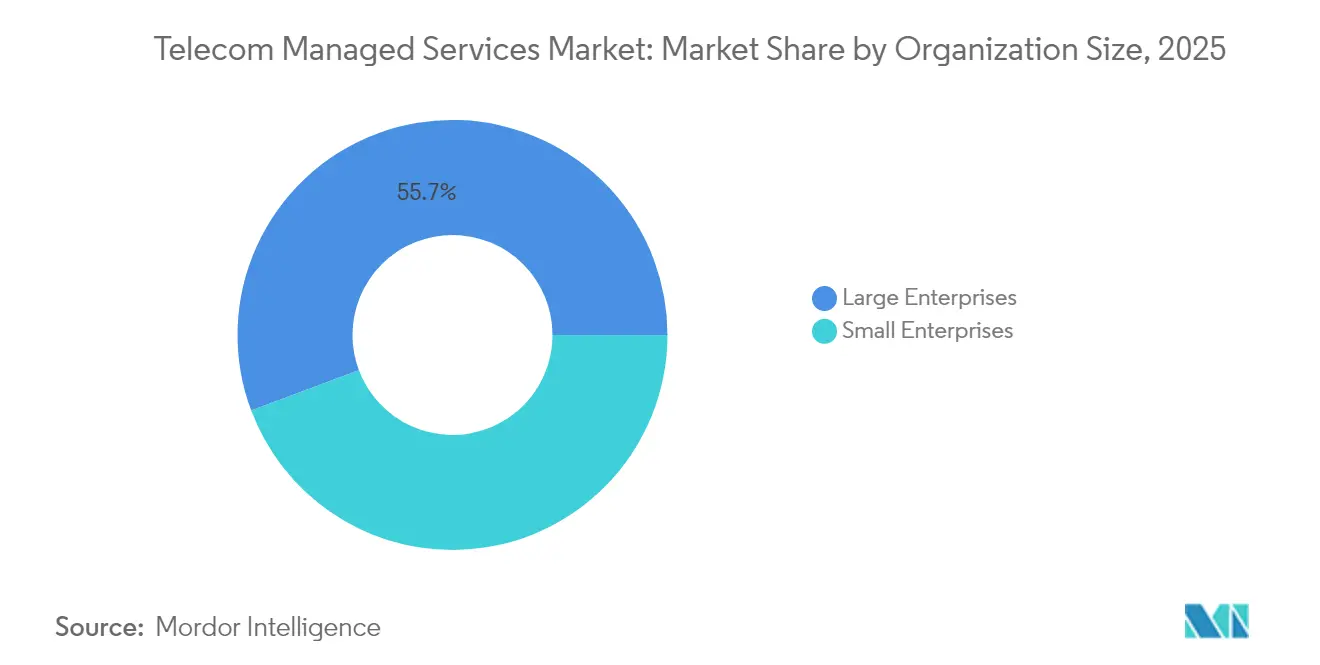
Large enterprises accounted for 55.72% revenue in 2025, underpinning the telecom managed services market with global rollouts that span transport, IT and security domains. Their budgets support tailored solutions encompassing network slicing, private 5G and unified observability dashboards. In contrast, SMEs expand at an 11.15% CAGR to 2031, unlocking fresh volume for service providers. The telecom managed services market size for SMEs is projected to climb steadily as standardized, pay-as-you-grow bundles remove hefty capital barriers. Healthcare clinics, mid-tier manufacturers and regional retailers collectively drive this surge by outsourcing compliance-heavy communication stacks to offset limited in-house expertise.
SMEs gravitate toward cloud-first networking, managed SD-WAN and turnkey security gateways that meet sector regulations without deep technical staffing. Meanwhile, multinationals leverage AI-assisted automation to rationalize sprawling multi-vendor estates, freeing up internal teams for innovation initiatives. The convergence of price-competitive packages for SMEs and highly customized enterprise frameworks ensures that providers must maintain dual go-to-market plays.


By Service Type: Security Services Overtake Network Management
Managed network services retained 32.08% revenue share in 2025, underscoring their status as the core layer of the telecom managed services market. Yet managed security is the fastest riser at a 11.78% CAGR as operators confront nation-state threats and stringent data-residency rules. The telecom managed services market size for managed security is expected to swell notably, propelled by zero-trust rollouts and 5G core protection. Data center, communication and mobility services grow at steady mid-single-digit rates, while analytics-as-a-service emerges as an adjacent revenue stream.
Security demand spans threat hunting, SOC-as-a-service and compliance reporting across on-prem and multicloud estates. Providers differentiate via AI-powered anomaly detection and automated policy enforcement at network edges. Network management, though mature, is undergoing reinvention through intent-based networking and closed-loop assurance, keeping the segment relevant but less dynamic than security.
By Deployment Model: Cloud Dominance Deepens
Cloud-hosted deployments captured 62.15% share in 2025 and continue to expand at 12.74% CAGR, reflecting broad confidence in hyperscale reliability and elasticity. Operators value the ability to spin up network functions on-demand and pay only for utilized capacity, translating into leaner balance sheets. The telecom managed services market share of cloud models is forecast to widen as advanced security certifications and availability zones allay sovereignty fears. On-prem implementations persist for ultra-reliable low-latency communications and sensitive public-sector networks but their relative weight falls over time.
SoftBank’s large-scale core validation in public clouds validates performance parity with proprietary data centers. Hybrid blueprints that anchor user-plane functions at the edge while orchestrating control planes in cloud data centers are proliferating, affording MSPs an avenue to bundle consulting, migration and lifecycle operations.
By Telecom Operator Type: ISPs Challenge Mobile Incumbents
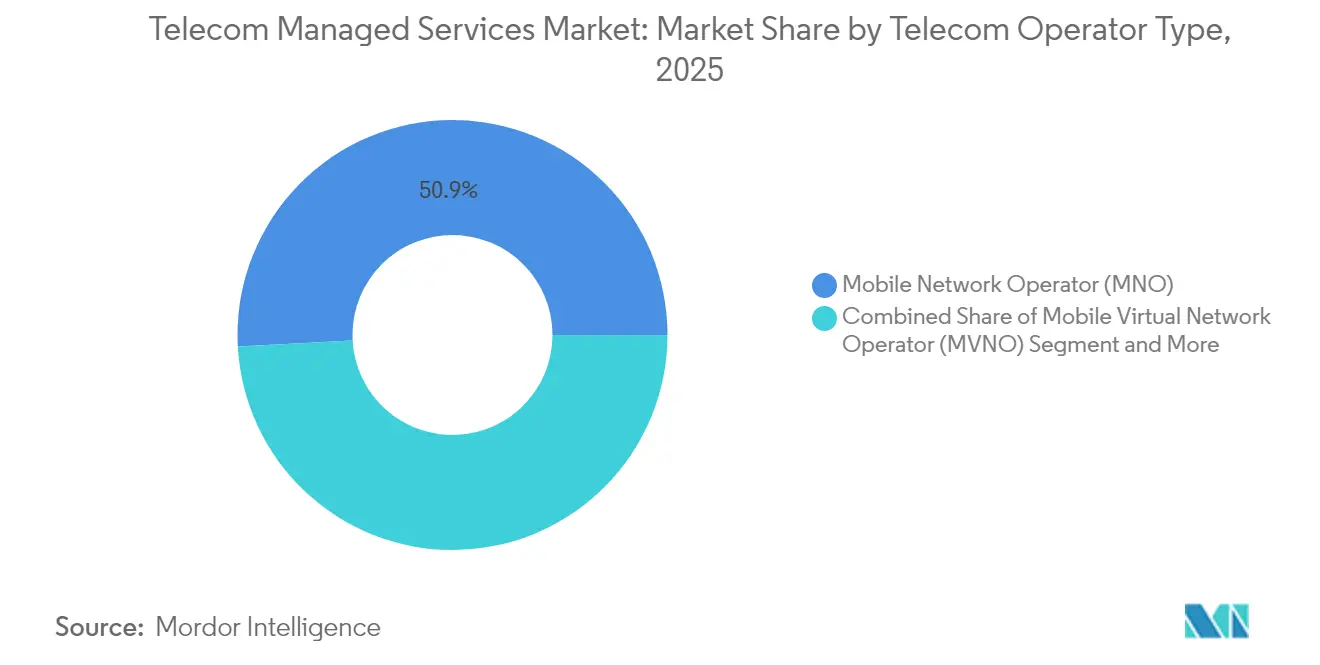
Mobile network operators (MNOs) retained 50.86% market share in 2025 thanks to spectrum ownership and established enterprise relationships. However, internet service providers (ISPs) grow at 12.02% CAGR to 2031 as fiber roll-outs create sizable footprints ripe for managed value-adds. The telecom managed services market size attributed to ISPs is expanding faster than that of MNOs, especially among regional carriers that tailor offerings to local businesses.
ISPs leverage unified fiber backbones to upsell SD-WAN, security and edge compute services, often partnering with MSPs for turnkey delivery. Mobile virtual network operators depend heavily on external expertise to match incumbent service breadth, presenting niche opportunities for white-label managed platforms. Competitive dynamics hinge on cross-selling prowess and the integration depth of cybersecurity, analytics and multicloud connectivity.
By End-User Vertical: Enterprises Accelerate Outsourcing
Consumers held 46.21% share in 2025, anchored by residential broadband and mobile bundles that incorporate basic device management and parental-control features. The enterprise segment, however, advances at 11.91% CAGR as digital-first strategies demand integrated connectivity, security and analytics. Financial institutions outsource network monitoring to assure algorithmic trading latency, while manufacturers deploy private 5G with managed edge compute for robotics.
Government and public-safety agencies adopt carrier-grade push-to-talk and mission-critical video services underpinned by stringent SLAs, supporting steady but smaller absolute growth. Enterprise uptake reinforces the telecom managed services market because cloud-native transformations, compliance mandates and IoT adoption exceed the operational capacity of internal IT staff.
Geography Analysis
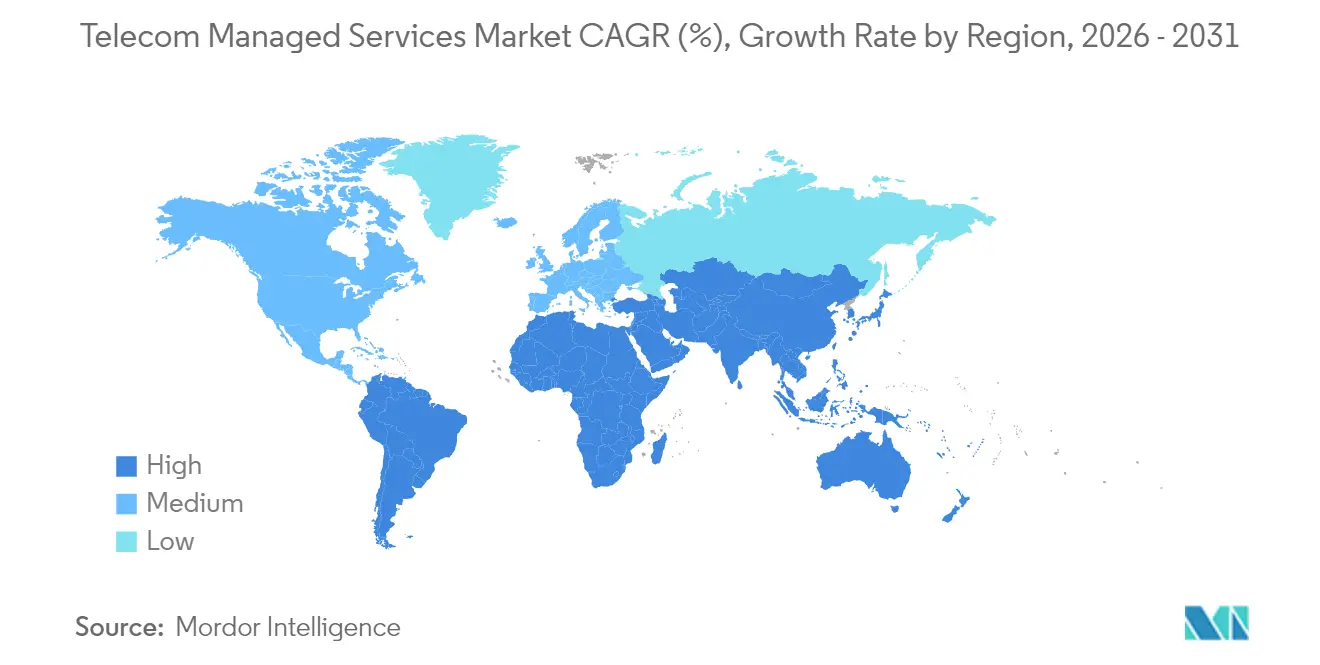
North America led with 30.88% revenue in 2025 owing to early 5G deployment, high enterprise cloud adoption and supportive regulatory frameworks that encourage private-network experimentation. Verizon surpassed 4.2 million fixed-wireless access subscribers ahead of schedule, attesting to strong demand for managed broadband alternatives. AT&T posted 17 consecutive quarters of fiber subscriber gains, underscoring the robust appetite for carrier-operated managed connectivity. Mature competition pushes operators to outsource advanced automation, analytics and security tasks to sharpen differentiation.
Asia Pacific is the fastest-growing region at an 11.53% CAGR through 2031, buoyed by large-scale 5G infrastructure builds and government-backed Industry 4.0 programs. China deployed 3.4 million 5G base stations by 2024, fuelling unprecedented network-management requirements. Japan emphasized private 5G for smart factories, while India’s Reliance Jio established a business unit to commercialize private networks and managed services for midsize manufacturers. South Korea’s first private 5G licence issued to NAVER Cloud shows how hyperscalers are entering enterprise connectivity.
Europe registers steady mid-single-digit growth amid mature penetration levels, yet regulatory frameworks such as the Cyber Resilience Act press operators to outsource compliance-driven security and reporting. Middle East and Africa and South America exhibit rising interest in outsourcing to streamline OpEx and extend coverage into underserved areas. Regional players adopt managed satellite backhaul and energy-efficient RAN services to cope with challenging terrains and energy costs.

Regulatory Landscape
Telecom managed services operate under a patchwork of telecom, cybersecurity, data protection, and critical infrastructure rules that increasingly extend beyond operators to their outsourced service ecosystems. In the European Union, policy work in 2026 around the European Commission's Digital Networks Act (DNA) and a revised Cybersecurity Act (CSA 2.0) reinforces supply-chain security expectations for telecom infrastructure and associated third parties, tightening due diligence and risk management requirements that feed into managed service contract structures, auditability, and vendor selection.
National regulators are also issuing more prescriptive security guidance that pushes operators to tighten oversight of managed service providers. In the United Kingdom, the government published Telecommunications Security Code of Practice version 1.1 in July 2026, emphasizing stronger contractual powers for operators to audit and monitor third-party providers supporting public telecoms networks. The Cyber Security and Resilience (Network and Information Systems) Bill reached Report Stage in April 2026 and proposes a new category of Relevant Managed Service Provider (RMSP). In emerging markets, licensing models can directly apply to managed services, such as Ghana's National Communications Authority draft framework for Electronic Communications Managed Services that includes regulatory fee structures and alignment with ITU cybersecurity best practices. Internationally, ITU recommendations and IMT-2030 (6G) requirements published in 2026 provide standards anchors that influence cross-border interoperability and procurement criteria for managed network operations.
Competitive Landscape
Competition is moderate, with top vendors combining software, hardware and professional services to win multi-year contracts. Cisco integrates closed-loop automation into its Crosswork portfolio, giving operators real-time optimisation levers. Ericsson expands beyond RAN into managed cloud operations, bolstered by AI-enabled assurance platforms. IBM pivots Watsonx AI assets toward predictive maintenance, targeting network fault avoidance and SLA adherence.
M&A accelerates scale and capability expansion: Nokia’s Infinera deal deepens optical-packet integration, while ATSG and Evolve IP merged to form XTIUM, forecasting USD 230 million revenue from converged managed IT and telecom services. Amdocs launched Amdocs Studios to embed generative AI into digital-transformation programs. Niche entrants focus on AI-driven network analytics or zero-trust orchestration, carving high-margin sub-segments. Providers differentiate on outcome-based SLAs, multicloud neutrality and domain-specific expertise such as private-5G for manufacturing. The combined share of the top five players sits near 45%, supporting active but not hyper-concentrated rivalry.
Telecom Managed Services Industry Leaders
Cisco Systems, Inc.
Huawei Technologies Co., Ltd.
International Business Machines Corporation
Telefonaktiebolaget LM Ericsson
Verizon Communications Inc.
- *Disclaimer: Major Players sorted in no particular order

Market Opportunities and Future Outlook
Cloud-hosted operations and SaaS-delivered core and OSS/BSS capabilities are making it easier for operators and service providers to package managed services as modular, consumption-aligned offers rather than bespoke, hardware-tethered engagements. A concrete signal is Nokia's February 2026 announcement that Citymesh went live with the first commercial mobile service on 5G Core SaaS powered by Nokia and AWS. It points to how cloud infrastructure and telecom-grade software stacks are being combined to shorten deployment cycles and support enterprise and SME connectivity. This shift creates room for providers that can run multicloud network operations, support migration engineering, and operate cloud-native telecom platforms under outcome-based SLAs.
Regulation-driven security and third-party risk oversight is also increasing demand for managed security, compliance reporting, and auditable operations tooling. The UK Telecommunications Security Code of Practice (version 1.1, July 2026) puts more weight on operator control over third-party suppliers through contractual audit and monitoring powers, encouraging managed service designs that are traceable, testable, and continuously monitored across the supply chain. In the EU, the Digital Networks Act proposal (published January 2026) and the CSA 2.0 direction around supply-chain security add momentum for managed services that standardize controls across multi-vendor environments, including continuous assurance, incident readiness, and governance frameworks aligned to telecom obligations. These policy changes raise the premium for providers that can combine automation, zero-trust operations, and documentation-ready processes across hybrid and multicloud estates.
Recent Industry Developments
- July 2026: Cisco and Lumen expanded collaboration around Cisco-powered networking delivered as a managed service by Lumen, covering capabilities such as SD-WAN, firewall, and security services with centralized management via a Cisco dashboard. The move packages networking and security into a more standardized, operator-like managed offer for enterprises that want simplified procurement and operations. It also raises the competitive bar on integrated assurance and policy control across distributed customer sites.
- June 2026: IBM and Google Cloud announced a strategic partnership to launch a new Google Cloud Practice, combining IBM Consulting Advantage with Google Cloud's Gemini Enterprise Agent Platform to support AI adoption and modernization of core systems. The partnership strengthens delivery capacity for managed modernization programs that blend application, infrastructure, and operational workflows in hybrid cloud environments. For telecom-managed-services buyers, it signals deeper integration between AI tooling and managed operations capabilities.
- June 2026: stc group and Huawei launched an advanced operations and maintenance system to move stc's core network toward Autonomous Networks Level 4, aligned with 3GPP Management Data Analytics Function (MDAF) standards. This adds a concrete reference deployment for AI-assisted network operations and analytics-driven automation at scale. It reinforces a shift toward managed O&M models where vendors and service partners deliver closed-loop optimization and tighter SLA performance management.


Research Methodology Framework and Report Scope
Market Definition and Coverage
For this study, the telecom managed services market counts revenue from outsourced, ongoing operation and management of telecom and related IT functions for operators and enterprise customers, delivered under a managed service contract.
Scope exclusions: We exclude pure consulting, one-time system integration projects without an ongoing managed component, and resale-only connectivity when management is not provided.
Segmentation Overview
- By Organization Size
- Large Enterprises
- Small Enterprises
- By Service Type
- Managed Data Center Services
- Managed Security Services
- Managed Network Services
- Managed Data and Information Services
- Managed Communication Services
- Managed Mobility Services
- By Deployment Model
- On-Premises
- Cloud / Hosted
- By Telecom Operator Type
- Mobile Network Operator (MNO)
- Mobile Virtual Network Operator (MVNO)
- Internet Service Provider (ISP)
- By End-user Vertical
- Consumer Segment
- Enterprise Segment
- Government and Public Safety
- By Geography
- North America
- United States
- Canada
- Mexico
- South America
- Brazil
- Argentina
- Rest of South America
- Europe
- Germany
- United Kingdom
- France
- Italy
- Spain
- Rest of Europe
- Asia-Pacific
- China
- Japan
- India
- South Korea
- Southeast Asia
- Rest of Asia-Pacific
- Middle East and Africa
- Middle East
- Saudi Arabia
- United Arab Emirates
- Turkey
- Rest of Middle East
- Africa
- South Africa
- Nigeria
- Egypt
- Rest of Africa
- Middle East
- North America
Data Sources, Market Sizing, and Validation
Desk Research
Desk research was used to set market boundaries, build the first demand indicators, and clarify what a managed services contract typically covers in telecom and enterprise networks. We referenced public sources such as ITU statistics, OECD telecom indicators, FCC publications, Eurostat datasets, and national telecom regulator releases, which help frame subscriber bases, broadband footprint, and network buildout momentum.
We then reviewed company annual reports, earnings decks, contract announcements, and reputable press coverage to understand where managed services revenues are reported and how the service mix is changing. Patent databases were also checked to sense where automation, OSS/BSS tooling, and security operations are moving, which feeds later forecasting assumptions. A few paid subscriptions for company financials and news were used to cross-check revenue splits and corporate actions. The sources mentioned above are illustrative only, and many other references were used to collect data, validate it, and clear up research questions.
Primary Interviews and Surveys
Primary work focused on validating what is actually included in a telecom managed services contract and what is priced separately, since this can change totals quickly. We spoke with a balanced mix of telecom operators, managed service providers, and enterprise buyers across major regions, and we used these inputs to confirm adoption pace, typical contract terms, and pricing direction.
Input from functional leaders and managers was especially useful for checking near-term spend shifts tied to 5G rollout schedules, cloud-hosted network operations, security workload, and vendor consolidation, and for stress-testing the model outputs before finalizing.
Distribution of primary research fieldwork respondents
| Company type | Respondent position | Region |
|---|---|---|
| Top tier: 29% | CXOs: 22% | APAC: 38% |
| Mid tier: 49% | Functional/Unit leaders: 33% | EMEA: 37% |
| Smaller Players: 22% | Managers: 45% | Americas: 25% |
Market-Sizing & Forecasting
Sizing was built using top-down logic, reconstructing telecom and enterprise network operations spending by region, then filtering it with managed service penetration rates drawn from interviews and public contract patterns. To keep the numbers grounded, we corroborated totals with selective bottom-up approximations, including sampled provider revenue disclosures, channel checks on large outsourcing deals, and simple volume times average contract value for common managed service types.
Key inputs used in the model include the pace of 5G rollout and network modernization, migration toward cloud/hosted network operations, security operations intensity (including managed security and SASE related services), enterprise demand for managed WAN and SD-WAN, and typical contract length and renewal behavior. Where a bottom-up view had gaps, missing areas were filled using peer averages by region and buyer type, followed by re-checking against the top-down demand pool so final totals did not drift.
For forecasting, scenario analysis was applied around a base case, with growth sensitivity tied to operator cost-out programs, macro IT spend direction, and the speed of automation in network operations. The final growth path was adjusted only after primary respondents confirmed whether assumptions like price escalation, service bundling, and cloud-hosted adoption were realistic for the next few years.
Data Validation & Update Cycle
We validate outputs by comparing the model against independent signals such as telecom capex and opex direction, major outsourcing contract flow, and region-level enterprise connectivity demand. Outliers are investigated through checks on currency conversion timing, double counting across service categories, and sudden share shifts that do not align with public moves.
Before sign-off, the work is reviewed in steps, where assumptions, calculations, and regional splits are rechecked by another analyst and then reconciled back to the market definition. Reports refresh annually, and interim updates are triggered when material events occur, such as large contract wins, pricing resets, or major policy and security changes. Before delivery, we do a final pass so the latest market signals are reflected.
Mordor Intelligence's Telecom Managed Services Market Size Compared Against Other Published Estimates
Published market sizes for telecom managed services often differ, even when the same words are used, because the scope can shift between operator-managed services, enterprise managed network services, and adjacent IT outsourcing. Differences also come from how cloud-hosted operations are counted, whether security is bundled, and which year is treated as the current anchor.
The main gap drivers in this market are service-line inclusion, contract revenue recognition timing, and whether estimates start from operator spend pools or from enterprise network services only. Some figures rely on a short historical window and apply a single CAGR, while others use aggressive assumptions around 5G rollout pacing and price progression without tying them to contract duration and renewal cycles.
Benchmark comparison
| Source | Market Size | Gaps in Research Methodology |
|---|---|---|
| Mordor Intelligence | USD 28.76 B (2025) | |
| Business Wire Brief A | USD 23.90 B (2024) | Uses an earlier anchor year and a shorter analysis window, and the scope can undercount newer cloud-hosted operations and bundled security that are increasingly priced inside managed service contracts. |
| Industry Publisher B | USD 32.00 B (2024) | States a single global value with limited clarity on what is included across operator type and service categories, and regional weighting and currency timing are not clearly linked back to contract-led demand signals. |
Overall, the spread is explained by what is counted as a managed service and how the current year is defined, which then changes the growth runway and the implied pricing curve. When cloud-hosted NOC and SOC work, deployment model splits, and operator-type coverage are kept separate and refreshed through annual contract checks, the totals stay more consistent, which is applied by Mordor Intelligence.


Key Questions Answered in the Report
How fast is the telecom managed services market expected to grow?
The market is forecast to advance at an 11.02% CAGR, reaching USD 53.83 billion by 2031.
Which deployment model is expanding the fastest?
Cloud-hosted services lead with a 12.74% CAGR and captured 62.15% market share in 2025.
Why are managed security services growing rapidly?
Zero-trust mandates and 5G core virtualization create complex threat vectors, driving managed security at a 11.78% CAGR.
Which region will experience the highest growth rate?
Asia Pacific leads with an 11.53% CAGR through 2031, propelled by extensive 5G infrastructure investment and Industry 4.0 uptake.
Page last updated on:






