
Telecom Expense Management Market Size and Share
Market Overview
| Study Period | 2020 - 2031 |
|---|---|
| Market Size (2026) | USD 5.64 Billion |
| Market Size (2031) | USD 10.85 Billion |
| Growth Rate (2026 - 2031) | 13.98 % |
| Fastest Growing Market | Asia Pacific |
| Largest Market | North America |
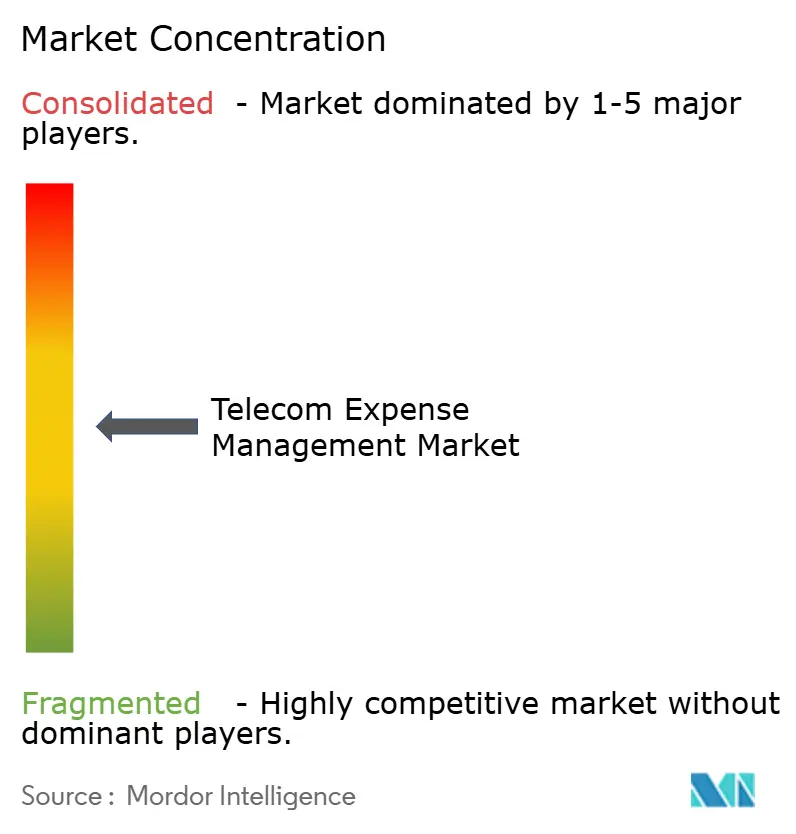
| Market Concentration | Medium |
Major Players *Disclaimer: Major Players sorted in no particular order Image © Mordor Intelligence. Reuse requires attribution under CC BY 4.0. | |
Telecom Expense Management Market Analysis by Mordor Intelligence
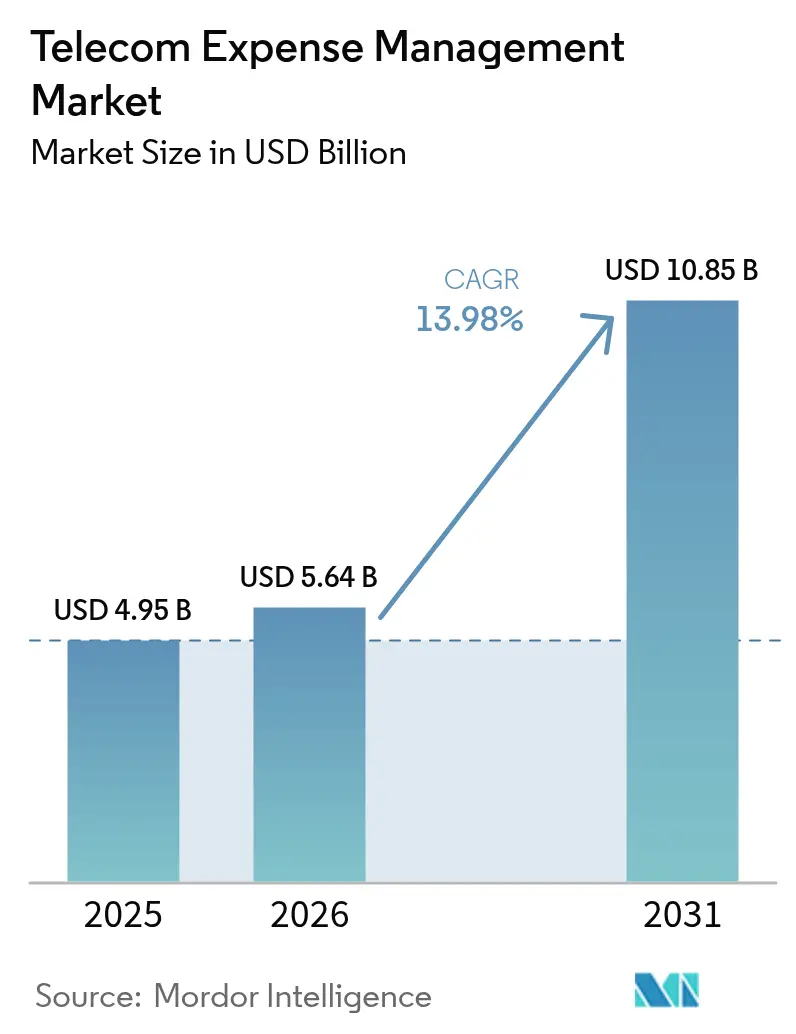
The Telecom Expense Management Market size was valued at USD 4.95 billion in 2025 and estimated to grow from USD 5.64 billion in 2026 to reach USD 10.85 billion by 2031, at a CAGR of 13.98% during the forecast period (2026-2031).
Capacity constraints in traditional cost-control processes, the march toward private 5G and edge deployments, and new Scope-3 reporting mandates keep the growth engine running. Enterprises now view unified visibility across wireline, wireless, cloud, and SaaS services as an operational must-have rather than a finance accessory, a shift reinforced by vendor consolidation and managed-service adoption waves. North America remains the demand anchor thanks to tight regulatory regimes and mature procurement teams, while Asia-Pacific’s digital acceleration and 5G subscriber boom drive the fastest regional expansion. Heightened cost-pressure cycles, the rise of predictive analytics for real-time optimization, and growing sustainability reporting duties collectively expand addressable spend categories, reinforcing the long-term upside locked into the telecom expense management market.
Key Report Takeaways
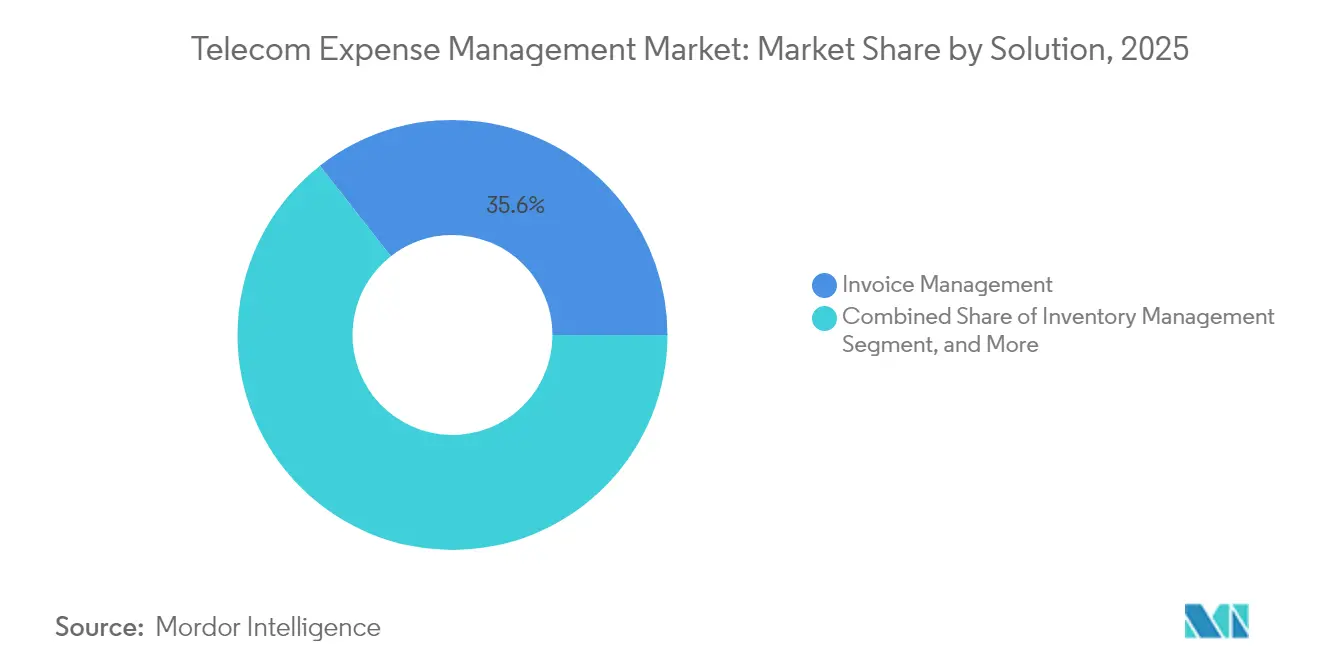
- By solution, invoice management led with 35.57% of the telecom expense management market share in 2025, while usage management and reporting is projected to grow at a 14.04% CAGR through 2031.
- By service delivery model, the managed services segment held 41.82% of the telecom expense management market size in 2025; hosted cloud services offer the quickest upside at a 14.15% CAGR to 2031.
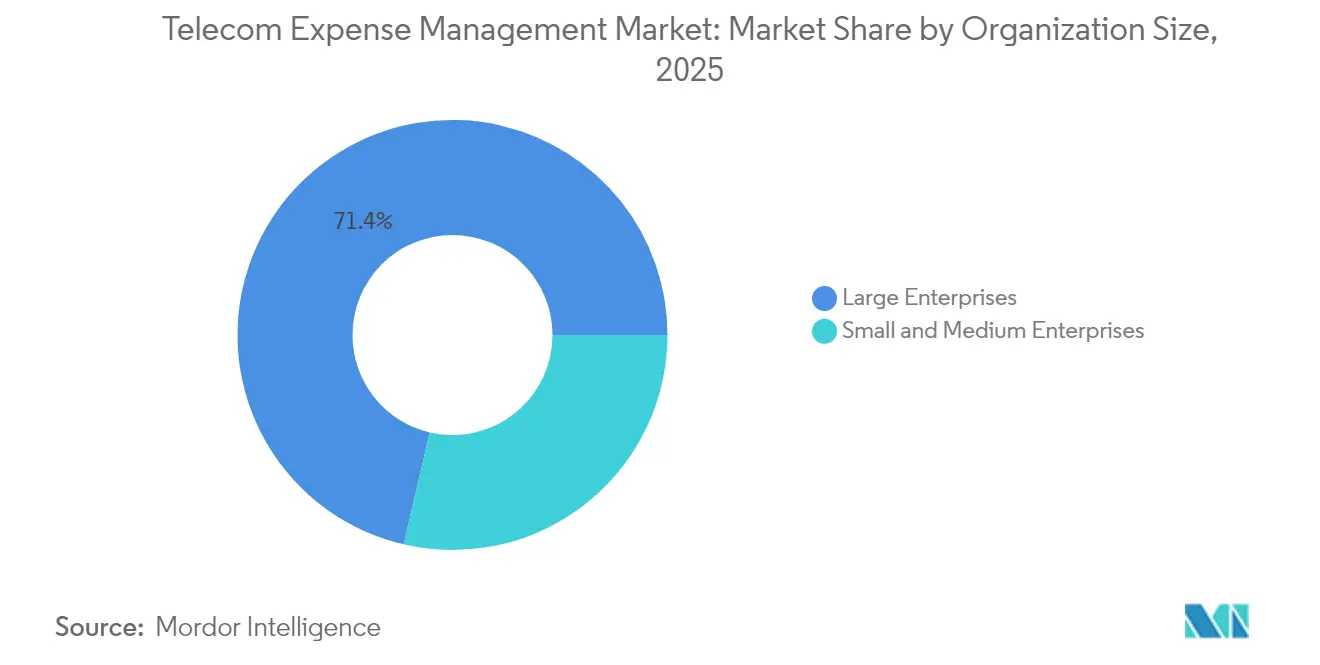
- By organization size, large enterprises commanded 71.35% share of the telecom expense management market size in 2025, whereas small and medium enterprises are scaling at a 14.05% CAGR through 2031.
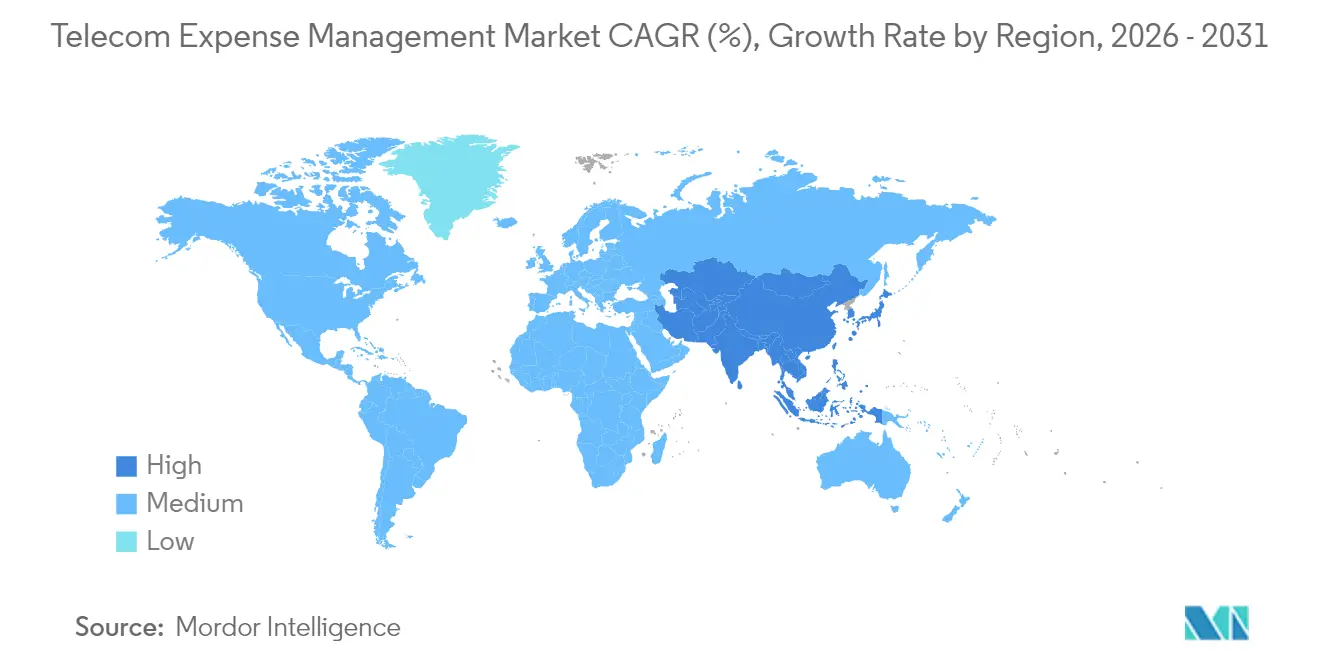
- By geography, North America captured 35.42% revenue share in 2025, while Asia-Pacific is advancing at a 14.18% CAGR toward 2031.
Note: Market size and forecast figures in this report are generated using Mordor Intelligence’s proprietary estimation framework, updated with the latest available data and insights as of 2026.
Market Trends and Insights
Drivers Impact Analysis of Telecom Expense Management Market*
| Driver | (~) % Impact on CAGR Forecast | Geographic Relevance | Impact Timeline |
|---|---|---|---|
| Proliferation of BYOD & mobile workforce adoption | +2.1% | Global, strongest in North America & EU | Medium term (2-4 years) |
| Need for visibility into telecom spend & tariff complexity | +2.8% | Global | Short term (≤ 2 years) |
| Shift from CapEx to OpEx via managed services | +1.9% | North America & Asia-Pacific | Medium term (2-4 years) |
| Integration of AI/analytics for automated invoice auditing | +2.3% | Global, early adoption in North America | Short term (≤ 2 years) |
| Private-5G networks creating new expense categories | +1.7% | Asia-Pacific & North America, spill-over to EU | Long term (≥ 4 years) |
| Sustainability pressure for Scope-3 telecom usage reporting | +1.4% | EU & North America, expanding to Asia-Pacific | Long term (≥ 4 years) |
| Source: Mordor Intelligence | |||
Need for Visibility into Telecom Spend and Tariff Complexity
Hybrid ecosystems of private networks, edge workloads, and IoT links create billing layers that manual processes cannot reconcile at scale. Valicom audits show error rates in more than 35% of telecom invoices, affecting rate accuracy, zero-use lines, and end-of-life services. [1]Consumption-based 5G and cloud bundles intensify the risk of bill shock, forcing finance and network teams to migrate toward real-time dashboards that pair usage telemetry with predictive benchmarks. Operator migration to API-based network slicing adds another variable set, challenging enterprises to stay ahead of cascading tariff structures. Finance controllers also face compliance duties that require cost allocation by business unit and jurisdiction, accelerating the shift from spreadsheet tracking to specialized telecom expense management market platforms.
Integration of AI/Analytics for Automated Invoice Auditing
Artificial intelligence recasts expense oversight from periodic review to perpetual optimization. Tangoe reports that machine-learning models flag anomalies, contract breaches, and optimization opportunities within minutes of file ingestion.[2] KPMG notes that automated invoice workflows reduce manual effort by 60-80% while lifting accuracy rates, freeing analysts to negotiate instead of reconcile. Advanced platforms map usage patterns against productivity metrics, guiding right-sizing decisions that align cost with business value. Continuous learning loops refine policy recommendations, tightening vendor compliance and elevating savings delivered by the telecom expense management market.
Proliferation of BYOD and Mobile Workforce Adoption
Hybrid work pushes device counts up 40% versus pre-pandemic baselines, along with data plans, roaming policies, and security stacks that require granular allocation logic. International footprints introduce roaming-cost volatility and multilayer tax implications. [3]Modern systems blend device-lifecycle management with telecom expense analytics, producing user-level cost maps and automated chargebacks that reinforce spend accountability. The rising total cost of mobility propels enterprises toward unified telecom expense management market platforms that converge policy enforcement, cost transparency, and security reporting.
Shift from CapEx to OpEx via Managed Services
Enterprises tilt toward variable-cost models, outsourcing operational risk to managed-service providers that commit to measurable savings. TSIA observes a swing from license-plus-maintenance to value-based pricing, obligating providers to hit outcome targets rather than time and material metrics. Managed partners deliver scalable analytics, benchmark libraries, and negotiated tariffs that most enterprises cannot replicate internally. This OpEx orientation amplifies the accessibility of the telecom expense management market for mid-market buyers, opening a wider demand funnel without large upfront investments.
Restraints Impact Analysis of Telecom Expense Management Market*
| Restraint | (~) % Impact on CAGR Forecast | Geographic Relevance | Impact Timeline |
|---|---|---|---|
| Data-security concerns limiting TEM outsourcing | -1.8% | Global, heightened in EU and North America | Short term (≤ 2 years) |
| Fragmented invoice formats and lack of standards | -1.3% | Global | Medium term (2-4 years) |
| Shadow-IT obscuring usage data accuracy | -1.1% | North America and EU | Short term (≤ 2 years) |
| Talent shortage in TEM analytics specialists | -0.9% | Global, acute in Asia-Pacific | Long term (≥ 4 years) |
| Source: Mordor Intelligence | |||
Data-Security Concerns Limiting TEM Outsourcing
Highly regulated sectors hesitate to expose telecom usage files containing sensitive operational data. Rising ransomware incidents and cross-border privacy regimes deepen due-diligence cycles, adding cost and elongating sales cycles for providers. Hybrid deployment models that keep raw data on-premise but run analytics in the cloud mitigate some risk yet decrease optimization depth. Providers must invest in SOC2-type attestations, zero-trust architectures, and region-specific data-sovereignty controls to ease concerns and unlock broader uptake within the telecom expense management market.
Shadow-IT Obscuring Usage Data Accuracy
Unsanctioned SaaS and personal upgrades create blind spots, preventing complete spend baselines. Calero finds that untracked cloud apps inflate total technology costs and weaken vendor consolidation leverage. Fragmented data forces finance teams to pair telecom expense management market dashboards with discovery tools that hunt down unofficial services. Until visibility gaps close, savings projections and contract renegotiation cycles carry greater uncertainty, muting some benefits derived from advanced optimization engines.
*Our forecasts treat driver/restraint impacts as directional, not additive. The impact forecasts reflect baseline growth, mix effects, and variable interactions.
Telecom Expense Management Market Segment Analysis
By Solution:
Invoice Management Dominates Despite Analytics SurgeInvoice management retained 35.57% of the telecom expense management market share in 2025, underscoring enterprises’ persistent focus on billing accuracy and allocation discipline. The solution’s embedded workflows validate rates, line items, and taxes across thousands of invoice feeds, defending budget integrity in complex multi-vendor estates. Valicom audits routinely uncover 15–20% recoverable spend, highlighting why invoice control remains foundational. Yet a strategic pivot is underway: usage management and reporting is scaling at a 14.04% CAGR, signaling hunger for real-time dashboards that avoid surprise overages instead of reconciling them after the fact.
The telecom expense management market now pairs traditional invoice engines with AI-driven analytics that forecast consumption against policy thresholds, automatically generating recommendations before the billing cut-off. As 5G slicing, edge workloads, and UCaaS grow, enterprises demand predictive insights to mix and match service tiers dynamically. Vendors respond by embedding machine-learning models and intuitive visualization layers, a shift that moves the category from post-pay hygiene to proactive optimization.

By Service Delivery Model:
Managed Services Lead Amid Cloud AccelerationManaged services led with 41.82% of the telecom expense management market size in 2025 as boards pushed to convert fixed technology costs into variable service fees linked to outcomes. Providers furnish rate-benchmark libraries, carrier negotiation muscle, and continuous process governance that most enterprises cannot develop internally. The hosted-cloud services slice expands fastest at 14.15% CAGR, propelled by subscription flexibility and hassle-free upgrades.
Platform convergence is blurring lines between managed and hosted modes. Many vendors now bundle advisory muscle with SaaS consoles, letting clients dial service levels up or down without re-platforming. The consumption model also appeals to private-equity-backed enterprises that maintain lean IT headcount while scaling acquisitions. This interplay keeps both delivery models intertwined within the telecom expense management market roadmap.
By Deployment Mode:
Cloud Dominance Accelerates Hybrid AdoptionCloud and SaaS platforms represented 64.38% share of the telecom expense management market in 2025, thanks to auto-scaling, zero maintenance, and continuous AI model refreshes. Large enterprises with strict privacy mandates nonetheless keep certain datasets in-house, giving rise to a hybrid cohort growing at 14.01% CAGR.
Hybrid frameworks funnel raw call-detail records to local repositories while exporting anonymized metrics to cloud engines for pattern analysis, balancing risk with insight. On-premise footprints persist in defense and public-safety environments, but new feature rollouts now debut in the cloud first. This sequencing nudges risk-averse customers toward partial migration paths, reinforcing the hybrid runway embedded in the telecom expense management market.
By Organization Size:
SME Growth Signals DemocratizationLarge enterprises held 71.35% of 2025 revenue, reflecting their sprawling estates and MandA-driven vendor mix that demands advanced governance. Yet SMEs are expanding at 14.05% CAGR, enabled by cloud onboarding kits, template policy libraries, and pay-as-you-save pricing. Self-service dashboards once reserved for Fortune-500 teams are now packaged into quick-start modules, compressing deployment from months to weeks.
Cost-focus culture in mid-market firms dovetails with mounting telecom complexity driven by UCaaS, SD-WAN, and IoT pilots. McKinsey research underscores that smaller companies reach double-digit savings when they digitize spend oversight, validating ROI narratives even at modest invoice volumes. This democratization trend enlarges the cumulative telecom expense management market addressable base.
By End-user Industry:
IT and Telecom Leadership Amid Healthcare AccelerationIT and telecom operators captured 28.02% share in 2025, leveraging domain familiarity and scale economies to extract value from advanced optimization engines. Healthcare and life-sciences, however, post the briskest run-rate at 14.03% CAGR as telemedicine, IoT medical devices, and HIPAA audit trails inflate connectivity bills and compliance stakes.
Case studies from Wireless Watchdogs show a single U.S. provider saving USD 10.5 million by unifying wireless spend controls and compliance reporting. Manufacturing outfits add momentum as Industry 4.0 mirrors telecom’s data explosion, making predictive tariff alignment central to bottom-line gains. The telecom expense management market thus stretches across verticals, each layering industry-specific compliance and cost nuances onto a shared platform core.
Geography Analysis
North America Telecom Expense Management Market
North America commanded 35.42% revenue in 2025, driven by mature procurement frameworks, strict SOX and FCC reporting rules, and an entrenched ecosystem of service providers offering deep carrier relationships. U.S. multinationals juggle vast cross-border voice, data, and IoT estates, heightening reliance on granular analytics to sharpen contract negotiations and allocate spend by business unit. Regulatory incentives around e-rate, C-band clearing, and green-spectrum auctions continue to reshape billing constructs, offering the telecom expense management market steady demand stimuli.
APAC Telecom Expense Management Market
Asia-Pacific is the sprint leader with a 14.18% CAGR between 2026 and 2031. GSMA projects 2.1 billion mobile subscribers feeding USD 880 billion into regional GDP by 2030. This subscriber swell accelerates private-network pilots across manufacturing hubs in Japan, South Korea, and India. Expereo observes that the region drives roughly 60% of global data-center capacity growth, layering new vendor mixes onto enterprise connectivity stacks. As currencies fluctuate and regulatory regimes diversify, CFOs adopt sophisticated telecom expense management market tools to consolidate carrier bills, normalize tax treatments, and keep pace with dynamic discount schedules.
EMEA and South America Telecom Expense Management Market
Europe maintains a steady climb powered by GDPR, eco-design directives, and rising carbon-reporting obligations that force enterprises to quantify telecom-linked Scope-3 footprint. Multi-country operators issue invoices in varied templates and tax codes, fuelling uptake of AI-driven normalization engines. Middle East and Africa show green-shoot potential as 5G rollouts, smart-city ambitions, and public-sector modernization inject complexity into billing ecosystems. South America, led by Brazil and Argentina, turns to SaaS-based solutions to battle currency volatility and telecom inflation. Collectively, geographic nuance sustains a diversified growth trajectory for the telecom expense management market, shielding it from isolated macro shocks.
Regulatory Landscape
Telecom expense management (TEM) demand is shaped by shifting telecom rules that change billing constructs, the retirement of legacy networks, and cross-border compliance expectations. In the United States, the Federal Communications Commission (FCC) released a Report and Order in April 2026 (effective May 20, 2026) to consolidate technology transitions discontinuance requirements tied to legacy copper retirement, accelerating carrier change programs that enterprises must track for service inventory, contract terms, and dispute workflows within TEM.
In Europe, the policy direction continues toward harmonization and faster high-capacity deployment. The European Commission proposed the Digital Networks Act in January 2026 as a single regulation to streamline authorization and network deployment across the EU, while the Gigabit Infrastructure Act became largely applicable in November 2025 to reduce rollout costs. In India, the Department of Telecommunications issued Telecommunications (Authorisation for Provision of Principal Telecommunication Services) Rules, 2026 (June 2026), which standardize authorization processes under the Telecommunications Act, adding another layer of jurisdiction-specific requirements for enterprises managing multi-country connectivity estates.
Value Chain Analysis
The TEM value chain begins with enterprise telecom, mobility, and cloud usage data generation (wireless and wireline services, UCaaS, SD-WAN, and device fleets), followed by carrier billing and tax application across geographies. TEM providers ingest invoices, contracts, and inventories, normalize formats, and run audit, dispute, and optimization analytics, then deliver outcomes through SaaS platforms and/or managed services. Downstream, enterprises operationalize results via chargeback/showback, sourcing and procurement actions, and policy controls (BYOD stipends, roaming, and device lifecycle), often integrating with IT financial management and FinOps toolsets.
Channel and ecosystem partners increasingly shape distribution and implementation, particularly for mid-market and multi-site deployments. SimpleTek joining Telarus as a supplier partner in July 2026 aims to deliver TEM and managed mobility services through an advisor ecosystem, and Brightfin announced an Australia customer win in February 2026 via its managed services partner Mobilise IT. Consolidation and adjacent-platform integration are also visible: Connectbase acquiring Cloud Age in December 2025 combines telecom invoice and spend management data with connectivity sourcing workflows, while Saaswedo partnering with Software Contract Solutions in June 2026 links TEM and mobility services with software asset management and license audit capabilities.
Competitive Landscape
The market is moderately fragmented, with the top five vendors estimated to hold around 50% combined revenue, leaving room for specialist entrants. Tangoe, Calero-MDSL, and Cass Information Systems anchor the leader tier, each expanding into multi-category technology expense management spanning cloud IaaS, SaaS, and mobility. Tangoe’s AI-first roadmap flags invoice anomalies in near real-time, shortening recovery cycles and boosting client savings benchmarks. Calero-MDSL leans on Gartner-recognized SaaS-management modules to cross-sell into unified expense suites, while Cass Information Systems pivoted by divesting its TEM arm to Asignet to refocus on logistics and payments.
Disrupters leverage cloud-native architectures and embedded automation to serve SMEs at lower price points, pressuring incumbents to streamline onboarding flows. AppDirect’s November 2024 purchase of vCom Solutions reflects a broader consolidation wave as platform providers seek scale for data-science investments. Vertical-specific flavors emerge: providers package healthcare-compliance reporting or energy-sector supply-chain metrics to differentiate. Carrier-embedded services also rise, with telcos bundling basic analytics into enterprise contracts, nudging the telecom expense management market toward co-opetition between operators and traditional TEM firms.
Technology differentiation centers on predictive models, anomaly-resolution bots, and open-API stacks that pull data from SD-WAN controllers, cloud spending hubs, and software license managers. Vendors invest in carbon-footprint calculators, enabling clients to quantify emissions tied to data transport and device fleets. Client references show average savings of 10–20% within the first contract year, underscoring the strategic weight carried by platform selection in overall digital-transformation ROI calculations.
Telecom Expense Management Industry Leaders
-
Sakon Inc.
-
Avotus Corporation
-
Tangoe, Inc.
-
Calero-MDSL
-
WidePoint Solutions Corporation
- *Disclaimer: Major Players sorted in no particular order
Telecom Expense Management Market Companies Covered in this Report
- Tangoe Inc.
- Calero-MDSL
- Cass Information Systems Inc.
- Sakon Inc.
- Tellennium Inc.
- WidePoint Corporation
- Avotus Corporation
- Valicom Corporation
- Upland Software Inc. (Cimpl)
- CGI Inc.
- Accenture PLC (Network Services)
- TeleManagement Technologies Inc.
- Auditmacs
- Dimension Data (NTT Ltd.)
- Mitel Networks Corp.
- Intrado Corporation (West)
- Advantix Solutions Group
- Comview Corporation (Calero)
- Subex Ltd.
- Xigo (Verizon)
- Basware Corp.
Market Opportunities and Future Outlook
One clear whitespace for TEM vendors is deeper control of mobility-led cost drivers, as enterprise spend mix shifts toward mobile and wireless. Mindglobal reported mobile and wireless services at an average 42% of enterprise telecom spend in 2026, up from 31% in 2021, which points to product demand around BYOD stipend administration, roaming governance, device lifecycle automation, and user-level chargeback that ties usage telemetry to policy outcomes rather than invoice-only reconciliation.
Another opportunity sits at the intersection of compliance-grade reporting and cross-domain cost visibility spanning telecom, SaaS, and cloud. The CSRD expands structured ESG reporting starting in 2026 for more companies, including listed SMEs, which raises the need for TEM outputs that support auditable allocation and environmental reporting for connectivity and device estates. Interest in AI-powered TEM and governance also showed up at the Enterprise Telecom Management Association (ETMA) Spring Conference in February 2026, reinforcing demand for platforms that bring together automated audit, vendor management, and integrated cost intelligence across wireline, wireless, and cloud services.
Recent Industry Developments in Telecom Expense Management Market
- June 2026: Sakon published outcomes from mobility automation deployments for a Fortune 100 aerospace and defense company and a global food and beverage leader, citing more than USD 1 million in annual savings in each case. These results position TEM programs as operational automation for mobility services, not only invoice validation, and they reinforce outcome-based managed service models in large, complex estates.
- February 2026: Tangoe released its 2026 IT Expense Management Trends and Savings Recommendations report, drawing on aggregated intelligence from USD 34 billion in technology spend. The focus on spend intelligence across categories supports TEM platform expansion into broader technology expense governance and strengthens vendor benchmarking narratives used in sourcing and dispute negotiations.
- November 2024: AppDirect completed the acquisition of vCom Solutions, expanding its enterprise cost-optimization portfolio. The deal highlighted consolidation pressure in TEM-adjacent platforms, encouraging broader suites that connect procurement, inventory, and multi-vendor spend control under one operating model.
Telecom Expense Management Market Report Scope and Research Methodology
Market Definition and Coverage
For this study, the telecom expense management market covers software and service activities that help enterprises control, audit, and optimize telecom spending across mobile, fixed, and data services. This includes inventory management, billing visibility, and usage governance across carriers and accounts.
Scope exclusions: We exclude carrier core billing and network operations tools that do not have an enterprise TEM cost-control and governance use case.
Segments Covered in This Report
- By Solution
- Invoice Management
- Mobility and Device Management
- Sourcing and Procurement
- Expense Auditing and Optimization
- Usage Management and Reporting
- Dispute Management
- Inventory Management
- UCC Cost Management
- Other Solutions
- By Service
- Managed Service
- Hosted / Cloud Service
- Professional Services
- By Deployment Mode
- On-premise
- Cloud / SaaS
- Hybrid
- By Organization Size
- Large Enterprises
- Small and Medium Enterprises
- By End-user Industry
- BFSI
- Retail and Consumer Goods
- Manufacturing
- IT and Telecom
- Healthcare and Life Sciences
- Energy and Utilities
- Government and Public Sector
- Other End-user Industries
- By Geography
- North America
- United States
- Canada
- Mexico
- Europe
- United Kingdom
- Germany
- France
- Italy
- Spain
- Russia
- Rest of Europe
- Asia-Pacific
- China
- India
- Japan
- South Korea
- Australia and New Zealand
- ASEAN (Singapore, Indonesia, Thailand)
- Rest of Asia-Pacific
- South America
- Brazil
- Argentina
- Colombia
- Rest of South America
- Middle East
- Saudi Arabia
- United Arab Emirates
- Turkey
- Israel
- Rest of Middle East
- Africa
- South Africa
- Nigeria
- Kenya
- Rest of Africa
- North America
Data Sources, Market Sizing, and Validation
Desk Research
Desk research was used to set the context for demand, pricing, and adoption before we built the market model. We referred to public sources such as the US SEC filings database, the US Bureau of Labor Statistics, the OECD and World Bank indicators, and telecom and IT standards bodies and association portals that publish market and usage context.
To tighten assumptions, we also reviewed investor presentations, annual reports, and reputable press coverage to understand TEM buying triggers, contract structures, and pricing shifts across SaaS and managed services. In a few cases, paid subscriptions were used for company financials and intelligence, news screening, and patent lookups so we could cross-check vendor revenue cues and product moves over time. These sources are illustrative rather than exhaustive, and many other public references were also consulted for data collection, validation, and clarification.
Primary Interviews and Surveys
Primary work focused on validating what portion of enterprise telecom spend is realistically addressable by TEM, and how that pool changes with mobility policies, cloud collaboration usage, and multi-carrier contracting. We spoke with practitioners across procurement, IT operations, finance, and managed service delivery, then checked assumptions across the Americas, EMEA, and APAC to avoid averaging regional price levels and adoption patterns too casually.
Distribution of primary research fieldwork respondents
| Company type | Respondent position | Region |
|---|---|---|
| Top tier: 31% | CXOs: 18% | APAC: 47% |
| Mid tier: 49% | Functional/Unit leaders: 35% | EMEA: 30% |
| Smaller Players: 20% | Managers: 47% | Americas: 23% |
Market-Sizing & Forecasting
We sized demand by first reconstructing the addressable enterprise telecom spend and then estimating the portion that typically flows into TEM programs using adoption rates by region and organization maturity. We translated that pool into market value using prevailing pricing structures.
Results were corroborated with selective bottom-up approximations such as sampled contract pricing, vendor revenue cues where available, and channel checks. When the two views drifted, we adjusted totals to bring the model back to a consistent story.
Key inputs used in the model included enterprise mobility and remote-work intensity, the share of telecom services under centralized procurement, average device and line counts per employee band, managed-service attachment rates, and typical savings-share or subscription pricing used in contracts. For forecasting, we used scenario analysis supported by expert views, since growth can swing with cost-cutting cycles, vendor consolidation, and the pace of SaaS and managed-service conversions. Where bottom-up signals were incomplete for smaller providers, we filled gaps through calibrated penetration assumptions and pricing bands validated during interviews.
Data Validation & Update Cycle
Outputs are checked against independent signals, including whether implied revenue per managed line or per enterprise sits within realistic ranges and whether regional splits track known enterprise IT spending patterns. If a result looks inconsistent, we revisit variable assumptions, re-check source notes, and re-contact select respondents to confirm whether a contract or pricing shift is real or just an outlier.
A multi-step review is followed before sign-off, with peer checks on scope boundaries and math logic, and then a final consistency pass on the storyline and numbers. Reports are refreshed annually, with interim updates when material events occur, and a last pre-delivery scan is completed so clients receive the latest view.
Mordor Intelligence's Telecom Expense Management Market Size Measured Against Other Published Estimates
Published values for telecom expense management often do not match, since different studies mix scopes and time bases in ways that change what gets counted. The spread also comes from how providers are captured, what parts of managed service work are treated as in-scope revenue, and how currency timing and inflation are handled.
Carrier contract benchmarks, observed ranges of per-line or per-device TEM fees, and interview-backed managed-service attachment rates are the checks used to keep Mordor Intelligence tied to a realistic addressable enterprise spend pool. These checks can move the total when another estimate leans on software-only revenue or older price points.
Benchmark comparison
| Source | Market Size | Gaps in Research Methodology |
|---|---|---|
| Mordor Intelligence | USD 4.95 B (2025) | |
| Global Consultancy A | USD 4.10 B (2024) | Uses a 2024 base with limited carry-forward of managed-service revenue, and applies conservative penetration in large enterprises without re-checking fee-per-line ranges by region. |
| Trade Journal B | USD 3.90 B (2024) | Counts mainly SaaS subscriptions and excludes a fuller set of audit, dispute, and ongoing managed TEM work, which lowers the captured value in multi-carrier environments. |
The table suggests most differences come from what is counted as TEM revenue (software only versus software plus managed and professional work) and from how adoption and pricing are refreshed year to year. By tying value to clear spend pools, practical penetration assumptions, and fee benchmarks that can be repeated, we keep the output transparent and easier to reconcile with real buying behavior.
Key Questions Answered in the Report
How large is the telecom expense management market in 2026?
The telecom expense management market size stands at USD 5.64 billion in 2026.
What is the expected growth rate through 2031?
The market is projected to register a 13.98% CAGR between 2026 and 2031.
Which region is expanding fastest?
Asia-Pacific posts the highest growth trajectory with a 14.18% CAGR.
Which solution type is gaining the most momentum?
Usage management and reporting is scaling at a 14.04% CAGR, outpacing other solutions.
Why are SMEs adopting TEM platforms now?
Cloud-based subscription models and simplified onboarding lower entry barriers, helping SMEs realize double-digit savings.
What is driving managed-service demand?
Enterprises prefer OpEx models that transfer optimization responsibility and performance risk to specialized providers.