
Technical Ceramics Market Size and Share
Market Overview
| Study Period | 2020 - 2031 |
|---|---|
| Market Size (2026) | USD 10.09 Billion |
| Market Size (2031) | USD 14.54 Billion |
| Growth Rate (2026 - 2031) | 7.58 % |
| Fastest Growing Market | Asia-Pacific |
| Largest Market | Asia-Pacific |
| Market Concentration | Low |
Major Players *Disclaimer: Major Players sorted in no particular order Image © Mordor Intelligence. Reuse requires attribution under CC BY 4.0. | |
Technical Ceramics Market Analysis by Mordor Intelligence
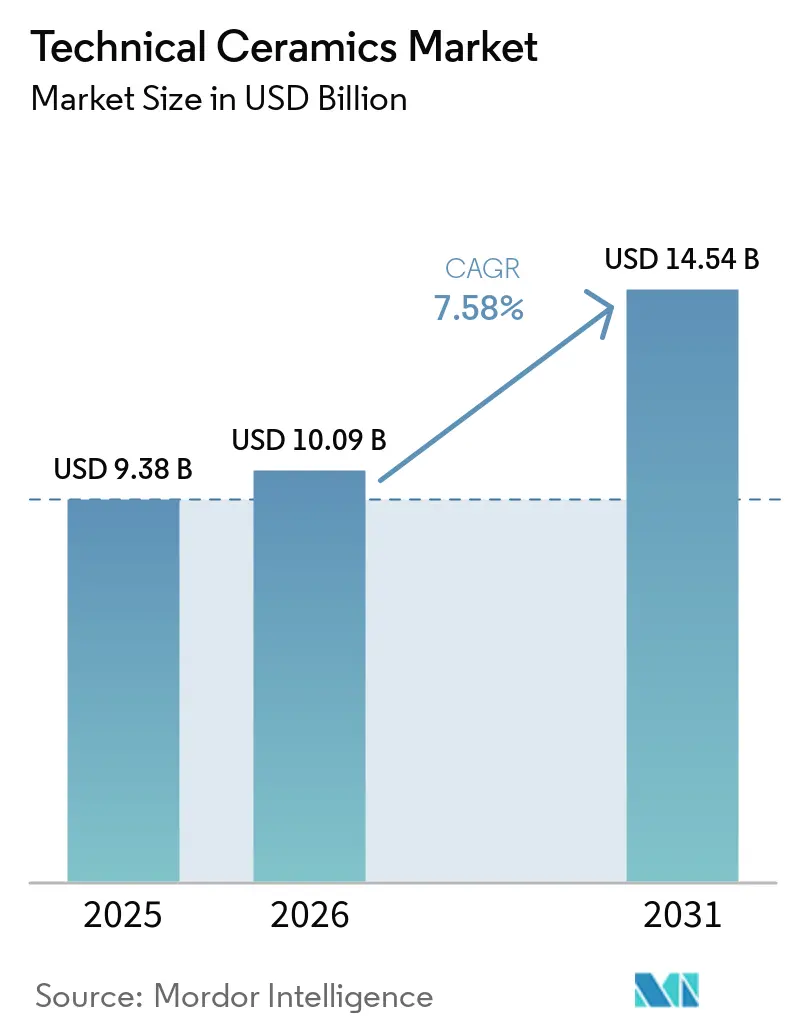
Technical Ceramics Market size in 2026 is estimated at USD 10.09 billion, growing from 2025 value of USD 9.38 billion with 2031 projections showing USD 14.54 billion, growing at 7.58% CAGR over 2026-2031. Demand is clustering around semiconductor substrates, electric-vehicle (EV) thermal control parts, and biocompatible implants, where failure tolerance is virtually zero and material science is a strategic differentiator. Rising fab construction across China, Japan, and South Korea is lifting consumption of aluminum nitride and silicon carbide packages, while 800 V EV drive-train architectures force automakers to specify ceramic heat spreaders that can dissipate more than 200 W/mK without compromising electrical insulation. Supply chains remain vulnerable to critical-mineral concentration, yet leading producers are countering with capacity additions in lower-risk jurisdictions and tighter recycling loops that reduce virgin material exposure. Monolithic formulations still dominate volume, but ceramic-matrix composites are accelerating fastest as aerospace and defense primes pay premiums for lighter, hotter-capable components that cut mass and raise fuel efficiency.
Key Report Takeaways
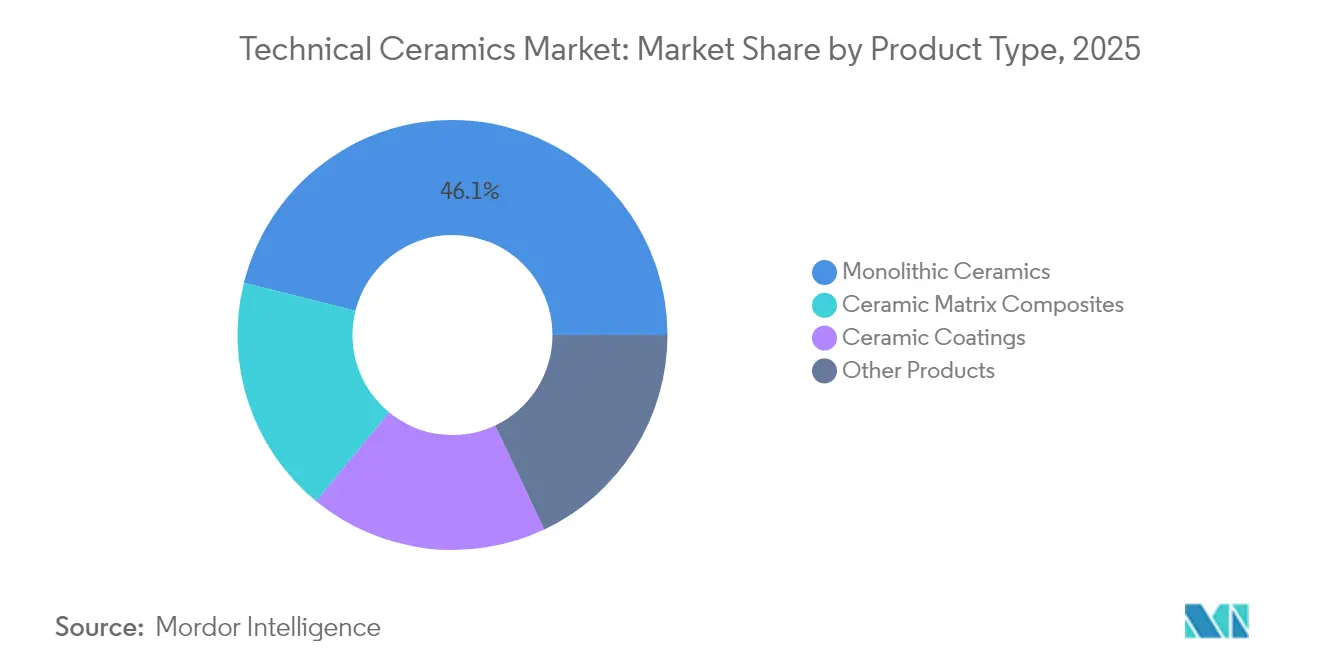
- By product type, monolithic ceramics held 46.10% of the technical ceramics market share in 2025, while ceramic matrix composites are poised for the quickest expansion at an 8.84% CAGR through 2031.
- By material class, oxide ceramics captured 62.80% revenue in 2025; non-oxide variants are projected to register a 7.76% CAGR during 2026-2031.
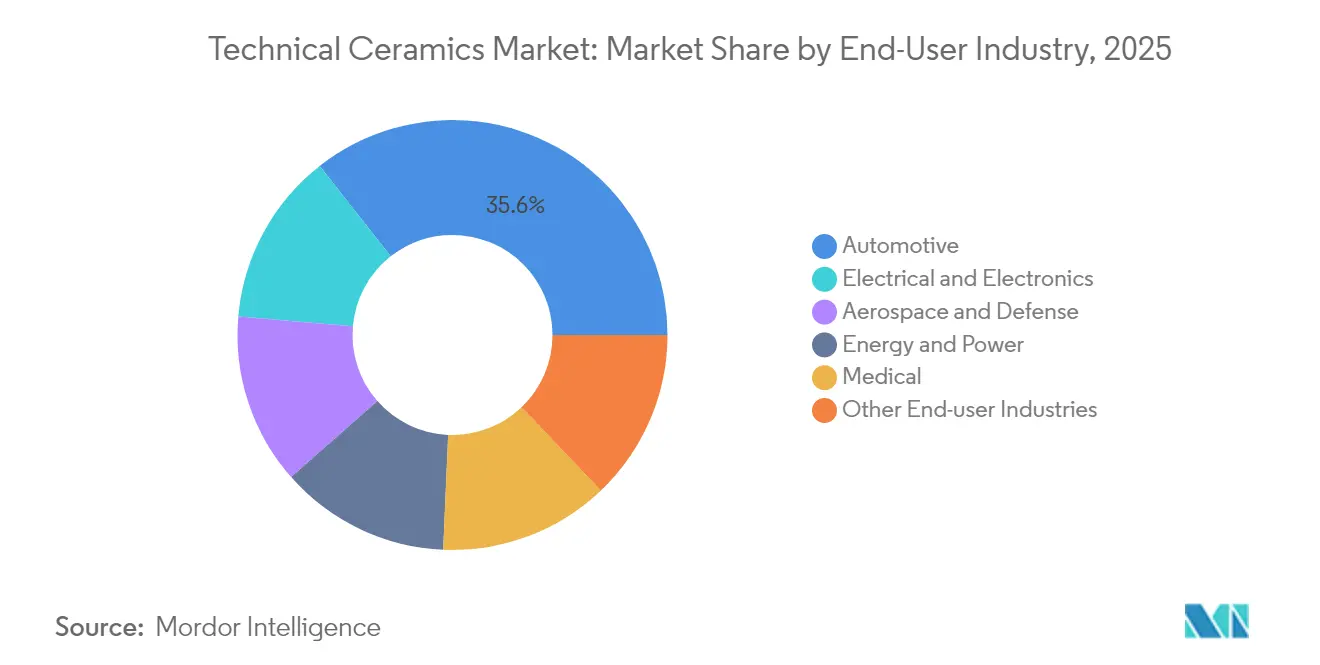
- By end-user industry, automotive accounted for 35.60% of the technical ceramics market size in 2025, whereas electrical and electronics is slated to grow fastest at 9.29% annually to 2031.
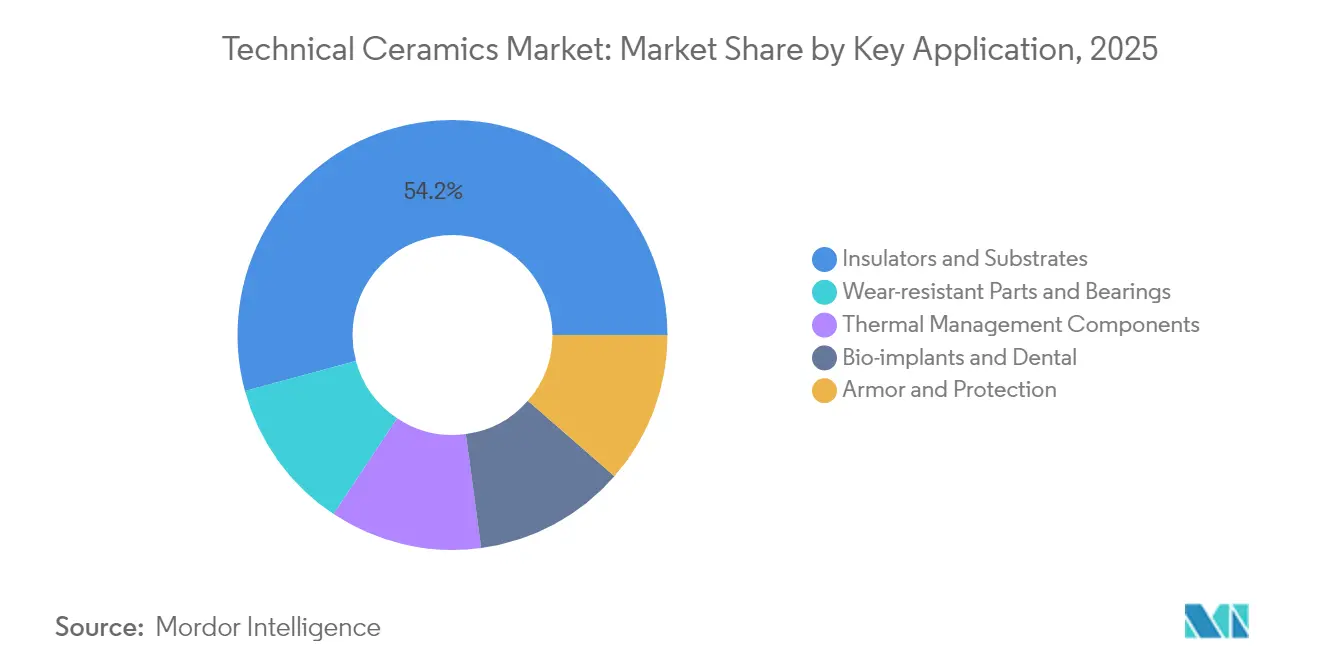
- By key application, insulators and substrates secured 54.20% share of the technical ceramics market size in 2025; wear-resistant parts and bearings should climb at an 8.11% CAGR over the forecast window.
- By region, Asia Pacific dominated with 43.40% of the 2025 total and is forecast to compound at 7.84% to 2031.
Note: Market size and forecast figures in this report are generated using Mordor Intelligence’s proprietary estimation framework, updated with the latest available data and insights as of 2026.
Market Trends and Insights
Drivers Impact Analysis of Technical Ceramics Market*
| Driver | (~) % Impact on CAGR Forecast | Geographic Relevance | Impact Timeline |
|---|---|---|---|
| Expanding semiconductor & consumer-electronics output in Asia Pacific | +2.10% | Asia Pacific core, spill-over to North America | Medium term (2-4 years) |
| EV power-train thermal-management needs | +1.80% | Global, with concentration in China, Europe, North America | Short term (≤ 2 years) |
| Rising use in high-value medical implants & devices | +1.40% | North America & EU, expanding to Asia Pacific | Long term (≥ 4 years) |
| Hydrogen-electrolyser stack components | +1.20% | Europe core, expanding globally | Long term (≥ 4 years) |
| In-space manufacturing & satellite hardware | +0.90% | North America & Europe, emerging in Asia Pacific | Long term (≥ 4 years) |
| Source: Mordor Intelligence | |||
Expanding Semiconductor & Consumer-Electronics Output in Asia Pacific
Fab build-outs across Taiwan, mainland China, Japan, and South Korea are resetting the demand baseline for aluminum nitride and silicon carbide substrates that can survive peak junction temperatures exceeding 1,000 °C while ensuring dielectric integrity. Chip designers pursuing gallium nitride architectures are widening thermal budgets faster than legacy metal lead-frames can handle, making ceramic packages an essential throughput enabler. Kyocera is funneling USD 470 million into a dedicated Japanese line to synchronize ceramic substrate availability with next-generation processor nodes. Synchronizing substrate growth cycles with lithography ramp-ups remains difficult because kilns require longer validation loops than semiconductor clean-rooms, but tier-one device makers are now signing multi-year offtake agreements to lock in supply. Regional governments are simultaneously underwriting advanced-materials clusters to reduce reliance on overseas feedstocks, a policy move that could compress lead times and moderate pricing volatility.
EV Power-Train Thermal-Management Needs
Global EV shipments surpassed 15 million units in 2024, and nearly every platform upgrade now targets 800 V electrical architectures that squeeze more power through smaller inverters. Silicon carbide power modules dissipate heat at triple the rate of silicon devices, yet the allowable junction temperature band remains tight, creating a design window ideally served by ceramic heat spreaders boasting greater than 200 W/mK conductivity. CeramTec’s chip-on-heatsink solution lowers thermal resistance while maintaining dielectric separation, a combination that lengthens module life in high-vibration automotive environments. Automakers are price-sensitive, but warranty liabilities linked to thermal failures tip purchasing decisions toward high-reliability ceramics despite higher unit costs. As fleet electrification accelerates in China, Europe, and the United States, demand for ceramic substrates, busbars, and gel-coated cooling plates is scaling in parallel.
Rising Use in High-Value Medical Implants & Devices
Orthopedic and dental surgeons are migrating toward zirconia and hydroxyapatite implants because these materials integrate with bone and resist infection better than metal alloys. Patient-specific 3D-printed lattices streamline operating-room fitment times and reduce revision surgeries. United States regulators cleared several trabecular ceramic spinal cages in 2024, a milestone that shortened the historical approval cycle and signaled growing FDA confidence in ceramic bio-compatibility. Margins in the medical device channel exceed those in volume automotive parts, encouraging producers to dedicate clean-room space and traceability protocols that satisfy stringent sterilization rules. These factors lock in established suppliers while tempering rapid capacity additions, meaning revenue growth stems from premium pricing rather than large tonnage.
Hydrogen-Electrolyzer Stack Components
Europe’s green-hydrogen roadmap calls for 134 GW of electrolyzer capacity by 2030, much of it favoring solid-oxide technology that operates near 800 °C. Such temperatures rule out metallic separators, elevating demand for ceramic interconnects that maintain ionic conductivity without warping under redox cycling. Topsoe has committed EUR 94 million to Europe’s largest SOEC plant, with initial stacks incorporating alumina-based gas diffusion layers. Scaling ceramic plates remains challenging because sintering furnaces become the bottleneck once stack assemblies exceed pilot volumes. Even so, hydrogen OEMs project tenfold demand by 2028, positioning ceramics as a secondary growth engine alongside semiconductors and EVs.
Restraints Impact Analysis of Technical Ceramics Market*
| Restraint | (~) % Impact on CAGR Forecast | Geographic Relevance | Impact Timeline |
|---|---|---|---|
| High capital & processing cost | -1.90% | Global, particularly acute in North America & Europe | Short term (≤ 2 years) |
| Intrinsic brittleness & machining losses | -1.30% | Global, with higher impact in precision applications | Medium term (2-4 years) |
| Critical-minerals supply-chain exposure | -1.10% | Global, with Asia Pacific dependencies | Long term (≥ 4 years) |
| Source: Mordor Intelligence | |||
Intrinsic Brittleness & Machining Losses
Hardness that delivers heat and wear resistance simultaneously increases fracture risk during post-sinter grinding. Yield losses of 20-30% inflate unit costs and lengthen lead times. Fiber-reinforced ceramic-matrix composites mitigate crack propagation but add layer-up and infiltration steps that offset durability gains with higher process complexity. Additive manufacturing offers near-net-shape alternatives, yet material palettes and throughput still lag conventional presses, limiting adoption outside prototyping.
Critical-Minerals Supply-Chain Exposure
Ceramic bodies often blend yttria, scandia, and other rare-earth oxides that are 80% processed in China. Any export curbs would ripple through global delivery schedules. The 2025 U.S. Geological Survey summary warned of intensifying competition for dysprosium and terbium used in high-temperature sintering aids[1]. Producers are testing substitute chemistries, but performance deltas persist, particularly in thermal conductivity. Larger firms are stockpiling feedstock, yet carrying costs tie up working capital and complicate inventory turns.
*Our forecasts treat driver/restraint impacts as directional, not additive. The impact forecasts reflect baseline growth, mix effects, and variable interactions.
Technical Ceramics Market Segment Analysis
By Product Type:
Monolithic Reliability versus Composite AgilityMonolithic ceramics retained 46.10% technical ceramics market share in 2025 due to mature press-and-sinter lines that deliver uniform quality at scale. The segment should still post mid-single-digit gains as industrial OEMs retrofit pumps, nozzles, and insulators with alumina bodies that outlast steel equivalents. Composite grades, however, will lift the overall technical ceramics market as their 8.84% CAGR attracts aerospace and defense budgets chasing weight savings above 30% alongside thermal ceilings beyond 1,500 °C. In 2026, the engine hot-section segment alone accounts for a USD 1.18 billion slice of the technical ceramics market size. Processing breakthroughs such as rapid forced-air sintering are collapsing densification steps from hours to minutes, trimming energy cost curves, and narrowing price spreads with monolithics. As these efficiencies propagate, composites are expected to erode monolithic share, but not displace them outright, because automotive and industrial plants still prize predictable shrinkage and low scrap rates.
The coatings niche serves as a transitional pathway: OEMs can spray zirconia or silicon carbide onto legacy metal parts, achieving incremental heat-flux gains without redesigning the entire assembly. This retrofit approach is popular in petrochemical burners and diesel particulate filters where shutdown budgets are tight. Ceramic fibers remain small in tonnage yet influential in insulation markets; aerogel-filled fiber quilts rated to 1,100 °C are seeing uptake in LNG ship cargo holds, another indicator that specialized performance credentials sustain premium pricing in smaller sub-segments.

By Material Class:
Oxide Dominance Faces a Non-Oxide ChallengeOxide families such as alumina, zirconia, and mullite delivered 62.80% of 2025 revenue owing to abundant raw material availability and well-documented process controls. These grades form the baseline for capacitor dielectrics and wear plates across multiple industries. Yet silicon carbide, silicon nitride, and emerging boron carbide non-oxide formulations are booking faster order growth because they combine lower density with thermal conductivities approaching copper. The non-oxide cohort is on a 7.76% trajectory through 2031, expanding the technical ceramics market by servicing frontier devices where oxide glass phases cannot survive. Cost barriers persist, but as fab line yields improve and reject rates fall below 5%, non-oxide price premiums are narrowing. Regulatory fuel-economy mandates and data-center heat-flux escalation both point to sustained long-run tailwinds for these higher-performance grades.
Composite or hybrid material classes merge oxide matrices with non-oxide whiskers or fibers, delivering synergistic toughness and conductivity. Interest is building in lanthanum-doped alumina blends that resist dielectric breakdown at elevated voltages, a property valued by grid-scale solid-state transformer projects. These cross-over formulations validate the thesis that future share battles will not be oxide versus non-oxide but hybrid versus single-phase, adding complexity yet widening solution space.
By End-User Industry:
Automotive Anchors, Electronics AcceleratesAutomotive OEMs represented 35.60% of 2025 revenue, leveraging bulk purchasing of substrates, sensors, and exhaust after-treatment carriers. Component count per battery-electric vehicle already exceeds 200 ceramic parts, including heaters, fuses, and pressure sensors. Volume scaling in China and Germany shores up this baseline and keeps unit costs competitive. Still, the electrical and electronics vertical will expand at 9.29% annually, lifting its slice of the technical ceramics market size. Semiconductor demand alone would exhaust planned capacity for aluminum nitride boards by 2027 if announced furnaces slip the schedule. Medical devices, though a smaller pocket, yield the highest EBITDA margins at more than 30% because biocompatibility and traceability place natural moats around approved product codes. Energy and power grids round out the portfolio with high-voltage insulator strings and hermetic seal rings for gas-insulated switchgear that must endure lightning impulse tests without flashover.
Aerospace and defense customers, historically dominant in research funding, are pivoting from radomes to turbine shrouds as next-generation propulsion concepts call for service temperatures beyond nickel superalloy limits. Even so, airframe procurement cycles hover near a decade, tempering the near-term volume impact. That said, the single-use defense segment is positioning ceramic armor plates to protect vehicles without weight penalties, bolstering composite throughput.
By Key Application:
Insulators Command, Wear Parts OutpaceInsulators and substrates formed 54.20% of applications revenue in 2025, driven by multi-layer ceramic capacitors and printed circuit boards in consumer electronics. Intense miniaturization trends translate into thinner dielectric layers, forcing tighter impurity control and favoring suppliers with high-purity kiln atmospheres. At the same time, industrial automation is elevating cycle rates, inflating abrasive wear on pumps and robots. Consequently, bearings and wear parts are projected to jump at 8.11% CAGR, underpinned by alumina sleeves and silicon carbide mechanical seals capable of lasting 50,000 hours between overhauls.
Thermal management modules remain the linchpin in EV, data-center, and renewable energy hardware, where failure often cascades into system downtime penalties. Ceramic-embedded heat pipes are replacing copper in some radar modules to halve weight while keeping transistor junctions below 125 °C. Meanwhile, bio-implants and dental abutments constitute a lucrative micro-segment where unit prices can exceed USD 4,000 per piece, more than 100 times the average electronic substrate, highlighting the profit diversity across the application spectrum.
Geography Analysis
APAC Technical Ceramics Market
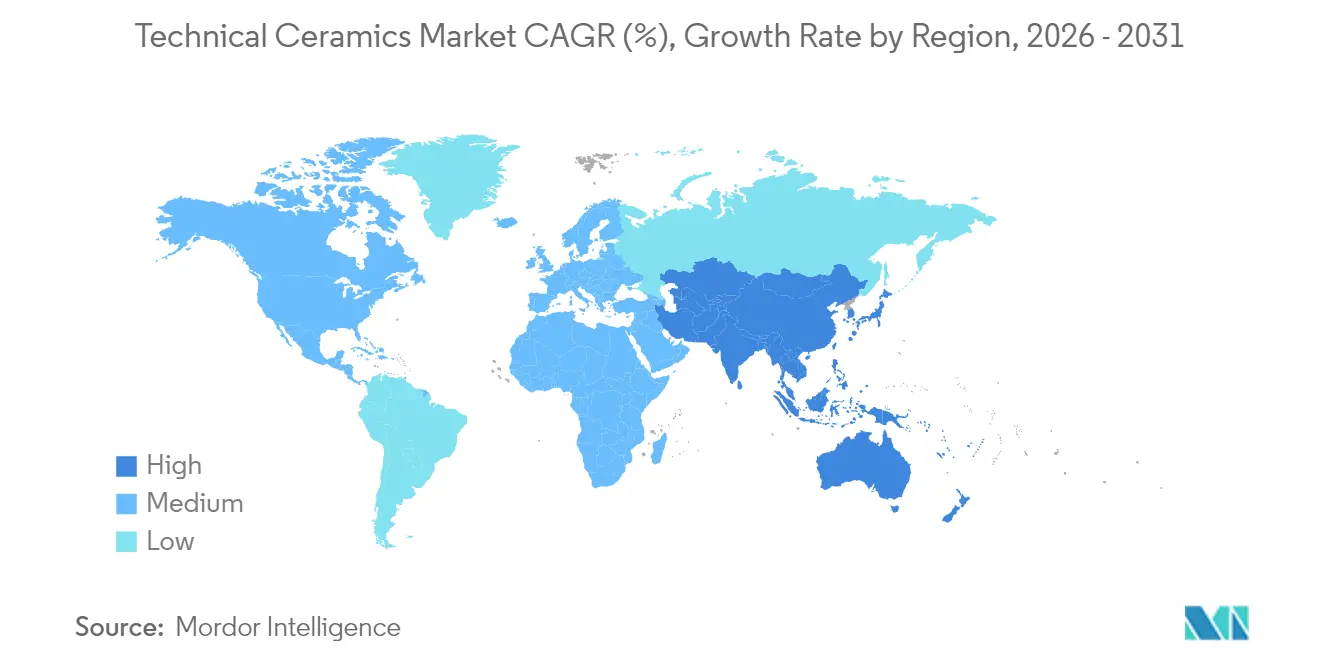
Asia Pacific dominated the technical ceramics market with 43.40% share in 2025 and is tracking a 7.84% CAGR to 2031. Mainland China hosts the majority of alumina powder calcination and offers cost arbitrage in labor-intensive finishing steps, yet rising electricity tariffs and environmental compliance fees are eroding the historic savings gap. Japan is repositioning toward ultra-clean, high-value substrates that align with national semiconductor revival incentives; Kyocera’s Nagasaki site will lift domestic fine-ceramic output by 10% upon its 2026 start-up. South Korea’s memory-chip epicenter drives demand for low-defect silicon nitride boards, while India is luring EV supply-chain investors with tax holidays in Gujarat and Tamil Nadu. Regional governments are also mapping recycling corridors to capture scrap zirconia and yttria, an initiative that may dilute raw-material import dependencies over the long term.
North America Technical Ceramics Market
North America is mature yet innovation-heavy, claiming nearly 30% of global R&D outlays tied to ceramic matrix composites. The United States accounts for the bulk of aerospace turbine and medical implant orders, justifying ISO-class kilns and USP Class VI clean-room protocols that less regulated regions bypass. Saint-Gobain’s USD 40 million catalyst-carrier plant in New York will add 100 jobs and shorten delivery cycles for East-Coast petro-refiners. Canadian mining houses supply bauxite and rare-earth concentrates, but still send most feedstock to Asian refineries. Mexico is emerging as an assembly hub for EV inverters, prompting substrate suppliers to weigh near-shoring steps that sidestep USMCA rules-of-origin tariffs.
Europe Technical Ceramics Market
Europe claims roughly one-fifth of global revenue and aligns commercial success with sustainability mandates. Germany’s machine-tool builders specify wear-resistant alumina guides that cut lubrication demand by 60%, dovetailing with EU eco-design standards. France and Spain are piloting hydrogen hubs that will soon require thousands of square meters of solid-oxide electrolyzer plates. The region’s REACH chemical-safety framework compels tight traceability, a compliance cost that props up incumbents but slows new venture launches. Post-Brexit United Kingdom policy leans toward advanced materials catapults, aiming to translate university lab breakthroughs into pilot lines within three years, yet significant scale will hinge on export markets, given limited domestic demand.
Value Chain Analysis
The technical ceramics value chain begins with critical raw materials and powders (alumina, zirconia, silicon nitride, silicon carbide, and rare-earth oxides used as sintering aids) and moves into high-value intermediate steps where performance is created, including powder conditioning and granulation, forming (pressing, injection molding, tape casting), debinding and sintering, and then precision grinding, lapping, metallization, and joining for electronic packages and assemblies. Value capture is concentrated in semiconductor-grade powders and substrates, along with post-sinter finishing, because tight impurity control and dimensional tolerances determine qualification outcomes in electronics, medical, and aerospace applications.
Downstream, qualified suppliers deliver components directly to OEMs (semiconductor equipment makers, automotive tier-1s, medical device firms, aerospace primes) or through specialized distributors and contract manufacturers that integrate ceramics into modules (power electronics, sensors, seals, and implant systems). Sintering and precision machining often become capacity and lead-time bottlenecks, which drives investment to add forming and machining capability closer to end markets (for example, Kyocera expanded fine-ceramics manufacturing in Hendersonville, North Carolina in April 2026, adding cold isostatic pressing and green machining). At the same time, recycling and circular feedstock initiatives are increasingly part of upstream responses, including Schunk Groups breaking ground in June 2026 on a silicon carbide recycling plant in Frechen, Germany that uses the RECOSiC process to reduce import dependence and improve supply security.
Competitive Landscape
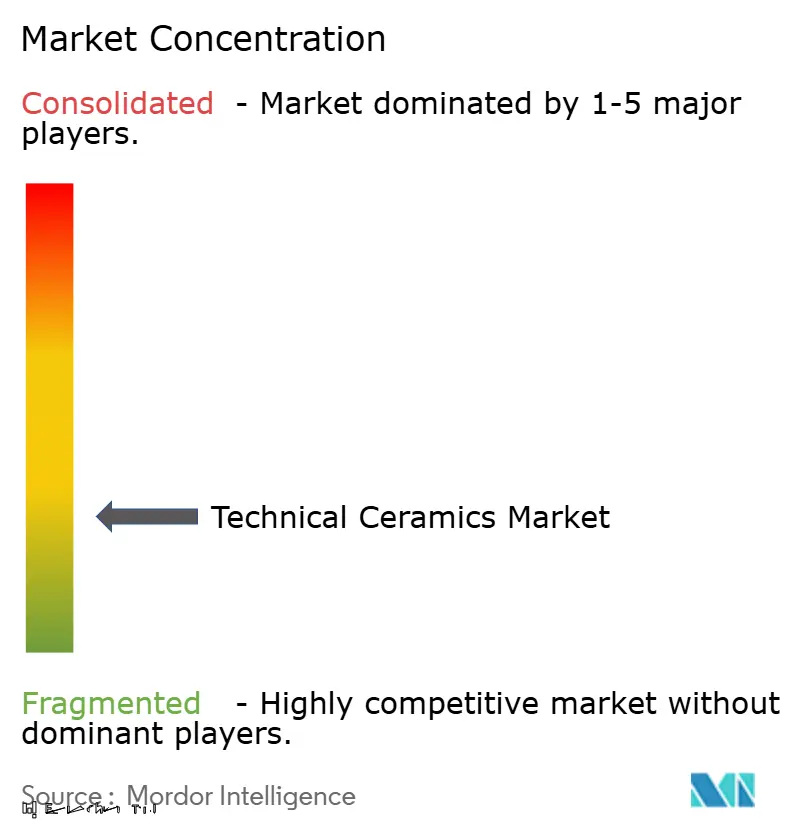
The industry’s technical barriers and protracted customer qualification cycles establish low competitive intensity. The top five suppliers hold roughly 28% combined revenue, underscoring fragmentation even as scale confers cost leverage. Kyocera, CeramTec, and Saint-Gobain field vertically integrated value chains spanning powder preparation through precision grinding, enabling rapid iteration of customer-specific compositions. Medium-tier players focus on narrow application lanes such as aerospace carbon-silicon-carbon composites or dental zirconia blanks, relying on intellectual-property portfolios and exclusive supply contracts to secure margins. Contract lengths often exceed five years in semiconductor and medical segments because design audits and regulatory filings are expensive and time-consuming.
Strategically, companies are tilting toward forward integration, embedding design-for-manufacture engineers within customer R&D teams to lock in early-stage specifications. Patent filings in flash sintering, additive manufacturing, and oxide-dispersion-strengthened composites rose 12% year over year in 2025, signaling above-average innovation momentum in processing technology. Mergers remain selective; large conglomerates prefer minority stakes in start-ups working on printable ceramic pastes rather than full acquisitions, minimizing integration risk while retaining optionality. Cost inflation in rare-earth feedstocks is also accelerating off-take agreements with mining companies, ensuring direct access to yttria and scandia flows outside Chinese jurisdiction.
Government policy is shaping competition as subsidies for domestic semiconductor supply chains now tie chip-fabrication grants to local substrate sourcing. This stipulation benefits Japan, the United States, and Germany, where established ceramic furnaces can meet purity benchmarks without months of cross-border shipping delays. Conversely, producers heavily exposed to commodity monolithics face margin compression as metal-based substitutes close the cost-performance gap in non-critical applications. Overall, the technical ceramics market rewards sustained R&D outlays and intimate customer partnerships over scale alone.
Technical Ceramics Industry Leaders
-
3M
-
CeramTec GmbH
-
CoorsTek Inc.
-
Kyocera Corporation
-
Saint-Gobain
- *Disclaimer: Major Players sorted in no particular order
Technical Ceramics Market Companies Covered in this Report
- 3M
- CeramTec GmbH
- CoorsTek Inc.
- Dyson Technical Ceramics
- Kyocera Corporation
- Mantec Technical Ceramics Ltd
- McDanel Advanced Ceramic Technologies
- Morgan Advanced Materials
- NGK SPARK PLUG CO., LTD.
- Ortech, inc.
- Rauschert GmbH
- Saint-Gobain
- Schott AG
- STC Material Solutions
Market Opportunities and Future Outlook
A clearer whitespace is emerging around localized, semiconductor-oriented ceramics supply chains, as customers increasingly look for shorter, qualified routes for high-purity parts and substrates. Capacity actions already point to this shift. Kyocera completed an expansion of its Fine Ceramics plant in Hendersonville, North Carolina in April 2026, while NGK Insulators announced in May 2026 an investment of about JPY 70 billion to establish a new site in Nomi City, Ishikawa Prefecture for ceramics used in semiconductor manufacturing, targeting mass production in October 2029. These projects create room for adjacent players in powder processing, precision machining, metallization, and inspection services that can meet semiconductor cleanliness and traceability requirements.
Process innovation is also widening use cases by reducing scrap, shortening iteration cycles, and enabling complex geometries that are hard to execute with conventional pressing and machining. Additive manufacturing is one lever already being used: Steinbach AG added Lithoz Cerafab S65 systems in January 2026 to expand capacity for sintered ceramic parts in response to higher order volume, supporting opportunities in rapid-turn prototyping to production for medical, electronics, and specialized industrial components. On supply risk and sustainability, circularity and recycling are moving from pilot concepts to industrial projects, including Schunk Groups' silicon carbide recycling initiative in Germany, which creates a pathway for qualifying recycled feedstocks in non-oxide ceramics and for service models that combine material recovery with assured property certification for end users managing critical-minerals exposure.
Recent Industry Developments in Technical Ceramics Market
- May 2026: NGK Insulators announced an approximately JPY 70 billion investment to establish a new production site in Nomi City, Ishikawa Prefecture for ceramics used in semiconductor manufacturing equipment, targeting a 20% capacity increase with mass production scheduled for October 2029. The project tightens long-horizon supply planning for susceptors and other high-spec components that sit on critical semiconductor equipment bottlenecks.
- February 2025: Saint-Gobain Ceramics announced plans to invest over USD 40 million in a new manufacturing facility in Wheatfield, New York to enhance ceramic catalyst carrier production, with completion targeted for 2028. The investment expands North American capacity for engineered ceramic components used in harsh chemical-processing environments and supports shorter delivery cycles for regional customers.
- August 2024: Kyocera initiated construction of a new production facility in Nagasaki, Japan, with an investment of around USD 469 million to expand capacity for fine ceramic components and semiconductor packages, with operations planned to begin in 2026. The facility adds upstream security for high-purity packaging and substrate-related outputs aligned to rising semiconductor manufacturing activity in Asia Pacific.
Technical Ceramics Market Report Scope and Research Methodology
Market Definition and Coverage
This market is defined as the revenue generated from engineered ceramic materials and components that are selected mainly for performance in demanding industrial and high-temperature uses, and then supplied as parts, coatings, or finished ceramic items.
Scope exclusions: Traditional clay-based construction ceramics, tableware, and decorative ceramics are excluded from this sizing.
Segments Covered in This Report
- By Product Type
- Monolithic Ceramics
- Ceramic Matrix Composites
- Ceramic Coatings
- Other Products
- By Material Class
- Oxide Ceramics
- Non-Oxide Ceramics
- Others
- By End-user Industry
- Electrical and Electronics
- Automotive
- Energy and Power
- Medical
- Aerospace and Defense
- Other End-user Industries
- By Key Application
- Insulators and Substrates
- Thermal Management Components
- Wear-resistant Parts and Bearings
- Bio-implants and Dental
- Armor and Protection
- By Geography
- Asia-Pacific
- China
- Japan
- India
- South Korea
- Rest of Asia-Pacific
- North America
- United States
- Canada
- Mexico
- Europe
- Germany
- United Kingdom
- France
- Italy
- Rest of Europe
- South America
- Brazil
- Argentina
- Rest of South America
- Middle East and Africa
- Saudi Arabia
- South Africa
- Rest of Middle East and Africa
- Asia-Pacific
Data Sources, Market Sizing, and Validation
Desk Research
Desk research was used to build the fact base on what drives technical ceramics demand and where it shows up in measurable activity. We relied on public sources such as USGS mineral and materials statistics, UN Comtrade trade flows for key ceramic raw materials and intermediate goods, and macro indicators from the World Bank and OECD. Patent databases were also reviewed to understand where materials innovation is appearing.
To keep the model aligned to the real supply chain, we reviewed company filings and investor presentations for capacity commentary, product mix, and end-market exposure. We also used trade association publications and credible industry press for adoption signals across electronics, automotive, medical, and energy applications. Select paid subscriptions were used in a limited way for company financials and news screening, and for patent searching when needed to reduce missed coverage. The desk research sources listed here are illustrative only, and many other public references were used for cross-checks and clarification.
Primary Interviews and Surveys
Primary work focused on confirming what is actually counted as technical ceramics revenue, and how pricing and mix are moving across key applications like insulators and substrates, thermal management components, wear parts, and bio-implants. We spoke with a mix of manufacturers, raw material and processing experts, and downstream buyers across APAC, EMEA, and the Americas, so assumptions from desk work could be corrected and then re-tested from multiple angles.
Distribution of primary research fieldwork respondents
| Company type | Respondent position | Region |
|---|---|---|
| Top tier: 30% | CXOs: 18% | APAC: 39% |
| Mid tier: 51% | Functional/Unit leaders: 32% | EMEA: 36% |
| Smaller Players: 19% | Managers: 50% | Americas: 25% |
Market-Sizing & Forecasting
Sizing was built using a top-down approach where end-use demand pools were reconstructed from measurable activity and then translated into value using application-level adoption and pricing logic. For technical ceramics, the demand build is anchored on indicators such as electronics and semiconductor output trends, automotive electrification and thermal management needs, medical procedure volumes for implants, and industrial production cycles that drive wear-part replacement.
Once the regional demand pools were formed, they were converted into market value using practical inputs, including oxide versus non-oxide mix shifts, the relative penetration of monolithic ceramics versus ceramic matrix composites, typical replacement rates for wear components, and average selling price movement by application (with inflation and energy-cost effects checked during interviews). The totals were then corroborated using selective bottom-up approximations, such as sampled supplier revenue exposure to in-scope products and channel checks on typical price bands. Where gaps remained, we applied conservative range assumptions and revalidated them through expert calls.
For forecasting, we used scenario analysis supported by a light multivariate regression check, so the model can reflect different paths for semiconductor capex, EV production, and industrial output while staying explainable and repeatable. Assumptions were locked only after the variable-level direction and sensitivity were agreed by multiple primary respondents, and then stress-tested for outlier growth spikes.
Data Validation & Update Cycle
Validation was done through triangulation across independent signals, so no single data series could distort the final total. Model outputs were checked against trade movement direction, and against capacity and utilization commentary found in public disclosures. We then compared application-level growth cues gathered from interviews, and reviewed variances until the drivers were understood.
Before sign-off, the full model goes through multi-step analyst reviews, where input assumptions, currency conversions, and year alignment checks are re-run to catch anomalies. If a key metric shifts materially or a respondent flags a mismatch, the team re-contacts sources to confirm whether it is a temporary effect or a structural change. Reports are refreshed annually, and interim updates are made when major events occur, followed by a final pre-delivery pass so the client view stays current.
Mordor Intelligence's Technical Ceramics Market Size Measured Against Other Published Estimates
Published numbers for technical ceramics often do not match because the scope can shift quietly, and that changes what is being counted as revenue. Differences also show up when one estimate leans on a single base year, or when pricing and mix changes are handled in a simplified way.
The main gap comes from whether adjacent ceramic categories are folded into the total, where Mordor Intelligence counts technical ceramics only when the revenue is tied to engineered applications like monolithic parts, ceramic matrix composites, or ceramic coatings used across automotive, electronics, energy, medical, and defense end uses.
Benchmark comparison
| Source | Market Size | Gaps in Research Methodology |
|---|---|---|
| Mordor Intelligence | USD 10.09 B (2026) | |
| Global Consultancy A | USD 8.66 B (2024) | Uses an earlier base year and a different forecast window, and the published summary does not clarify whether coatings and certain high-performance composite formulations are fully included in the counted revenue. |
| Industry Publisher B | USD 6.27 B (2024) | Reports a smaller starting value that likely reflects narrower capture of engineered ceramic components, and it can also differ based on how application pricing and material mix are carried forward into the forecast. |
The table shows that the spread is driven less by math and more by what each study treats as in-scope, plus how base-year timing and price-mix progression are handled. By keeping the counted revenue tied to defined technical applications and then cross-checking with demand indicators and interview feedback, the estimate stays easier to trace and repeat when the market shifts.
Key Questions Answered in the Report
How large is the technical ceramics market in 2026?
The technical ceramics market stands at USD 10.09 billion in 2026 and is projected to reach USD 14.54 billion by 2031, growing at a 7.58% CAGR.
Which segment holds the highest technical ceramics market share?
Monolithic ceramics lead with a 46.10% technical ceramics market share in 2025, thanks to established reliability and scale economies.
What is driving demand in the Asia Pacific region?
Rapid semiconductor fab expansion, surging EV production, and sustained consumer-electronics output underpin Asia Pacific’s 43.40% revenue share and 7.84% growth outlook.
Why are technical ceramics critical for electric vehicles?
Ceramic substrates and heat spreaders manage high thermal loads in 800 V power-train architectures, ensuring silicon carbide modules maintain safe junction temperatures and prolong vehicle life.
Which application is growing fastest through 2031?
Wear-resistant parts and bearings are expected to outpace other uses at an 8.11% CAGR as industrial automation raises component duty cycles and precision requirements.