
Taste Modulators Market Size and Share
Market Overview
| Study Period | 2021 - 2031 |
|---|---|
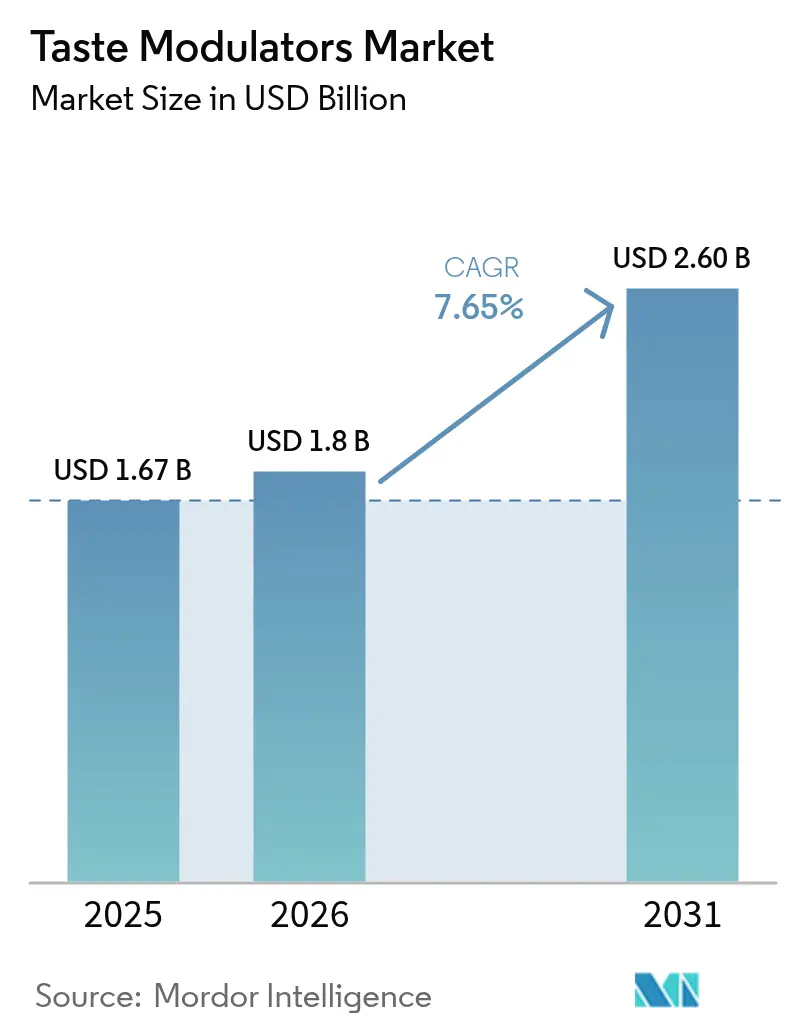
| Market Size (2026) | USD 1.8 Billion |
| Market Size (2031) | USD 2.6 Billion |
| Growth Rate (2026 - 2031) | 7.65 % |
| Fastest Growing Market | South America |
| Largest Market | Asia Pacific |
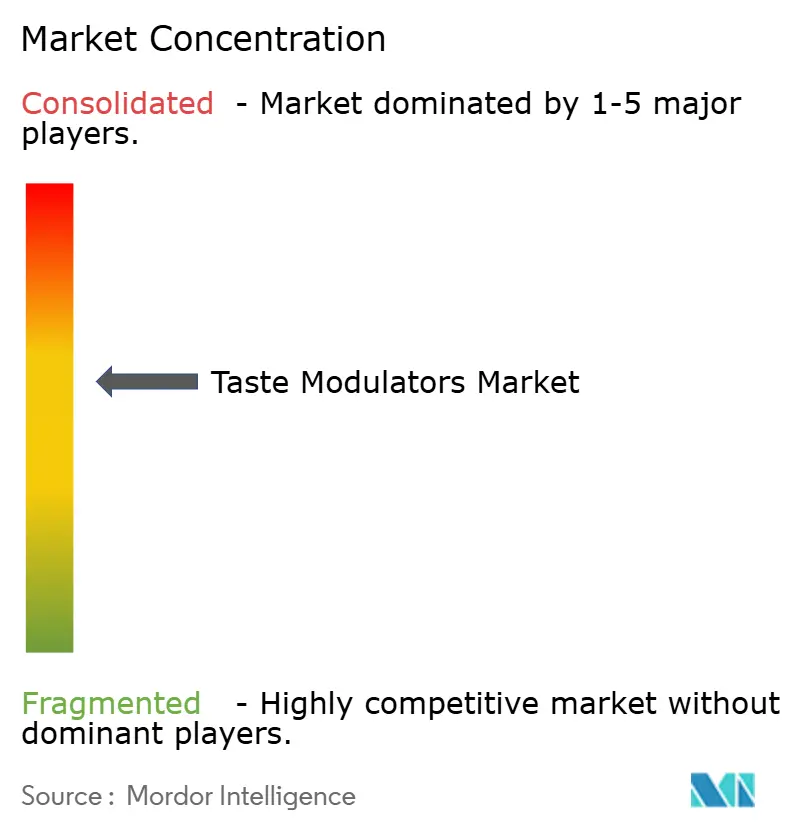
| Market Concentration | Medium |
Major Players *Disclaimer: Major Players sorted in no particular order Image © Mordor Intelligence. Reuse requires attribution under CC BY 4.0. | |
Taste Modulators Market Analysis by Mordor Intelligence
The taste modulators market size is expected to grow from USD 1.67 billion in 2025 to USD 1.8 billion in 2026 and is forecast to reach USD 2.6 billion by 2031 at 7.65% CAGR over 2026-2031. The market growth stems from manufacturers transitioning from basic sugar substitutes to sophisticated taste modification technologies. Taste modulators allow food manufacturers to control sweetness, saltiness, mouthfeel, and aroma while reducing calories and sodium content. Regulatory measures by the U.S. Food and Drug Administration (FDA) on added sugars and sodium, combined with the World Health Organization's (WHO) recommendation to limit free sugars below 10% of total energy intake, have accelerated product reformulation across food, beverage, and pharmaceutical industries. These factors have established taste modulators as crucial ingredients in contemporary product development. Additionally, the growing consumer demand for healthier and low-calorie food and beverage options has further fueled the adoption of taste modulators.
Key Report Takeaways
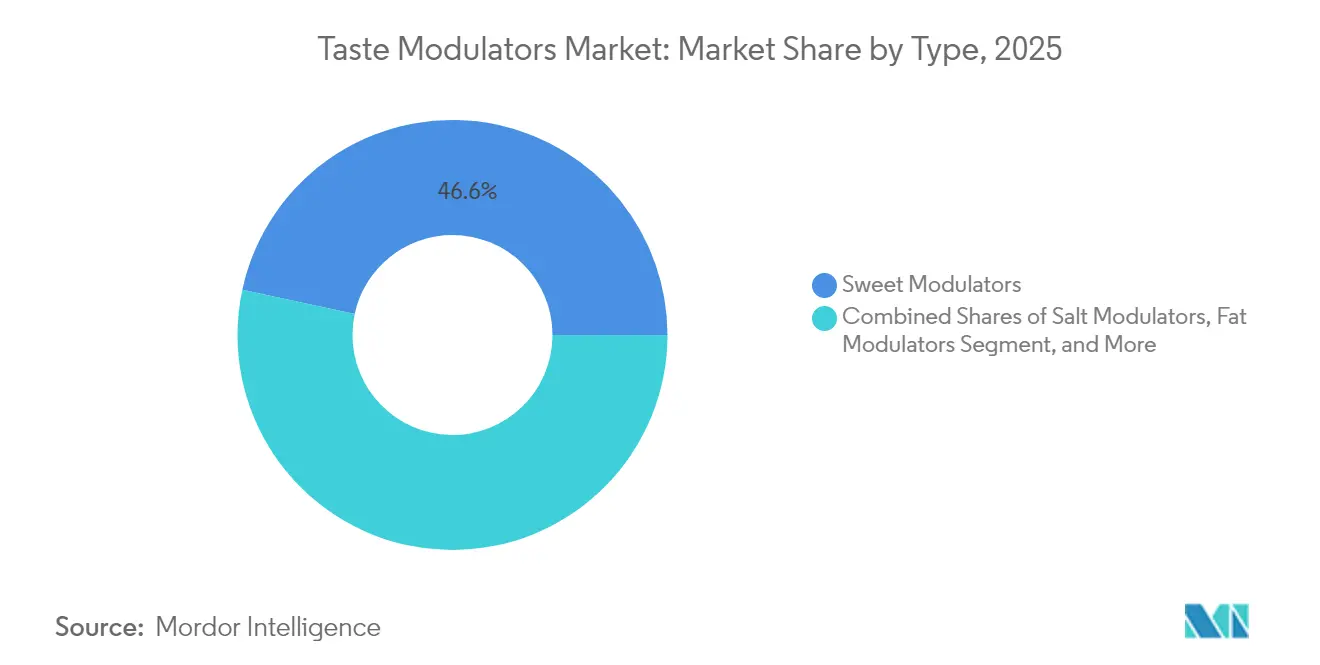
- By type, sweet modulators led with a 46.62% share of the taste modulators market in 2025; salt modulators are projected to expand at 9.32% CAGR through 2031.
- By source, natural ingredients captured 56.21% market share in 2025 and are expected to grow at a CAGR of 9.78% through 2031.
- By form, powders accounted for a 65.79% share of the taste modulators market in 2025, whereas liquids are set to record a 9.11% CAGR to 2031.
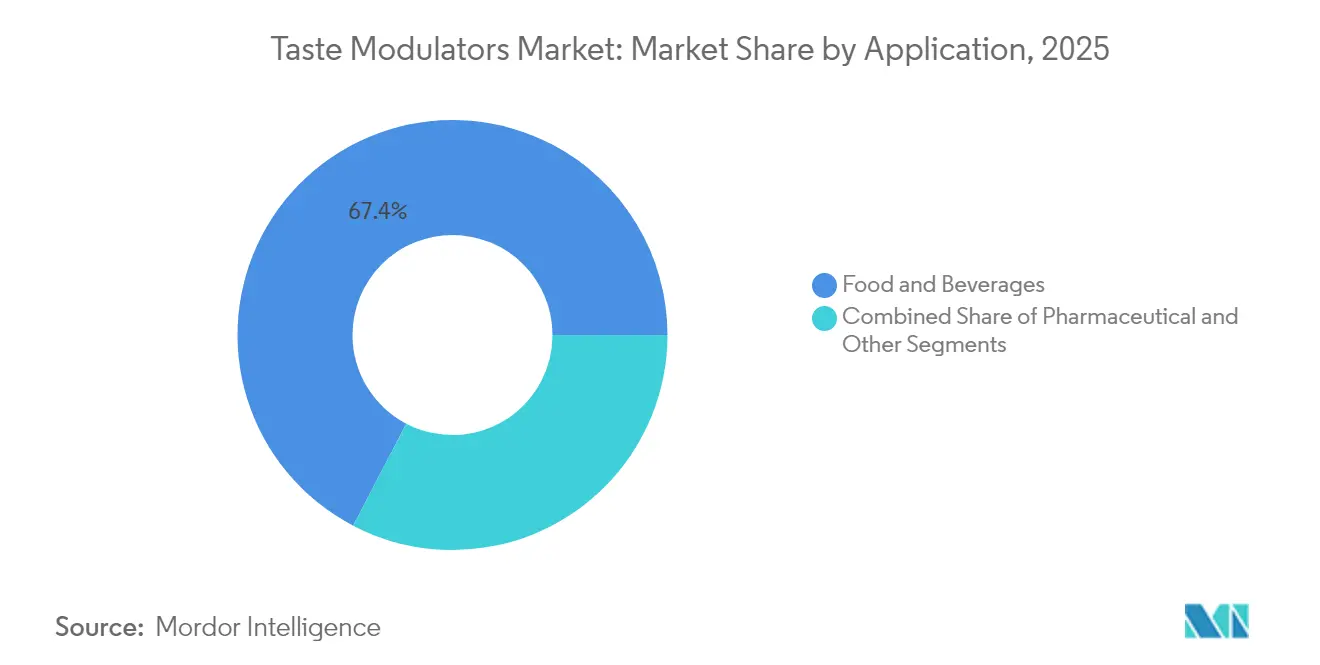
- By application, food and beverages generated a 67.35% share of the taste modulators market in 2025, yet pharmaceutical uses will post the quickest 9.02% CAGR over the period.
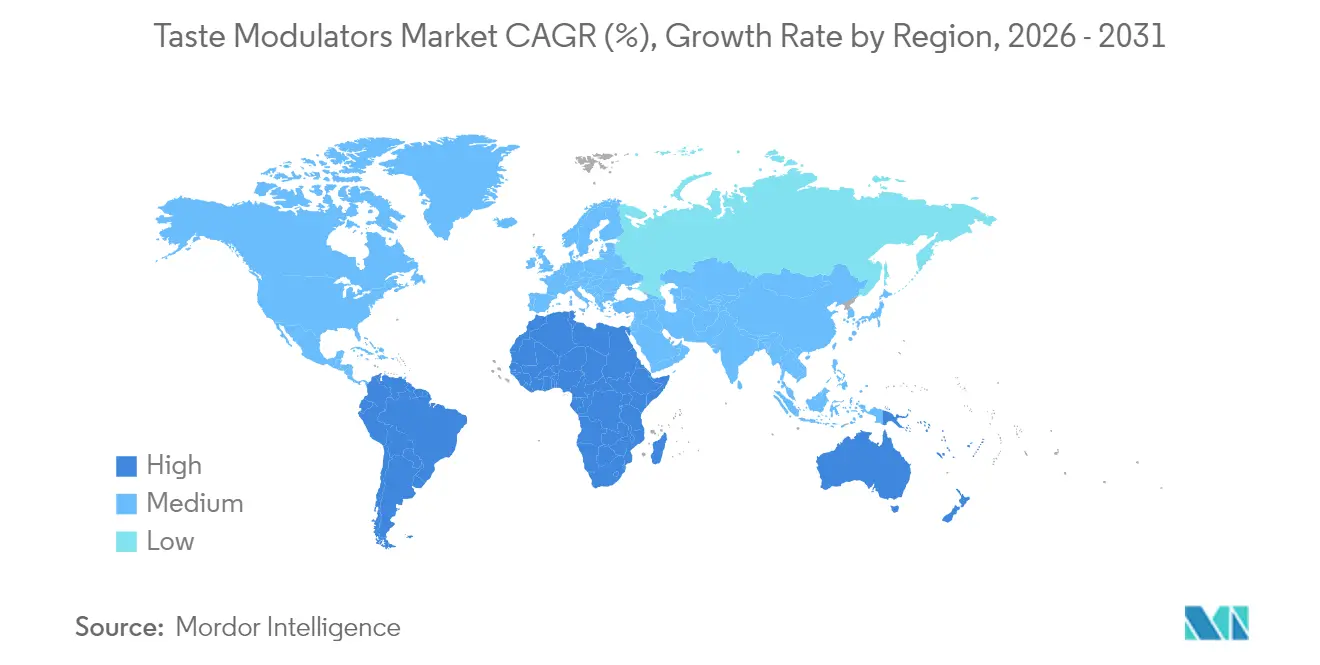
- By geography, Asia-Pacific commanded 34.52% share of the taste modulators market in 2025, and South America is poised for a 9.24% CAGR through 2031.
Note: Market size and forecast figures in this report are generated using Mordor Intelligence’s proprietary estimation framework, updated with the latest available data and insights as of 2026.
Market Trends and Insights
Drivers Impact Analysis of Taste Modulators Market*
| Driver | (~) % Impact on CAGR Forecast | Geographic Relevance | Impact Timeline |
|---|---|---|---|
| Increasing demand for sugar-reduced and low-calorie products | +1.8% | Global, with early adoption in North America and EU | Medium term (2-4 years) |
| Growing adoption in functional foods and sports nutrition | +1.2% | North America, Europe, Asia-Pacific urban centers | Long term (≥ 4 years) |
| Advancements in research and developments for natural taste modulators | +0.9% | Global, concentrated in innovation hubs | Long term (≥ 4 years) |
| Rising consumer preference for clean-label and healthier foods | +1.4% | North America, Europe, Australia | Medium term (2-4 years) |
| Expansion of personalized nutrition and functional ingredients | +0.7% | North America, select APAC markets | Long term (≥ 4 years) |
| Increasing use in plant-based and meat-alternative products | +1.1% | North America, Europe, emerging in Asia-Pacific | Medium term (2-4 years) |
| Source: Mordor Intelligence | |||
Increasing Demand for Sugar-Reduced and Low-Calorie Products
Regulatory changes in nutritional definitions, including the FDA's updated "healthy" criteria, are requiring brands to reduce added sugars while maintaining product taste and texture [1]. The growing adoption of glucagon-like peptide-1 weight-loss medications is increasing consumer demand for low-calorie indulgent products. In response, manufacturers are adopting sugar modulators that can substitute up to 100% of sucrose while maintaining essential properties like browning, viscosity, and shelf life. Kerry's Tastesense product line demonstrates effectiveness across beverages, bakery items, and dairy products, enabling premium pricing strategies. In developed markets, where sugar taxes and front-of-pack warning labels drive product reformulation, consumers show increased willingness to pay more for healthier alternatives.
Growing Adoption in Functional Foods and Sports Nutrition
The expanding market for protein-rich beverages and bars faces significant taste challenges, as protein ingredients inherently create bitter and astringent flavors that deter consumer acceptance. Companies like Firmenich have developed advanced flavor modulation technologies that effectively mask these undesirable taste elements while maintaining the products' nutritional integrity and caloric content. The substantial increase in high-protein beverage launches this decade demonstrates both market demand and the critical need to address these sensory barriers. Innovation in personalized nutrition, led by companies such as Panaceutics, has enabled precise taste customization at the batch level by combining individual genetic profiles with sophisticated modular flavor systems. This technological advancement, coupled with the growing overlap between sports nutrition and mainstream wellness markets, sustains the continuous demand for versatile taste modulation solutions that enhance product palatability.
Advances in Research and Developments for Natural Taste Modulators
Research advances in plant-derived and fermentation-based compounds are transforming food ingredient development. Cyclodextrins, enzymatically produced compounds, effectively address two key challenges in meat alternatives: they capture unwanted flavor compounds and enhance moisture retention [2]. These compounds maintain their stability during cooking processes and avoid classification as additives in numerous regulatory frameworks. The EU's approval of β-cyclodextrin (E 459) and its U.S. GRAS status marks a significant regulatory milestone, enabling broader commercial applications. Advanced extraction technologies have improved the bioavailability of steviol glycosides, while specialized fermentation processes now create targeted umami enhancers for plant protein applications.
Rising Consumer Preference for Clean-Label and Healthier Foods
Consumer demand for natural ingredients continues to rise, with shoppers examining ingredient lists and favoring brands that reduce synthetic components. The natural ingredients market growth is driven by transparency initiatives and environmental commitments. Natural raw materials present procurement challenges due to seasonal variations and quality fluctuations. In response, manufacturers invest in predictive agriculture and blockchain tracking systems to maintain consistent phytochemical profiles. Product success depends on matching synthetic formulation performance, with European consumers accepting minor taste variations while North American markets require identical taste profiles, compelling suppliers to enhance masking technologies.
Restraints Impact Analysis of Taste Modulators Market*
| Restraint | (~) % Impact on CAGR Forecast | Geographic Relevance | Impact Timeline |
|---|---|---|---|
| Challenges in developing effective taste modulators | -0.8% | Global, particularly in emerging markets | Medium term (2-4 years) |
| Regional variations in sensory preferences | -0.6% | Global, with highest impact in diverse markets | Long term (≥ 4 years) |
| Stringent regulatory approvals and labeling requirements | -1.1% | North America, Europe, Asia-Pacific developed markets | Short term (≤ 2 years) |
| Volatility in raw material supply for natural modulators | -0.9% | Global, concentrated in agricultural regions | Medium term (2-4 years) |
| Source: Mordor Intelligence | |||
Challenges in Developing Effective Taste Modulators
The development of multi-functional taste modulators requires understanding complex receptor interactions across sweet, salty, bitter, and umami pathways. In pharmaceutical applications, bitter-tasting active ingredients continue to affect patient compliance, especially among children, requiring comprehensive taste-masking and delivery solutions. While electronic tongue technology enhances measurement capabilities, it cannot accurately predict cultural taste preferences, which extends research and development timelines. The high costs of establishing pilot sensory laboratories create barriers for small companies, giving established firms with global research facilities and trained sensory panels a competitive advantage.
Stringent Regulatory Approvals and Labeling Requirements
Regulatory bodies require extensive safety documentation. The FDA's draft rule on GRAS notifications requires companies to submit public safety data, limiting previous self-affirmation pathways. In the European Union, Regulation (EC) No 1333/2008 requires proof of technological necessity for new additives, while China's GB 2760-2024 enforces a positive list system, extending the time-to-market. Natural compounds with multiple bioactive components present challenges in toxicological assessment and labeling. These regulatory timelines can impact product launch schedules, making early regulatory consultation and alignment of cross-regional documentation essential [3].
*Our forecasts treat driver/restraint impacts as directional, not additive. The impact forecasts reflect baseline growth, mix effects, and variable interactions.
Taste Modulators Market Segment Analysis
By Type:
Expanding Beyond SweetnessSweet modulators dominated the taste modulators market with a 46.62% share in 2025, as food manufacturers increasingly adopted sugar-reformulation initiatives to meet consumer demand for healthier products. The salt modulator segment is experiencing rapid growth at a 9.32% CAGR through 2031, driven by WHO guidelines limiting daily sodium intake to 2,000 mg and rising consumer awareness about the health risks associated with high salt consumption . The taste modulators market for salt solutions is expected to grow significantly as food processors in snacks, soups, and ready meals aim to reduce sodium content while maintaining flavor profiles.
Fat replacers and umami enhancers contribute to market growth through complementary functions. Bitter blockers are essential in functional beverages and pediatric medications, using encapsulation and receptor-antagonist technologies to neutralize bitter compounds. The approval of Advantame for both sweetening and flavor enhancement demonstrates regulatory acceptance of ingredients with multiple functions. The ongoing diversification within ingredient categories requires suppliers to maintain comprehensive portfolios covering sugar, salt, and bitter taste modification.

By Source:
Natural Ascendancy with Supply VigilanceNatural sources accounted for 56.21% share of the taste modulators market in 2025 and are expected to grow at a CAGR of 9.78% through 2031. Stevia varieties grown in Mediterranean regions demonstrate variations in genetic composition and harvest timing that affect steviol glycoside production. The market size for natural taste modulators depends on agricultural consistency and extraction efficiency at scale.
Synthetic modulators continue to play an essential role where predictable costs and consistent functionality are prioritized over clean-label requirements. The FDA evaluated 57 GRAS notifications in 2024, including D-psicose and the sweet protein brazzein, demonstrating continued synthetic development. Combined solutions that integrate natural flavoring compounds with synthetic carriers offer potential for balancing sensory effectiveness and label transparency.
By Application:
Food and Beverage Core, Pharma RisingFood and beverages accounted for 67.35% of the market share in 2025. In this segment, manufacturers of non-alcoholic beverages utilize high-intensity sweetener modulators to optimize acid-sugar ratios, while dairy producers implement modulators to reduce whey protein bitterness without increasing lactose content.
The pharmaceutical segment is experiencing the highest growth rate at 9.02% CAGR, driven by the importance of taste in medication adherence. Manufacturers incorporate modulators through hot-melt extrusion in pediatric acetaminophen suspensions to improve taste. In the nutraceutical segment, vitamin gummies combine fruit-flavored modulators to eliminate metallic aftertastes. The strong presence in both sectors provides market stability against volume fluctuations in individual segments.
By Form:
Powder Dominance Meets Liquid MomentumPowder formulations accounted for 65.79% market share in 2025 due to their ease of dispersion in dry mixes and efficient logistics. This format enables microencapsulation technology that protects volatile compounds and provides controlled release properties. The powder segment maintains steady growth in bakery, confectionery, and instant beverage applications.
The liquid segment is expected to grow at a 9.11% CAGR, driven by beverage innovations and syrup systems for coffee chains and quick-service restaurants. Liquid cyclodextrin complexes improve solubility and immediate mouthfeel in low-alcohol cocktails, while pharmaceutical syrups benefit from precise dosing capabilities. Manufacturers are investing in dual-form production lines, enabling customers to alternate between spray-dried powders and liquid concentrates without requiring reformulation.
Geography Analysis
APAC Taste Modulators Market
Asia-Pacific holds a 34.52% market share in the global taste modulators market. China's updated regulation GB 2760-2024 specifies permitted taste-enhancing additives, requiring local manufacturers to implement advanced modulators for regulatory compliance while meeting the demands of the expanding middle class. Japan maintains a structured list of approved additives, providing a clear framework for new modulator introductions. The market growth in India, Indonesia, and Vietnam is driven by increasing disposable incomes and health consciousness, although regional taste preferences necessitate specific flavor-masking solutions.
South America Taste Modulators Market
South America demonstrates the highest growth rate at 9.24% CAGR, driven by functional beverages that combine regional botanicals with taste modulators aligned to local preferences. Givaudan's South American operations growth in 2024, indicating significant market potential in Brazil and Colombia.
North America and Europe Taste Modulators Market
North America maintains a developed market where FDA sodium reduction guidelines encourage food manufacturers to implement salt-blocking modulators. Beverage manufacturers utilize natural sweetness modulators to reduce high-fructose corn syrup usage, while the sports nutrition segment implements bitterness blockers to support plant protein product development. Market growth continues as manufacturers respond to sugar taxation and mandatory added-sugar disclosure requirements.The European market exhibits stable growth, governed by EFSA regulations and consumer preference for natural ingredients. European manufacturers focus on modulators with established sustainability practices, particularly favoring fermentation-based umami enhancers.
Regulatory Landscape
Taste modulators often fall under multiple regulatory buckets globally, most commonly as food additives (subject to use-level permissions and specifications) or as flavorings with modifying properties. This classification affects dossier requirements, labeling, and the scope of permissible claims. In the United States, the FDA framework for food ingredients and the GRAS pathway continue to influence time-to-market for new modulators, while WHO guidance to keep free sugars below 10% of total energy intake supports many reformulation programs that depend on sweetness, bitterness, and salt modulation.
In the European Union, ingredient suppliers work through additive rules under Regulation (EC) No 1333/2008 and authorization procedures under Regulation (EC) No 1331/2008, alongside flavoring legislation (including Regulation (EC) No 1334/2008) when products are positioned as flavorings rather than additives. In January 2026, Commission Regulation (EU) 2026/196 updated specifications and usage-related requirements for several additives, with transition periods ending 18 August 2026, tightening compliance planning for multi-functional systems used in reformulation. Internationally, Codex Alimentarius actions such as the July 2026 49th session updates to the General Standard for Food Additives (GSFA), and JECFA evaluations (including its 100th meeting in June 2025) continue to feed into national positive lists and harmonization for traded finished foods containing modulators.
Value Chain Analysis
The taste modulators value chain starts with upstream feedstocks and actives, including botanical raw materials for natural modulators, fermentation-derived ingredients, and functional carriers and encapsulants that help deliver masking and modulation performance. These inputs then go through extraction, purification, and formulation steps such as spray drying and microencapsulation, followed by blending into powder or liquid systems. Quality control acts as a key gate, since small dosing errors or raw material variability can shift sensory outcomes and lead to batch rework. Bottlenecks can also emerge from limited capacity for some high-purity, food-grade functional carriers and from volatility in natural extract supply, which can extend lead times for customer reformulation projects.
In the midstream, global flavor and ingredient houses (including DSM-Firmenich, Givaudan, Kerry, and IFF) and specialized modulator developers translate actives into application-ready systems using sensory science, pilot labs, and customer co-development. In the downstream market, sales increasingly rely on direct technical collaboration with large food, beverage, and pharmaceutical manufacturers that run sugar, sodium, and bitterness reduction programs, while distributors remain important for smaller brands and regional coverage. Because regulatory classification (additive versus flavoring with modifying properties) determines where documentation, labeling, and the authorization and compliance burden sit across the chain, early alignment between suppliers, brand owners, and regulatory teams can materially affect commercialization speed.
Competitive Landscape
The taste modulators market demonstrates moderate consolidation, with industry leaders Givaudan, IFF, and Kerry Group leveraging extensive proprietary sensory databases and global application laboratories. These capabilities enable them to develop customized solutions through collaborative innovation with customers, addressing specific taste challenges across food and beverage applications.
Mid-sized specialized companies drive technological advancement in targeted segments. Firmenich advances the development of receptor-targeted bitter blockers through molecular research, while Sensient capitalizes on its advanced botanical extraction expertise to produce natural taste modulators that meet clean-label demands. Large ingredient manufacturers Cargill and ADM utilize their robust integrated supply chains to maintain consistent supply of critical raw materials like stevia and monk-fruit, effectively managing agricultural volatility and ensuring supply security.
Research and development investments prioritize artificial intelligence-assisted formulation systems that analyze and predict complex flavor interactions, significantly reducing product development cycles. Strategic collaborations with biotechnology companies accelerate the development of fermentation-based taste modulators, particularly for replicating authentic animal-protein flavors in plant-based alternatives. The competitive landscape effectively balances operational scale advantages with rapid innovation capabilities, creating opportunities for new market entrants to solve specific sensory challenges through targeted technological solutions.
Taste Modulators Industry Leaders
-
Cargill Inc.
-
DSM-Firmenich
-
International Flavors and Fragrances Inc.
-
Archer Daniels Midland Company
-
Kerry Group plc.
- *Disclaimer: Major Players sorted in no particular order
Taste Modulators Market Companies Covered in this Report
- Cargill Inc.
- DSM-Firmenich
- International Flavors and Fragrances Inc.
- Archer Daniels Midland Company
- Givaudan SA
- Kerry Group plc.
- Sensient Technologies Corporation
- Ingredion
- Synergy Flavors Inc.
- Takasago International Corporation
- Mane SA
- Flavorchem Corporation
- The Flavor Factory
- Tate & Lyle PLC
- Ajinomoto Co., Inc.
- Blue California
- Axiom Foods Inc.
- HealthTech Bio Actives S.L.U.
- Carbery Group
- GLG Life Tech Corporation
Market Opportunities and Future Outlook
Reformulation programs aimed at sugar and sodium reduction keep creating room for modulators that preserve taste and mouthfeel while supporting clean-label requirements, particularly in segments where natural ingredients already hold a majority share (56.21% in 2025). A clear signal of near-term commercialization focus is investment in capacity and capabilities by major ingredient players: ADM announced a USD 26 million investment (January 2026) to expand reformulation capabilities and digital process automation at its Erlanger, Kentucky flavors facility, and Givaudan inaugurated a new production facility in Cikarang, Indonesia (January 2026) for savory, sweet, and snack flavor powders. Together, these steps support faster local response for powders, the largest form segment (65.79% share in 2025), and for high-throughput customer reformulation cycles.
Regulatory milestones also create opportunity pockets for suppliers with stronger dossiers and application support. The European Commission decision to add naringenin to the EU Food Flavoring Regulation (June 2025), following a multi-year process, highlights the commercial value of approved natural taste-modifying substances and the need for longer-cycle regulatory planning. At the same time, pharmaceutical taste masking remains one of the fastest-expanding use cases in the market, with modulators increasingly engineered around bitter-receptor and compliance-driven palatability requirements. Suppliers that can provide validated performance data, scalable formats (powder and liquid), and documentation that can travel across regions have an advantage in these deployments.
Recent Industry Developments in Taste Modulators Market
- July 2026: MycoTechnology and Adorvia Biotechnology announced a global commercial collaboration combining MycoTechnology's Zukora Honey Truffle Sweet Protein with Adorvia's Reb M stevia to support natural sugar reduction and taste modulation. The pairing targets formulation strategies where sweetness intensity, temporal profile, and off-notes must be balanced without relying on conventional sugar. The collaboration also underscores how fermentation and biotech-linked ingredient platforms are being positioned as integrated modulation toolkits rather than standalone additives.
- April 2026: dsm-firmenich introduced next-generation Vertis textured vegetable proteins with integrated ModulaSENSE taste modulation technology to address plant protein off-notes and improve sensory performance in meat alternatives. By embedding modulation directly into a core protein ingredient, the launch simplifies downstream formulation and can reduce the need for separate masking systems. This supports broader adoption of modulators in plant-based applications where bitterness and astringency are key barriers.
- July 2024: HealthTech Bio Actives (HTBA) introduced a high-purity natural sweetness modifier at the IFT FIRST annual meeting in Chicago. The launch added another option for manufacturers seeking sugar reduction while keeping taste performance aligned with clean-label preferences. It also highlighted continued innovation activity among specialist suppliers alongside larger flavor houses.
Taste Modulators Market Report Scope and Research Methodology
Market Definition and Coverage
For this study, the taste modulators market covers ingredient solutions that change how sweetness, saltiness, bitterness, fat sensation, or umami is perceived in finished products, and it is measured as the value of these ingredients sold across key end uses and regions.
Scope exclusions: Bulk nutritive sweeteners, generic flavor enhancers that do not work through taste modulation, and table-top sweetener sachets are excluded.
Segments Covered in This Report
- By Type
- Sweet Modulators
- Salt Modulators
- Fat Modulators
- Umami Enhancers
- Bitter Blockers
- By Source
- Natural
- Synthetic
- By Form
- Powder
- Liquid
- By Application
- Food and Beverages
- Bakery and Confectionery
- Dairy Products
- Snacks and Savory
- Meat and Poultry
- Beverages
- Other Food Products
- Pharmaceutical
- Other Applications
- Food and Beverages
- By Geography
- North America
- United States
- Canada
- Mexico
- Rest of North America
- Europe
- United Kingdom
- Germany
- Spain
- France
- Italy
- Russia
- Rest of Europe
- Asia-Pacific
- China
- India
- Japan
- Australia
- Rest of Asia-Pacific
- South America
- Brazil
- Argentina
- Rest of South America
- Middle East and Africa
- Saudi Arabia
- South Africa
- Rest of Middle East and Africa
- North America
Data Sources, Market Sizing, and Validation
Desk Research
Desk work starts by mapping the demand and supply context for taste modulators, then narrowing it to what is actually counted as a modulator ingredient. We typically pull public references such as food additive and ingredient standards from sources like the US FDA, the European Commission (including relevant food additive rules), and Codex Alimentarius, which helps keep the scope consistent across regions.
For market signals, we also review trade and production indicators from sources such as UN Comtrade, national customs and statistics offices, and relevant industry association publications on food and beverage formulation trends. We use company filings, annual reports, investor presentations, and reputable press to cross-check where ingredient demand is moving, and we use a paid subscription for company financials and intelligence selectively to normalize reported revenue lines when ingredient portfolios are mixed. This list is illustrative, and other sources are used as needed for data collection, validation, and clarification.
Primary Interviews and Surveys
Primary input is used to confirm what gets counted as a taste modulator, and to pressure-test assumptions that cannot be read directly from public sources, such as typical usage rates by application and how pricing moves by region. We talk with ingredient suppliers, formulators, distributors, and downstream users across major consumption hubs so the sizing assumptions reflect real buying behavior, not only published statements.
Distribution of primary research fieldwork respondents
| Company type | Respondent position | Region |
|---|---|---|
| Top tier: 34% | CXOs: 14% | APAC: 45% |
| Mid tier: 46% | Functional/Unit leaders: 42% | EMEA: 31% |
| Smaller Players: 20% | Managers: 44% | Americas: 24% |
Market-Sizing & Forecasting
Our core model uses a top-down demand pool approach, where processed food and beverage output, reformulation activity, and category adoption signals are translated into an addressable need for taste modulation ingredients, and then converted into value using region-appropriate pricing. To keep this grounded, the totals are cross-correlated with selective bottom-up approximations, including sampled supplier revenue mapping, distributor channel checks, and volume times ASP sanity checks for key applications.
Inputs that commonly move the model include sugar and sodium reduction targets in packaged foods, the pace of clean-label reformulation (natural versus synthetic choices), application mix shifts between beverages and bakery or snacks, typical dosage ranges by modulator type, and observed price dispersion by region and form (powder versus liquid). Forecasts are built using scenario analysis, with growth rates tied to expected reformulation cycles, regulatory direction, and expert consensus on adoption speed, and then smoothed to avoid one-year spikes that do not match real procurement patterns. Where the bottom-up checkpoint has gaps, we fill them using conservative proxy ranges and then re-test the outcome with interview feedback before finalizing the series.
Data Validation & Update Cycle
Validation is done in layers so the final number is not dependent on one source type. Analysts compare outputs against independent signals such as application-level growth in packaged foods, trade movement for relevant ingredient classes, and the implied revenue pool that sampled suppliers can realistically serve. Any large variance is investigated before sign-off.
A second analyst review is completed to re-check definitions, currency handling, and key assumptions, and respondents are re-contacted when new information conflicts with earlier inputs. Reports are refreshed annually, and interim updates are made when material events occur, such as major regulatory shifts or step changes in formulation behavior. Before delivery, a fresh review pass is completed so clients receive the latest updated view.
Mordor Intelligence's Taste Modulators Market Size Versus Other Published Estimates
Published market sizes for taste modulators can differ even when they sound similar, because the boundary of what counts as a modulator ingredient is not always consistent and the timing of pricing and currency conversion also changes the final value.
Evidence like the 2025 to 2026 step-up shown on the category curve, plus cross-checks on which applications are actively reformulating for sugar or sodium reduction, is what keeps Mordor Intelligence aligned to a defined modulator-only scope rather than a broader flavor enhancer basket.
Benchmark comparison
| Source | Market Size | Gaps in Research Methodology |
|---|---|---|
| Mordor Intelligence | USD 1.80 B (2026) | |
| Global Research Publisher A | USD 1.45 B (2023) | Uses an earlier base year and blends in broader functionality language (taste, texture, and preservation), which can shift what is counted, and it may not fully separate modulators from adjacent ingredient classes across regions. |
| Industry Research Firm B | USD 1.55 B (2024) | Anchors the series on a 2024 base year and includes wide segment groupings by channel and end use, which can change the effective scope and the implied ASP progression used to reach the total. |
The comparison shows that year selection and scope boundaries explain much of the spread, and then pricing and currency timing add smaller differences. By keeping the modulator definition tight and re-checking adoption and pricing assumptions through direct market feedback, the final estimate stays traceable to clear variables and repeatable steps.
Key Questions Answered in the Report
What is the current size of the taste modulators market?
The taste modulators market is valued at USD 1.8 billion in 2026 and is projected to hit USD 2.6 billion by 2031.
Which region holds the largest share of the taste modulators market?
Asia-Pacific leads with 34.52% share due to stringent Chinese and Japanese additive standards and growing middle-class demand.
Which application segment is growing the fastest?
Pharmaceutical taste masking is forecast to grow at 9.02% CAGR between 2026-2031 as patient adherence becomes a top priority.
What role do natural ingredients play in this market?
Natural sources account for 56.21% share and are expanding at 9.78% CAGR, but they require resilient supply chains to handle crop variability and traceability demands.