
Target Acquisition Systems Market Size and Share
Market Overview
| Study Period | 2020 - 2031 |
|---|---|
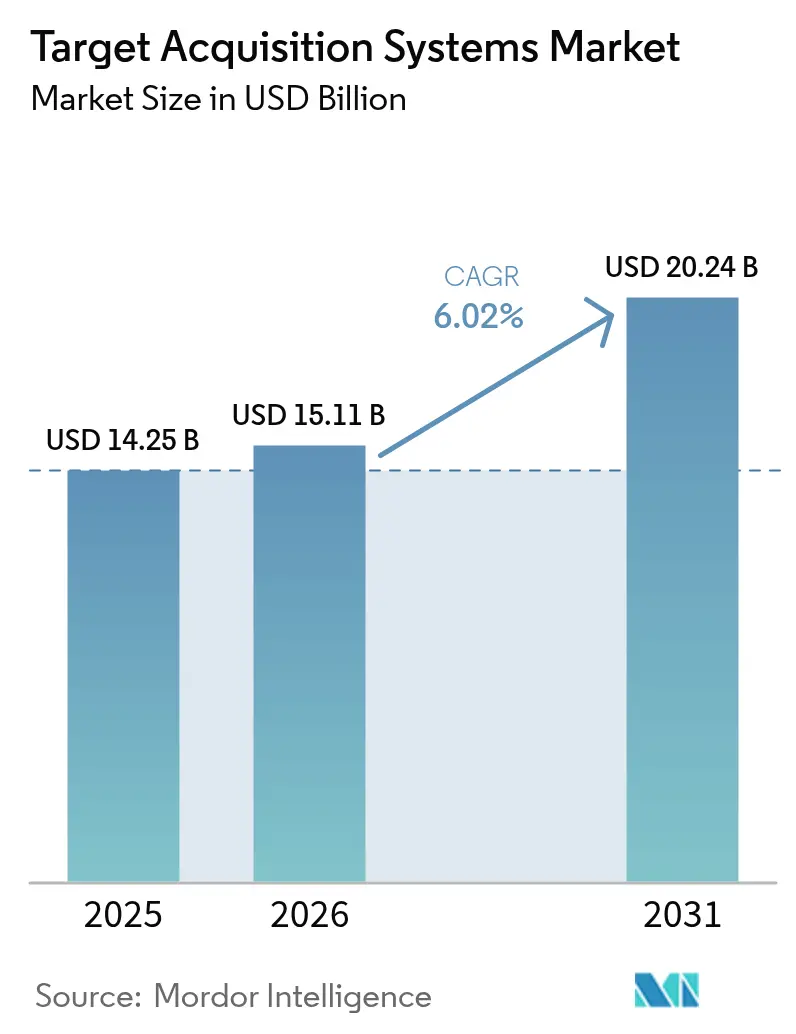
| Market Size (2026) | USD 15.11 Billion |
| Market Size (2031) | USD 20.24 Billion |
| Growth Rate (2026 - 2031) | 6.02 % |
| Fastest Growing Market | Asia Pacific |
| Largest Market | North America |
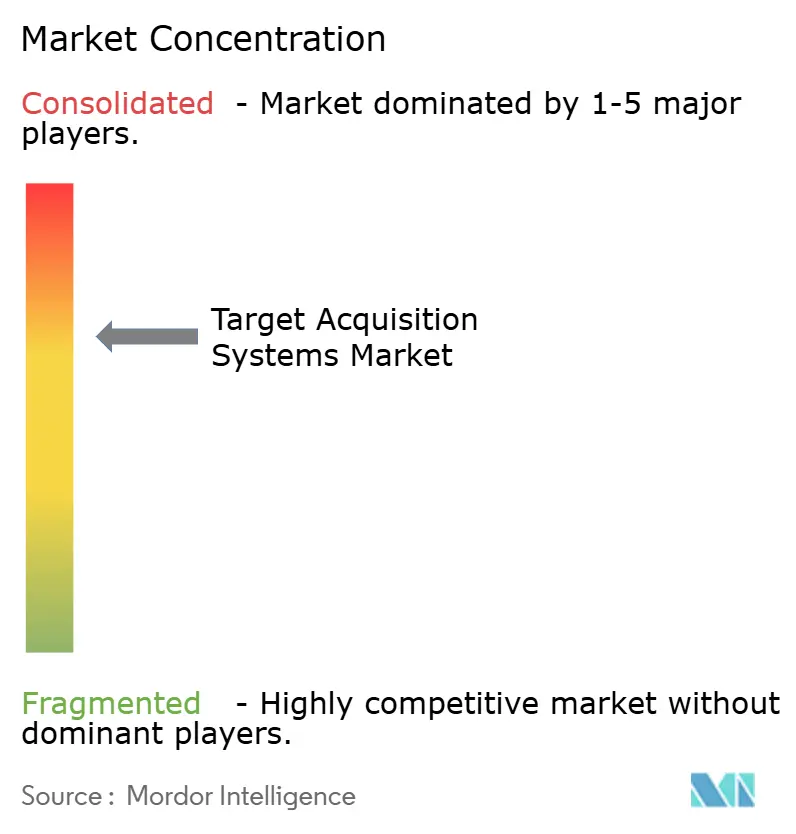
| Market Concentration | Medium |
Major Players *Disclaimer: Major Players sorted in no particular order Image © Mordor Intelligence. Reuse requires attribution under CC BY 4.0. | |
Target Acquisition Systems Market Analysis by Mordor Intelligence
The target acquisition systems market size in 2026 is estimated at USD 15.11 billion, growing from 2025 value of USD 14.25 billion with 2031 projections showing USD 20.24 billion, growing at 6.02% CAGR over 2026-2031. Heightened geopolitical tensions and the spread of unmanned aerial threats have pushed governments to accelerate force-modernization programs, especially those aimed at network-centric operations. NATO members have pledged to keep annual defense outlays above the 2% of GDP threshold, ensuring a dependable funding stream for new detection, tracking, and fire-control technologies. Land platforms hold the widest installed base, yet airborne systems are growing fastest as armies demand persistent, multi-domain surveillance. Electro-optical/infrared (EO/IR) sensors retain the largest share, although rapid adoption of AI-enabled multi-sensor fusion suites is reshaping competitive dynamics. Thanks to major US programs, North America remains the biggest regional spender, while Asia-Pacific leads growth because of record budgets in China, Japan, and India.
Key Report Takeaways
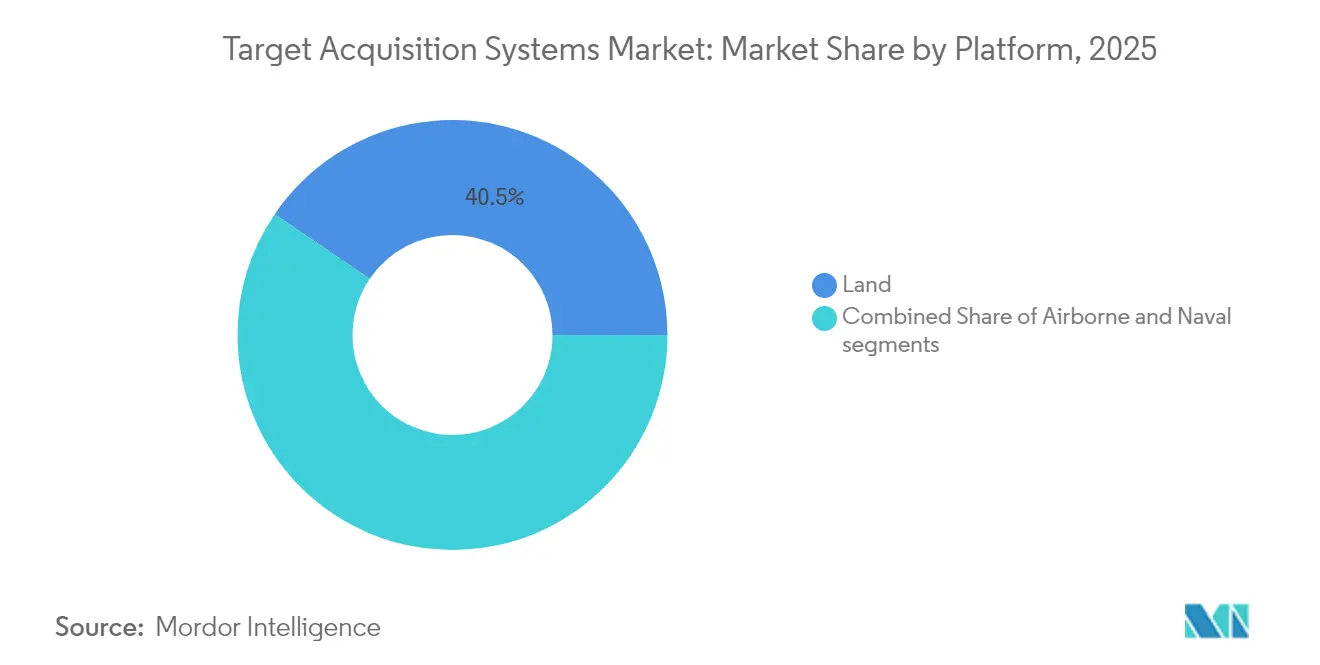
- By platform, land systems led with 40.50% of the target acquisition systems market share in 2025; airborne systems are projected to post the quickest 8.07% CAGR through 2031.
- By sensor type, EO/IR products accounted for a 41.57% revenue share in 2025, whereas multi-sensor fusion suites are expected to grow at a 7.18% CAGR over the same period.
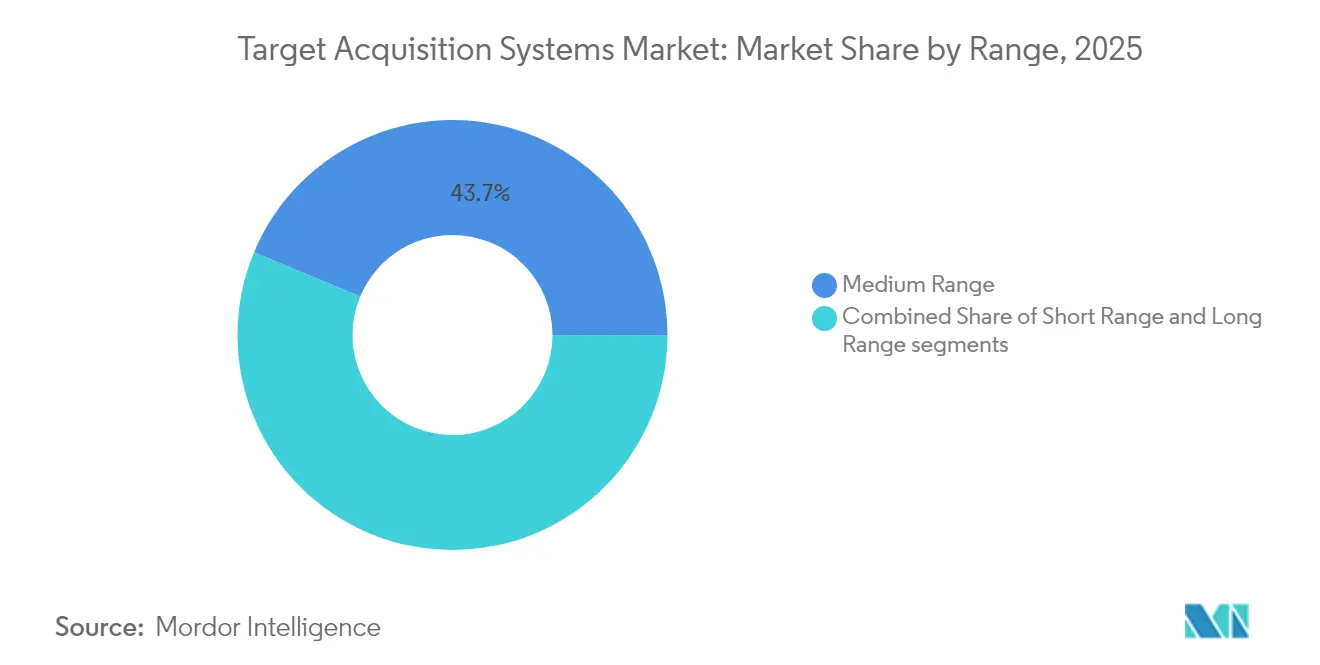
- By range capability, medium-range solutions captured 43.71% of the target acquisition systems market size in 2025, yet long-range systems are forecasted to expand at 7.88% CAGR to 2031.
- By end user, the military segment dominated with 90.90% share of the target acquisition systems market size in 2025, while homeland security demand is advancing at a 6.17% CAGR.
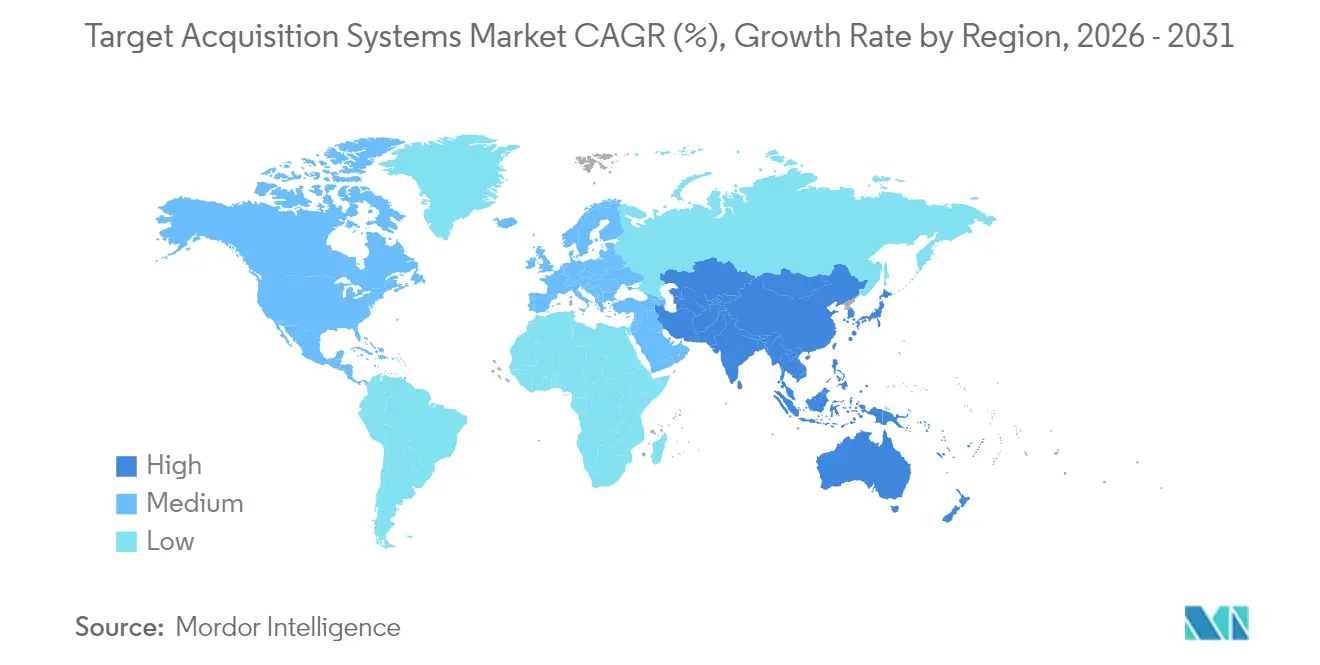
- By geography, North America commanded 34.12% of 2025 revenue, and Asia-Pacific is poised to register a 7.70% CAGR through 2031.
Note: Market size and forecast figures in this report are generated using Mordor Intelligence’s proprietary estimation framework, updated with the latest available data and insights as of 2026.
Market Trends and Insights
Drivers Impact Analysis of Target Acquisition Systems Market*
| Driver | (~) % Impact on CAGR Forecast | Geographic Relevance | Impact Timeline |
|---|---|---|---|
| Modernization of land forces to support network-centric warfare capabilities | +1.2% | Global, emphasis on NATO and Asia-Pacific | Medium term (2-4 years) |
| Urgent defense requirements for rapid counter-UAS detection and tracking solutions | +0.8% | Middle East, Eastern Europe, Indo-Pacific | Short term (≤ 2 years) |
| Adoption of AI-driven sensor fusion for autonomous threat recognition and cueing | +0.7% | North America, Europe, selected Asia-Pacific | Medium term (2-4 years) |
| Advancements in EO/IR sensor miniaturization enabling dismounted soldier integration | +0.9% | Early adoption in United States, Israel, Europe | Short term (≤ 2 years) |
| Increased dual-use technology funding for ISR payloads through NATO DIANA initiatives | +1.1% | Europe, North America | Long term (≥ 4 years) |
| Rising demand for border surveillance and tactical situational awareness in asymmetric zones | +0.6% | Conflict-prone regions worldwide | Medium term (2-4 years) |
| Source: Mordor Intelligence | |||
Modernization of land forces to support network-centric warfare capabilities
Network-centric doctrine now guides every upgrade plan, compelling armed forces to link previously standalone sensors with digital command networks. The US Army’s Autonomous Multi-Domain Launcher demonstrations underline this shift, showing how target acquisition nodes must feed distributed fire-control chains in seconds. European programs mirror the trend: Germany digitizes Puma infantry vehicles with HENSOLDT vision suites so crews can share sensor feeds across battle groups. Retrofit packages are complex because legacy hardware often runs on analog backbones that need secure, low-latency gateways. Operational lessons from recent conflicts confirm that real-time data fusion delivers decisive tactical advantages, accelerating adoption cycles even inside traditionally slow procurement cultures.
Urgent defense requirements for rapid counter-UAS detection and tracking solutions
Commercial drones have exposed gaps in classical air-defense layers, prompting militaries to purchase counter-UAS kits under streamlined contracting rules. Systems such as Teledyne FLIR’s Cerberus XL blend radar, EO/IR, and RF detection to follow quadcopters and fixed-wing UAS at standoff ranges in cluttered airspace.[1] The US Army awarded contracts worth over USD 400 million for such solutions in 2024 alone. Algorithms must separate hobby drones from hostile platforms while surviving electronic-warfare noise, which drives heavy investment in AI-based signal classification and sensor fusion. Acoustic arrays and passive RF analyzers increasingly complement radar to cut false-alarm rates in urban terrain.
Adoption of AI-driven sensor fusion for autonomous threat recognition and cueing
Artificial intelligence now underpins the newest generation of targeting electronics. Safran’s Advanced Cognitive Engine uses operational data to boost classification accuracy as environments evolve.[2] Fusing radar, optical, and acoustic inputs inside edge processors delivers recognition speeds unattainable by single-sensor streams. Yet autonomy introduces cyber and spoofing risks, prompting DARPA’s SABER project to stress-test AI models against adversarial attacks. Program managers, therefore, pair autonomy with human-on-the-loop oversight and spend heavily on curated training data to avoid algorithmic bias.
Advancements in EO/IR sensor miniaturization enabling dismounted soldier integration
Thermal imagers, once confined to vehicles, now fit rifle-mounted housings. Leonardo DRS weapon sights shrink sensors without compromising range or durability, enabling foot soldiers to acquire and designate threats on the move. Gains stem from silicon-photonics wafers, lighter optics, and low-power focal-plane arrays. These hand-held devices mesh with soldier-worn radios so squads can relay target coordinates directly to higher-level shooters. Small-unit lethality rises, as does the complexity of managing permissions for precision fires in congested areas.
Restraints Impact Analysis of Target Acquisition Systems Market*
| Restraint | (~) % Impact on CAGR Forecast | Geographic Relevance | Impact Timeline |
|---|---|---|---|
| Prolonged defense procurement timelines and shifting budgetary priorities delay system adoption | −0.9% | Global, most acute in bureaucratic systems | Long term (≥ 4 years) |
| Regulatory challenges in spectrum allocation constrain active radar integration | −0.7% | Varies by national spectrum policy | Medium term (2-4 years) |
| Bottlenecks in sourcing III-V semiconductor focal-plane arrays impact production scalability | −0.5% | Global supply chain, few foundries | Short term (≤ 2 years) |
| Increased vulnerability of digital targeting systems to cyber and electronic-warfare threats | −0.4% | Contested environments worldwide | Medium term (2-4 years) |
| Source: Mordor Intelligence | |||
Prolonged defense procurement timelines and shifting budgetary priorities delay system adoption
The US Government Accountability Office notes that even marquee programs like hypersonic weapons lack formal acquisition baselines, complicating industry investment cases. Political turnovers redirect funds mid-cycle, forcing prime contractors to stretch milestones or accept scope cuts. Multinational projects face extra layers of review, since every partner must align export-licensing terms before production can start. When timelines exceed commercial technology refresh rates, systems risk entering service with obsolescent electronics, eroding lifecycle value.
Regulatory challenges in spectrum allocation constrain active radar integration
Military radars compete with 5G, Wi-Fi, and satellite Internet for clean spectrum, especially in the S-band, where propagation suits ground-based and airborne surveillance. The US Department of Defense estimates relocation costs above USD 100 billion should commercial users displace existing allocations. Similar pressures surface worldwide, slowing approvals for new radars and pushing designers toward expensive interference-mitigation hardware. Shared-band operations also raise electromagnetic-compatibility testing overheads during export campaigns.
*Our forecasts treat driver/restraint impacts as directional, not additive. The impact forecasts reflect baseline growth, mix effects, and variable interactions.
Target Acquisition Systems Market Segment Analysis
By Platform:
Airborne Systems Drive InnovationLand platforms dominated 40.50% of 2025 revenue, yet airborne assets post the strongest 8.07% CAGR to 2031 as forces seek continuous overwatch across contested zones. Therefore, the target acquisition systems market is transitioning from single-domain emphasis to integrated asset portfolios that pair ground radar with high-altitude imaging. Armored fighting vehicles remain the biggest land sub-segment, propelled by Germany’s Leopard 2 ARC 3.0 retrofit that fuses counter-drone sensors and anti-tank sights.
The USD 13 million United States orders for SMASH 2000L fire-control sights show the rapid uptake of soldier-portable kits that let infantry neutralize micro-drones. On the airborne side, Lockheed Martin’s IRST21 reached Initial Operational Capability on F/A-18s in early 2025, underscoring naval aviation’s appetite for passive long-range detection. Unmanned aircraft also accelerate demand; General Atomics is integrating EagleEye radar into the Gray Eagle 25M, advancing endurance surveillance at the brigade level.

By Sensor Type:
Multi-Sensor Fusion Gains MomentumEO/IR devices held a 41.57% share in 2025 because they work day or night and resist jamming. Still, fusion suites grow at a 7.18% CAGR as militaries connect radar, optical, laser, and acoustic channels in one processor. That evolution pushes the target acquisition systems market toward software-centric architectures that update via code rather than hardware swaps. GhostEye AESA radar exemplifies radar progress, leveraging gallium-nitride power amps for sharper resolution.
Laser rangefinders remain indispensable; in 2024, Safran won a USD 275 million US Army sustainment contract, ensuring field units can still designate platoon-level precision munitions. HENSOLDT’s CERETRON software platform processes streams from disparate sensors, proving that real-time fusion lifts the probability of correct identification under heavy clutter.
By Range Capability:
Long-Range Systems AccelerateMedium-range products held a 43.71% share in 2025 because most ground engagements unfold within 15 km. Long-range solutions, however, recorded the quickest 7.88% CAGR as anti-access strategies demand standoff strikes. Hypersonic research budgets like the US Navy’s USD 308.3 million contract with Draper for Conventional Prompt Strike guidance amplify calls for seekers able to cue warheads traveling at Mach 5+.
Short-range sensors keep relevance in point defense. India’s USD 3.6 billion Quick Reaction Surface-to-Air Missile buy shows that mobile battalions still need organic sensors to intercept incoming rockets and low-flying drones. The layered defense doctrine blends every range band, creating overlapping pockets of coverage that complicate opponent planning.
By End User:
Homeland Security Applications ExpandMilitary agencies consumed 90.90% of spending in 2025, but homeland security users will post a 6.17% CAGR as governments harden borders and critical sites. US DHS trials integrate radar, thermal cameras, and unattended ground sensors to monitor remote terrain for illicit crossings. Police forces adopt lightweight counter-drone gear to protect stadium events and energy plants, blurring the military-civil divide and enlarging the target acquisition systems industry's addressable base.
Export-control reviews shape foreign-sales timelines, yet many governments greenlight dual-use EO/IR kits because they resemble commercial security cameras. Firms, therefore, tailor offerings along a continuum: ruggedized, ITAR-free models for civil use and classified variants for frontline troops.
Geography Analysis
North America Target Acquisition Systems Market
North America commands 34.12% of 2025 turnover due to the United States’ unmatched R&D ecosystem and procurement heft. Pentagon programs such as the USD 6.9 billion hypersonic portfolio drive continuous requirements for guidance computers, inertial navigation units, and multi-physics sensor heads. Canada’s focus on Arctic sovereignty leads to sensor packages built to survive snow, ice, and magnetic anomalies, evidenced by Rheinmetall Mission Master CXT testing. Mexican border surveillance must add small but steady orders, mainly for EO/IR towers and portable acoustic detectors.
APAC Target Acquisition Systems Market
Asia-Pacific records the highest trajectory at 7.70% CAGR. China’s USD 314 billion budget overshadows peers, yet the market remains inward-looking. Japan’s 21% uplift to USD 55.3 billion funds interceptor radars and distributed EO nodes for island defense. India advances indigenous design, signing a USD 3.6 billion quick-reaction missile contract and placing follow-on orders for tube-artillery sights valued at USD 850 million. Australia and South Korea collaborate on maritime-patrol sensor kits, opening export lanes to Southeast Asia.
Europe Target Acquisition Systems Market
Europe retains a sizeable share rooted in cooperative ventures. The European Sky Shield program pools orders across states to field layered air defenses around shared architectures. Germany’s EUR 200 million (USD 234.43 million) frigate-radar contract underscores cross-border teaming between HENSOLDT and Israel Aerospace Industries. NATO DIANA’s EUR 1.1 billion (USD 1.29 billion) fund accelerates dual-use ISR payloads that can migrate from commercial drones to armored vehicles. Eastern European nations step up buys of counter-UAS radar-optical hybrids in response to nearby conflicts, tightening delivery schedules for suppliers.
Regulatory Landscape
Target acquisition systems sit at the intersection of defense export control and increasingly prescriptive defense supply-chain rules. In the United States, EO/IR and thermal imaging payloads commonly fall under ITAR (USML) or the Export Administration Regulations depending on performance thresholds, creating program-specific licensing, re-export, and technical-data constraints for primes and subsystem suppliers. Enforcement actions also shape compliance behavior; in February 2026, the US Bureau of Industry and Security issued a final order involving Teledyne FLIR LLC tied to Export Administration Regulations violations related to thermal imaging camera exports.
Supply-chain regulation has become a direct design and sourcing variable for optics, detectors, electronics, and software-enabled subsystems. The FY2026 NDAA, signed December 18, 2025, included requirements to decouple Department of Defense optical and infrared supply chains from covered nations by January 1, 2030. This pushes contractors toward documented traceability for optical glass, infrared materials, and optical systems. In parallel, DFARS and 10 U.S.C. Section 4873-related obligations around printed circuit boards, reinforced by 2026 rulemaking activity, increase the burden of origin mapping, supplier certifications, and recordkeeping across the lifecycle of networked sensor suites.
Value Chain Analysis
The value chain spans specialty materials through system-of-systems integration. Upstream inputs include infrared detector materials and focal-plane arrays (for example HgCdTe and InSb), optical elements, and RF components. Midstream steps include sensor-module packaging, gimbal and stabilization assemblies, embedded compute/AI hardware, and ruggedized electronics and connectors. Downstream value concentrates in multi-sensor integration (EO/IR, radar, laser rangefinding/designation, acoustic/RF), mission software and fusion middleware, platform qualification (air/land/naval), and long-term sustainment and upgrades tied to classified configurations and cybersecurity hardening.
Bottlenecks cluster where materials and production are concentrated. Epitaxy/substrates for IR detectors and III-V supply lines can limit scaling, while seeker and guidance-related electronics can be among the most supply-constrained items in adjacent munitions and tracking supply chains. Compliance-driven sourcing is reshaping procurement flows, with NDAA Section 834-related requirements accelerating a US rebuild for optical components. It also elevates the importance of a fully qualified, NDAA-compliant bill of materials, not just performance specs. On the demand signal side, US Army modernization pulls the chain toward networked, open-architecture sensors, including efforts such as FALCONS to replace legacy long-range reconnaissance and targeting systems with netted-fires capable solutions.
Competitive Landscape
The target acquisition systems market shows moderate consolidation. Top defense primes retain the edge by controlling integration know-how, classified supply chains, and sustainment networks. Lockheed Martin Corporation illustrates this strength: its IRST21 achieved operational status on F/A-18s while the company concurrently ran autonomous HIMARS tests and secured USD 857 million in launcher-related awards in 2024. HENSOLDT exploits software-defined CERETRON middleware to ship sensor suites that update via code, cutting life-cycle cost for navies and armies.
White-space entrants attack niches such as neuromorphic chips or quantum-enhanced sensing, promising step-changes once reliability hurdles fall. Collaboration between Raytheon Technologies (RTX Corporation) and Kongsberg Gruppen on GhostEye radar for NASAMS shows incumbents partnering to accelerate AESA roadmaps. Patent filings cluster around AI-based fusion and compressed neural-network weights, indicating that future differentiation may tilt toward algorithms rather than glass and gallium-nitride arrays.
Export-controlled intellectual property remains a competitive lever. Firms that re-package core code in ITAR-free formats gain access to wider audiences. Meanwhile, local offsets and tech-transfer demands, such as India’s K9 Vajra co-production, push primes to share blueprints with national champions or risk exclusion.
Target Acquisition Systems Industry Leaders
-
Lockheed Martin Corporation
-
RTX Corporation
-
Safran SA
-
Leonardo S.p.A
-
Elbit Systems Ltd.
- *Disclaimer: Major Players sorted in no particular order
Target Acquisition Systems Market Companies Covered in this Report
- ASELSAN A.Ş.
- BAE Systems plc
- Elbit Systems Ltd.
- HENSOLDT AG
- Israel Aerospace Industries Ltd.
- Leonardo S.p.A
- Lockheed Martin Corporation
- RTX Corporation
- Rheinmetall AG
- Safran SA
- Thales Group
- Northrop Grumman
- L3Harris Technologies, Inc.
- Teledyne Technologies Incorporated
- Hanwha System (Hanwha Group)
- Bharat Electronics Ltd.
Market Opportunities and Future Outlook
Near-term whitespace is expanding around software-defined targeting, open architectures, and modular payloads that move across platforms without complete redesign. April 2026 upgrades to Teledyne FLIR OEM Prism SKR for automatic target recognition highlight procurement pull for deployable algorithm improvements in loitering munitions and autonomous weapon systems. Separately, Raytheon (RTX) flight testing of the air-cooled RAIVEN staring EO/IR suite on a UH-60 in April 2026 points to demand for reduced-SWaP sensors that can be fielded across rotary-wing and other airborne fleets. New payload introductions also reinforce this direction: Redwire introduced the Octopus E180 HD MWIR in June 2026 with high-definition MWIR imaging for UAS-class applications.
Opportunities also track the shift from point sensors to layered, networked kill chains spanning air defense, counter-UAS, and long-range surveillance. Large US awards and programs are creating durable integration and sustainment backlogs that favor suppliers who can support production ramp and long-term support, such as Lockheed Martin’s June 2026 THAAD interceptor procurement award and the July 2026 Sentinel A4 radar award extending through 2031. Both tighten requirements for reliable detection, tracking, and fire-control data paths. Outside the United States, serial production moves such as ASELSAN’s TOYGUN electro-optical targeting system and KARAT IRST entering serial production in May 2026 show an active push to widen passive detection and precision targeting capacity for next-generation aerial platforms. This creates openings for subsystem suppliers that can meet traceability and export-control constraints.
Recent Industry Developments in Target Acquisition Systems Market
- July 2026: Lockheed Martin received a USD 502.38 million US Army hybrid contract for post-production support of the Modernized Target Acquisition Designation Sight/Pilot Night Vision Sensor (M-TADS/PNVS) for AH-64 Apache helicopters, running through July 2031. The award reinforces the importance of sustainment capacity and upgrade pathways for widely fielded EO/IR targeting suites, not only new-build deliveries. Long-duration support contracts also influence supplier qualification for optics, detector modules, and mission-software refresh cycles.
- June 2026: Safran launched Land OmniGuard, an integrated counter-drone solution combining VAMPIR NG, PASEO, and GEONYX technologies to support target identification, tracking, and neutralization. The system packaging underscores the market shift toward integrated sensor-and-effect chains that shorten sensor-to-shooter timelines against small UAS. It also raises the competitive bar for fusion software, threat libraries, and modular integration with existing command networks.
- July 2024: Lockheed Martin introduced the Sniper Networked Targeting Pod concept, positioning the pod as a network node to link F-35s, 4th generation aircraft, and missile systems. The concept highlights the transition from stand-alone targeting pods to connected sensing that shares targeting data across platforms and domains. Such networking emphasis increases demand for secure data links, interoperability, and software-defined upgrades within airborne target acquisition suites.
Target Acquisition Systems Market Report Scope and Research Methodology
Market Definition and Coverage
This market covers the revenue generated from target acquisition systems used to detect, identify, track, and hand off targets for defense and security missions, across land, airborne, and naval platforms, and including key sensor suites and related system-level integration.
Scope exclusions: We exclude weapons, ammunition, and standalone command-and-control networks unless they are priced and delivered as part of a target acquisition system line item.
Segments Covered in This Report
- By Platform
- Land
- Armored Fighting Vehicles (AFVs)
- Soldier Portable/Infantry Systems
- Artillery and Missile Launcher Integrated
- Airborne
- Fixed-Wing Aircraft
- Rotary-Wing Aircraft
- Unmanned Aerial Vehicles (UAVs)
- Naval
- Surface Combatants
- Submarines
- Unmanned Surface/Underwater Vehicles
- Land
- By Sensor Type
- Electro-Optical/Infrared (EO/IR)
- Radar
- Laser Rangefinders and Designators
- Acoustic and Seismic
- Multi-Sensor Fusion Suites
- By Range Capability
- Short
- Medium
- Long
- By End User
- Military
- Army
- Air Force
- Navy
- Special Operations Forces
- Homeland Security
- Military
- By Geography
- North America
- United States
- Canada
- Mexico
- Europe
- Germany
- United Kingdom
- France
- Russia
- Rest of Europe
- Asia-Pacific
- China
- India
- Japan
- South Korea
- Rest of Asia-Pacific
- South America
- Brazil
- Rest of South America
- Middle East and Africa
- Middle East
- Saudi Arabia
- United Arab Emirates
- Rest of Middle East
- Africa
- South Africa
- Rest of Africa
- Middle East
- North America
Data Sources, Market Sizing, and Validation
Desk Research
Desk research starts by mapping the defense procurement cycle and the typical content of a target acquisition system (sensor package, processing, stabilization, and integration). We rely on public sources such as defense budget documents and procurement justifications, SIPRI defense spending series, UN Comtrade trade statistics for relevant optics and sensor categories, and U.S. government contract award releases, which helps validate demand direction by region.
To avoid building a model on headlines alone, we also use sources such as defense ministry modernization plans, parliamentary and GAO-style audit notes, technical journals and conference papers on EO/IR and radar sensing, and company annual reports and investor presentations for program exposure. Where needed, analyst access to paid company financials and news databases, patent databases, and global contracts and tenders databases is used to confirm timelines, delivery cadence, and pricing logic at a sanity-check level. The sources mentioned above are illustrative, and many other public and paid references were used for data collection, validation, and clarification during the study.
Primary Interviews and Surveys
Primary discussions are used to stress-test what desk sources cannot fully show, especially system configuration boundaries, typical upgrade cycles, and how bundled contracts split between sensors, integration, and sustainment. We speak with a mix of OEM-side experts, subsystem suppliers, integrators, and defense users across APAC, EMEA, and the Americas so assumptions can be corrected before final numbers are signed off.
Distribution of primary research fieldwork respondents
| Company type | Respondent position | Region |
|---|---|---|
| Top tier: 26% | CXOs: 20% | APAC: 41% |
| Mid tier: 54% | Functional/Unit leaders: 24% | EMEA: 32% |
| Smaller Players: 20% | Managers: 56% | Americas: 27% |
Market-Sizing & Forecasting
Sizing is built using both top-down and bottom-up logic, with the top-down view anchored on defense procurement and platform fleet priorities, and then converted into a demand pool for target acquisition fits and upgrades. Since we cannot observe every contract in a uniform way, totals are corroborated using selective bottom-up approximations such as sampled program awards, supplier exposure checks, and ASP times volume constructs for common configurations.
Key model inputs include defense spending and modernization signals, platform fleet size and upgrade cadence (land vehicles, aircraft, and naval assets), EO/IR and radar sensor adoption trends, typical procurement mix between new-build and retrofit, and observed contract bundling patterns (system purchase versus sustainment). For forecasting, scenario analysis is used to reflect budget timing, program slippages, and accelerated procurement periods, and the scenarios are weighted using expert consensus gathered in interviews. Where a bottom-up roll-up has gaps, we fill the whitespace using proxy programs and regional procurement intensity, followed by a consistency check against the top-down demand pool.
Data Validation & Update Cycle
Outputs are validated through triangulation across independent signals, including procurement announcements, budget lines, trade patterns for relevant sensor categories, and observed platform modernization cycles. If a region shows an unusual jump, we recheck the drivers, revisit assumptions, and re-contact experts when the variance cannot be explained by known awards or delivery timing.
Before sign-off, the model goes through multi-step analyst review where inputs, calculations, and currency assumptions are checked, followed by a final read for narrative and number consistency. Reports are refreshed annually, and interim updates are made when material events occur (large awards, policy shifts, or major delivery delays). Right before delivery, a fresh pass is completed so the client receives the latest updated view.
Mordor Intelligence's Target Acquisition Systems Market Sizing Compared With Other Published Estimates
Different published market values can look inconsistent because groups do not count the same things, and they also select different base years and forecast windows. In defense electronics, the biggest swings usually come from how upgrades and sustainment are treated, and whether adjacent sensor categories get folded into the same bucket.
The key gap drivers are typically the contract boundary used for inclusion, how bundled awards are split across subsystems, the treatment of retrofit kits versus factory-fit systems, and the method used for ASP movement over time (flat pricing versus escalation with content growth). Currency conversion timing and refresh cadence also matter, because defense awards and delivery schedules can shift within a year, which then changes what is recognized as market value.
Benchmark comparison
| Source | Market Size | Gaps in Research Methodology |
|---|---|---|
| Mordor Intelligence | USD 15.11 B (2026) | |
| Global Consultancy A | USD 15.07 B (2024) | Uses a 2024 base year and a platform view that can pull in broader sensing spend, which changes comparability when upgrade-heavy programs are recognized earlier or later. |
| Market Tracker B | USD 14.85 B (2024) | Anchors the model on a 2024 base and may apply a wider process definition that can blend standalone sensors with full system packages, and it also applies a different forecast window. |
The table shows that the spread is driven more by year choice and what gets counted as a system than by math differences, and in Mordor Intelligence's model the 2026 value is tied to delivered target acquisition system packages across land, airborne, and naval platforms rather than a broader sensing spend pool. Once the scope is kept consistent and the timing of program value recognition is aligned, the remaining variance becomes small and easier for decision-makers to explain internally.
Key Questions Answered in the Report
What is the current size of the target acquisition systems market?
The market is valued at USD 15.11 billion in 2026 and is projected to reach USD 20.24 billion by 2031 at a 6.02% CAGR.
Which platform segment is expanding fastest?
Airborne systems post the highest 8.07% CAGR through 2031 as forces seek continuous, wide-area surveillance.
Why are multi-sensor fusion suites gaining traction?
They merge radar, EO/IR, laser and other inputs through AI processing, boosting detection accuracy and shrinking false-alarm rates compared with single-sensor setups.
Which region offers the most growth potential?
Asia-Pacific leads with a 7.70% CAGR, fueled by record defense budgets in China, Japan and India.
How are counter-UAS requirements shaping demand?
Layered drone defenses require integrated detection layers, driving rapid procurement of systems such as Teledyne FLIR’s Cerberus XL and related software-defined radars.