
Market Overview
| Study Period | 2020 - 2031 |
|---|---|
| Forecast Data Period | 2026 - 2031 |
| Base Year Market Size (2025) | USD 0.56 Billion |
| Market Size (2026) | USD 0.68 Billion |
| Market Size (2031) | USD 1.83 Billion |
| Growth Rate (2026 - 2031) | 21.89 % |
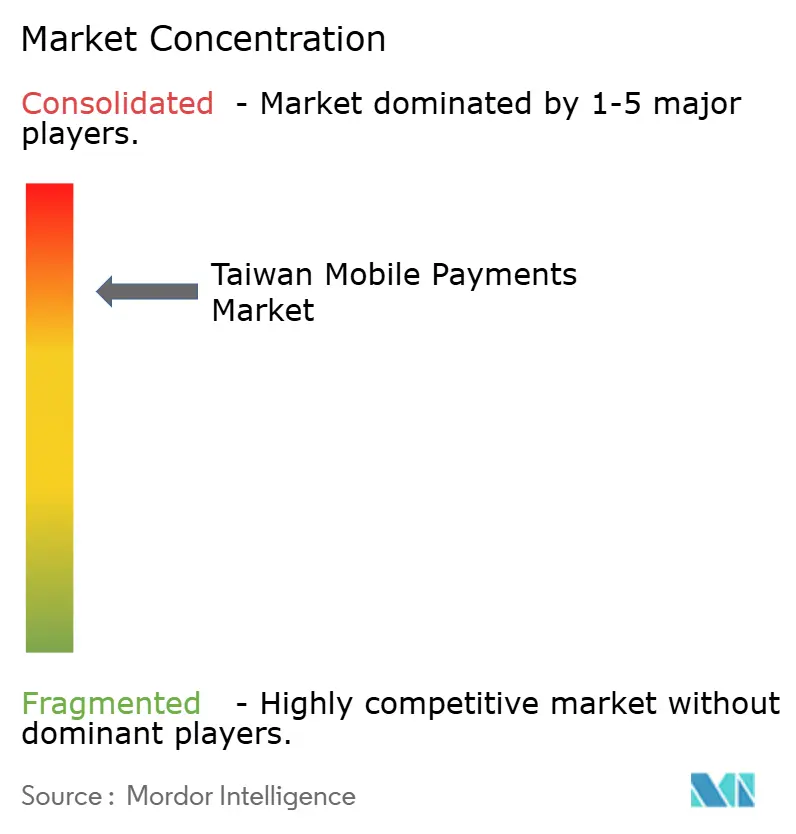
| Market Concentration | High |
Major Players *Disclaimer: Major Players sorted in no particular order Image © Mordor Intelligence. Reuse requires attribution under CC BY 4.0. | |
Taiwan Mobile Payments Market Analysis by Mordor Intelligence
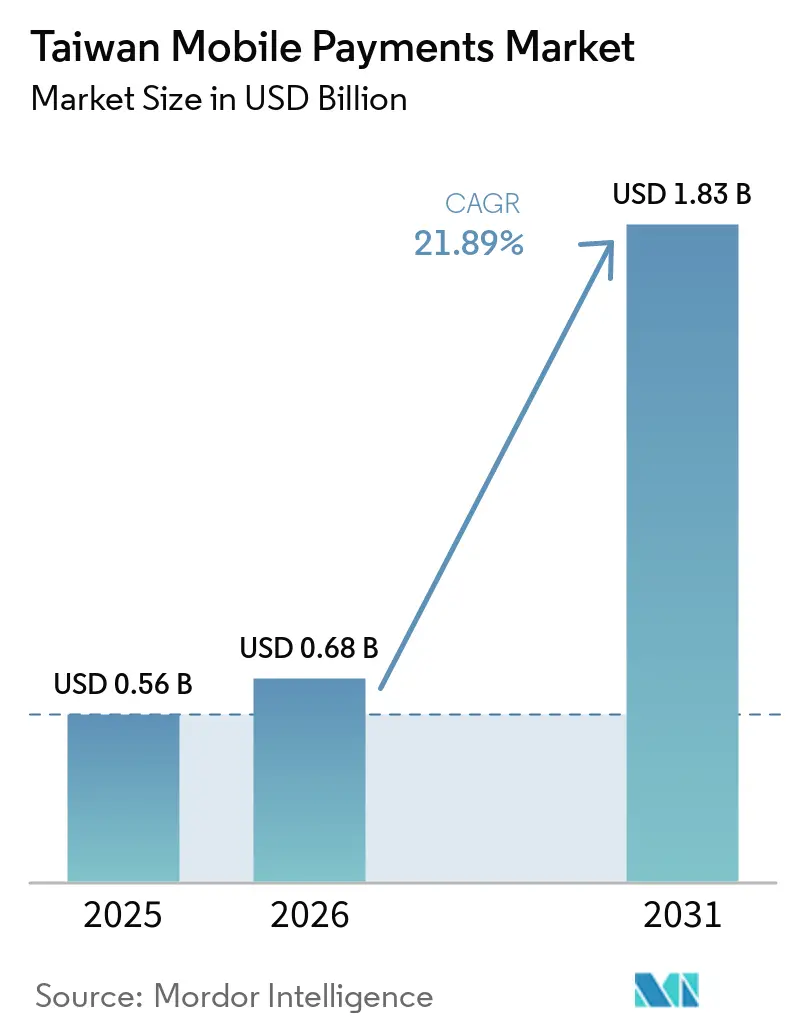
The Taiwan mobile payments market size is expected to increase from USD 0.56 billion in 2025 to USD 0.68 billion in 2026 and reach USD 1.83 billion by 2031, growing at a CAGR of 21.89% over 2026-2031. The surge is propelled by the Executive Yuan’s 90% penetration mandate, real-time settlement rails that slash clearing delays, and open‐API frameworks that let any consumer app trigger payments. Fast broadband coverage, near-universal smartphone ownership, and cross-wallet QR interoperability have broadened use cases beyond e-commerce into transit, bill pay, and peer transfers. Wallet operators are embedding loyalty programs to increase stickiness, while virtual banks and card networks are collapsing QR, NFC, and account-to-account modalities into single merchant endpoints. Competitive intensity remains high, yet the market’s structural tailwinds and supportive regulation continue to expand addressable volumes.
Key Report Takeaways
- By payment instrument, mobile wallets held a 47.83% share of Taiwan's mobile payments market in 2025, whereas instant account-to-account transfers are poised to grow at a 22.73% CAGR through 2031.
- By transaction channel, e-commerce accounted for a 47.83% share of the Taiwan mobile payments market size in 2025, while cross-border and tourist payments are forecast to post an 23.63% CAGR to 2031.
- By payment type, remote payments captured 67.72% of the Taiwan mobile payments market in 2025 and will continue to expand at a 22.73% CAGR as mobile-first checkout flows reduce cart abandonment.
- By end-user industry, retail and fast-moving consumer goods led with a 34.72% revenue share in 2025, whereas hospitality and tourism are projected to register the fastest CAGR at 25.62% through 2031.
Note: Market size and forecast figures in this report are generated using Mordor Intelligence’s proprietary estimation framework, updated with the latest available data and insights as of January 2026.
Market Trends and Insights
Drivers Impact Analysis of Taiwan Mobile Payments Market*
| Driver | (~) % Impact on CAGR Forecast | Geographic Relevance | Impact Timeline |
|---|---|---|---|
| Government target of 90% mobile-payment penetration by 2025 | +3.2% | National, with early gains in Taipei, New Taipei, Taichung, Tainan, Kaohsiung, Taoyuan | Short term (≤ 2 years) |
| Growing QR-code acceptance for public transport and utilities | +2.8% | National, accelerated rollout in Taipei Metro, Kaohsiung MRT, intercity bus networks | Medium term (2-4 years) |
| Integration of e-wallets with loyalty ecosystems (e.g., "mo coins") | +2.4% | National, strongest in urban retail clusters and convenience-store chains | Medium term (2-4 years) |
| Booming e-commerce and omnichannel retail incentives | +3.5% | National, concentrated in Taipei, New Taipei, Taichung metropolitan areas | Short term (≤ 2 years) |
| Cross-border TWQR and real-time RTP rollout boosting tourist spend | +2.1% | National, with spillover to Hualien, Taitung, Kenting tourist corridors | Medium term (2-4 years) |
| Rise of virtual banks and open-API rails enabling embedded payments | +2.9% | National, led by LINE Bank, Rakuten Bank, NEXT Bank digital-native user bases | Long term (≥ 4 years) |
| Source: Mordor Intelligence | |||
Government Target of 90% Mobile-Payment Penetration by 2025
Continuous policy pressure accelerated wallet onboarding, pushing electronic-payment accounts to 34.81 million in October 2025, a 15.8% year-on-year rise.[1] Ministries digitized tax, utilities, and transit fees, while the National Credit Card Center introduced unified TWQR acceptance standards that let night-market stalls and rural cooperatives process multiple wallets on one terminal. The initiative boosted account openings but not all registrants transact regularly, signaling a second-wave challenge of fostering habitual use.
Growing QR-Code Acceptance for Public Transport and Utilities
Taipei Metro’s January 2026 launch of QR ticketing allows commuters to scan wallets at turnstiles, eliminating physical stored-value cards.[2] iPASS Corporation had already extended TWQR to Kaohsiung MRT and inter-city buses in March 2025. Utilities quickly followed, with Taiwan Power and Taiwan Water integrating LINE Pay and JKOPay bill settlement portals. Daily essential use cases reinforce wallet frequency and shrink cash reliance.
Integration of E-Wallets with Loyalty Ecosystems
Retailers now let shoppers earn and redeem points, such as momo “mo coins”, inside wallet apps, creating a closed loop that merges physical and digital shopping. Convenience-store chains leverage large footprints to funnel traffic into their proprietary wallets, increasing visit frequency and retention. The model strengthens network effects but sustains subsidy costs, pressuring operating margins for pure-play fintechs.
Booming E-Commerce and Omnichannel Retail Incentives
Online retail hit NTD 313.9 billion (USD 9.6 billion) in H1 2024, with mobile accounting for 60% of orders. Merchants promote buy-online-pick-up-in-store discounts and wallet-linked cashback to boost conversion rates, while livestream sellers embed one-click payment links that keep viewers in social media feeds. Aggregated API gateways simplify integration, enabling smaller merchants to accept wallets, cards, and bank transfers through a single contract.
Restraints Impact Analysis of Taiwan Mobile Payments Market*
| Restraint | (~) % Impact on CAGR Forecast | Geographic Relevance | Impact Timeline |
|---|---|---|---|
| Persistent cash preference in rural/elderly cohorts | -2.1% | Non-municipal regions, rural townships, elderly-concentrated districts | Long term (≥ 4 years) |
| Tight profitability and high subsidy burn among wallet operators | -1.8% | National, affecting all licensed electronic-payment institutions | Medium term (2-4 years) |
| Fragmented QR standards - merchant integration complexity | -1.4% | National, acute in small and medium enterprises, traditional markets | Medium term (2-4 years) |
| Heightened regulatory scrutiny on wallet diversification (e.g., JKO funds) | -1.2% | National, concentrated among operators seeking wealth-management licenses | Short term (≤ 2 years) |
| Source: Mordor Intelligence | |||
Persistent Cash Preference in Rural and Elderly Cohorts
Only 7% of September 2025 credit-card volume occurred outside the six largest municipalities, underscoring lagging rural adoption. Infrastructure gaps, limited digital literacy, and trust issues keep cash dominant among citizens over 65. Government programs such as the 2025 NTD 10,000 cash handout nudged many seniors online, yet converting dormant accounts into active payment users requires ongoing education, larger font interfaces, and merchant subsidies.
Tight Profitability and High Subsidy Burn Among Wallet Operators
Taiwan hosts 29 licensed electronic-payment institutions, all battling for share in a low-fee environment regulated by the Financial Supervisory Commission. Heavy cashback and discount campaigns acquire users but erode margins, prompting some wallets to pursue higher-yield services. Regulatory blocks on unapproved wealth-management products, evidenced by JKOPay’s 2025 equity restructuring, limit diversification pathways and may catalyze sector consolidation.
*Our forecasts treat driver/restraint impacts as directional, not additive. The impact forecasts reflect baseline growth, mix effects, and variable interactions.
Taiwan Mobile Payments Market Segment Analysis
By Payment Instrument:
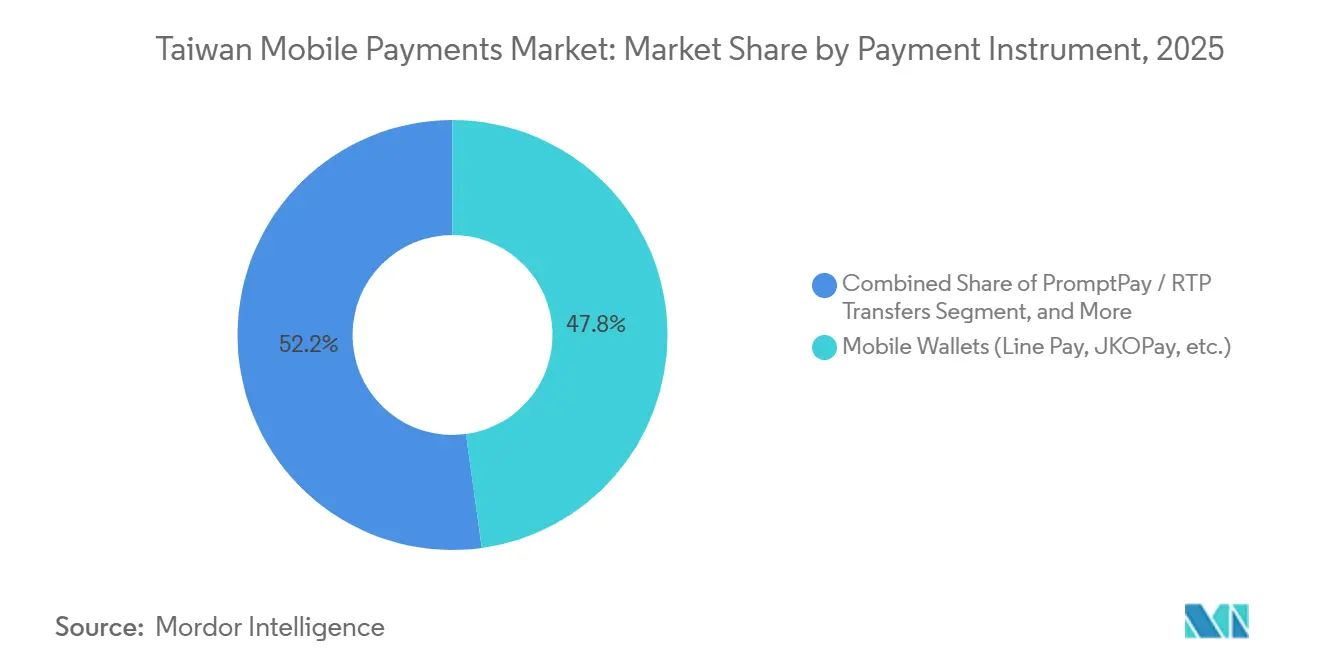
Instant Settlement Reshapes Wallet DynamicsMobile wallets controlled 47.83% of the Taiwan mobile payments market in 2025, yet bank-initiated real-time transfers are forecast to expand at an 22.73% CAGR through 2031 as CIFS infrastructure processes more than 260 million TWQR transactions each year.[3] The convergence of QR, NFC, and account-to-account rails lets merchants run a single terminal across multiple schemes, reducing hardware costs.
PromptPay-style RTP hooks embedded in everyday banking apps remove the need to pre-fund stored-value accounts, improving float economics. Card-token solutions such as Apple Pay and Google Pay remain attractive to users unwilling to spread balances across multiple wallets; their growth is largely additive rather than cannibalistic. As LINE Pay’s December 2025 overhaul enables direct bank debit, wallet operators increasingly resemble payment-initiation service providers rather than float-holding institutions, easing capital requirements while boosting transaction ceilings.

By Transaction Channel:
Cross-Border Corridors Unlock Tourist SpendE-commerce garnered 47.83% share in 2025, but cross-border and tourist transactions are expected to climb at an 23.63% CAGR to 2031 as TWQR gains interoperability with South Korea’s BC Card and Visa Cloud-Based Payments. Inbound tourism receipts recovered to USD 10.028 billion in 2024, and real-time settlement ensures merchants receive funds instantly, making QR code acceptance attractive for small hotels and restaurants.
Unified QR gateways, such as Alipay+, enable retailers to reach 1.8 billion potential visitors using their home-country wallets. Domestic commuters reinforce daily volume: Taipei Metro’s January 2026 QR rollout and SoftPOS smartphone terminals in traditional markets broaden acceptance without costly hardware, closing rural gaps and deepening everyday usage.
By Payment Type:
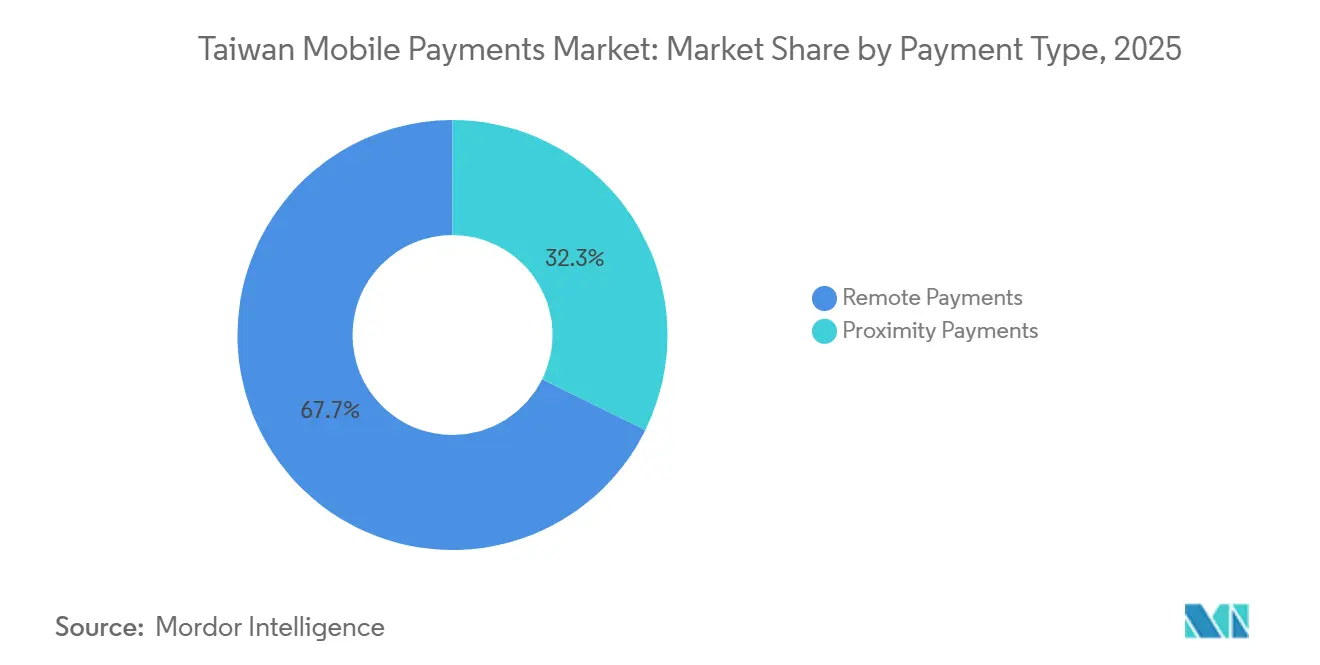
Remote Dominance Mirrors Mobile-First CommerceRemote payments accounted for 67.72% of the Taiwan mobile payments market in 2025, and they are forecast to expand at an 22.73% CAGR through 2031 as one-click authentication in shopping, social, and messaging apps removes friction. Smartphone access is significant across the population, ensuring near-ubiquitous reach.
Proximity payments will remain vital for transit, grocery, and quick-service retail, especially once Taipei Metro activates credit card tap-and-go in 2026. Yet the structural tilt toward mobile-commerce and peer-to-peer transfers secures enduring dominance for remote flows, with proximity usage serving as a high-frequency complement rather than the primary engine of transaction value.
By End-User Industry:
Hospitality Surges as Travel ReboundsRetail and FMCG supplied 34.72% of 2025 revenue, leveraging convenience-store ecosystems that funnel daily spend into proprietary wallets. President Chain Store’s icash Pay and PX Mart’s PXPay Plus illustrate how large retailers bind payments to loyalty, guaranteeing repeat traffic.
Hospitality and tourism, however, is projected to register an 25.62% CAGR to 2031 as QR interoperability lets visitors pay with their domestic wallets and local businesses receive instant local-currency settlement. The Central Bank’s real-time infrastructure decreases chargeback risk, accelerating adoption by smaller accommodation and dining operators. Transportation, utilities, and emerging sectors such as education inch forward on specialized use cases, but tourism-related categories set the briskest pace.
Geography Analysis
Taipei, New Taipei, Taichung, Tainan, Kaohsiung, and Taoyuan together accounted for 93.87% of credit card transaction value in September 2025, reflecting superior terminal density, higher disposable income, and younger demographics. Rural townships lack both QR hardware and merchant training, and older residents remain wary of digital payments. The National Credit Card Center began rolling out subsidized TWQR readers in traditional markets and fishing harbors in 2023, yet uptake is incremental.
Despite these disparities, nationwide internet coverage reaches 96.7%, and mobile subscriptions equal 127% of the population, meaning infrastructure constraints are more about last-mile merchant equipment than network availability. Government cash-rebate programs require online enrollment, nudging rural citizens to open e-payment accounts even if daily activity lags.
Cross-border linkages enhance regional clout; for example, TWQR’s tie-up with BC Card allows Korean tourists to pay in won, while Visa’s November 2024 LINE Pay integration extends acceptance across Southeast Asia. Reciprocal arrangements with Japan’s Bank of the Ryukyus let EasyWallet users tap Okinawa terminals and Japanese visitors scan TWQR. Immediate settlement cushions foreign-exchange exposure for merchants and positions Taiwan as a cash-light tourism hub.
Regulatory Landscape
Taiwan regulates mobile payments under a split framework. The Financial Supervisory Commission (FSC) oversees Electronic Payment Institutions under the Act Governing Electronic Payment Institutions (last modified October 11, 2024) and related rules for electronic payment business, while the Ministry of Digital Affairs (MoDA) supervises third-party payment enterprises with tighter anti-fraud and AML-oriented requirements introduced in 2024. This structure affects licensing, allowable business scope, and compliance burden for wallet operators, PSPs, and platform-based payfac models.
Interoperability is anchored in national payment rails. The Central Bank of the Republic of China (Taiwan) promotes TWQR as the common QR code standard, and TWQR Inbound was launched by FISC at the end of April 2026 to enable foreign tourists using overseas wallets (including Japan and Singapore schemes) to pay at TWQR-enabled merchants in Taiwan. On the merchant side, the Ministry of Finance extended mobile-payment-related tax incentives for assessed small businesses through December 31, 2028, supporting continued QR acceptance among micro-merchants and traditional retail.
Value Chain Analysis
The value chain begins with rule-setting and shared infrastructure, led by the Central Bank and FSC, and implemented through industry utilities such as Financial Information Service Co. (FISC), which operates shared clearing and interoperability platforms for TWQR. Upstream enablers include identity and security controls (AML/KYC, fraud prevention) enforced across electronic payment institutions and third-party payment providers, while MoDA requirements add additional registration and compliance steps for non-bank payment players.
In the midstream, wallet operators, banks, and card networks connect to merchants via acquirers, aggregators, and gateway providers that package QR, NFC, and account-to-account payment initiation into a single merchant acceptance flow. TWQR merchant coverage scaled to about 678,000 participating merchants by end-2025, and cross-border extensions such as the April 2026 cooperation involving TBCASoft, FISC, and E.SUN Bank (enabling Japan PayPay users at TWQR merchants) show how scheme operators and technical networks monetize the installed base. Downstream, adoption is reinforced by high-frequency categories (transit, utilities, convenience retail) and by inbound and outbound travel corridors, while key bottlenecks remain merchant onboarding costs, subsidy economics, and compliance overhead.
Competitive Landscape
Taiwan has 29 licensed e-payment institutions under the oversight of the Financial Supervisory Commission. LINE Pay, JKOPay, PXPay Plus, and iPASS Money jointly retained most of wallet users in 2025, yet none secured sustainable profit because consumer acquisition still hinges on cashback and fee waivers. LINE Pay leverages 12 million chat users for in-app commerce, PXPay Plus taps PX Mart’s 1,100 supermarkets for loyalty-tethered grocery spend, and iPASS Money rides Kaohsiung MRT’s rider base.
Global card networks are embedding QR code functionality atop existing NFC infrastructure, so one countertop reader can capture tap or scan, a boon for smaller retailers with limited hardware budgets. Virtual banks offer open APIs that let ride-hailing or food-delivery platforms trigger payment directly from customer accounts, raising competitive stakes for traditional issuers.
Regulatory firmness shapes strategy. JKOPay’s July 2025 equity restructuring underscored the need for vigilance in governance and fund diversification. New fraud-prevention statutes require stronger identity verification, raising compliance costs but elevating entry barriers. As subsidy fatigue mounts, mid-tier wallets may merge or exit, while larger ecosystems deepen vertical integrations around retail, social media, and transportation.
Taiwan Mobile Payments Industry Leaders
-
LINE Pay Corporation
-
Apple Inc. (Apple Pay)
-
JKOPay Co., Ltd.
-
Taiwan Mobile Payment Co., Ltd. (Taiwan Pay)
-
Alphabet Inc. (Google Pay)
- *Disclaimer: Major Players sorted in no particular order
Taiwan Mobile Payments Market Companies Covered in this Report
- Financial Information Service Co., Ltd. (FISC)
- Boku, Inc.
- Stripe, Inc.
- Adyen N.V.
- Worldline S.A.
- Visa Inc.
- Mastercard Incorporated
- American Express Company
- JCB Co., Ltd.
- UnionPay International Co., Ltd.
- LINE Pay Corporation
- JKOPay Co., Ltd.
- PX Mart Co., Ltd. (PXPay Plus)
- Taiwan Mobile Payment Co., Ltd. (Taiwan Pay)
- EasyCard Corporation (EasyWallet)
- iPASS Corporation (iPASS Money)
- President Chain Store Corp. (icash Pay)
- Apple Inc. (Apple Pay)
- Alphabet Inc. (Google Pay)
- Samsung Electronics Co., Ltd. (Samsung Pay)
- Ant Group Co., Ltd. (Alipay)
- Tencent Holdings Ltd. (WeChat Pay)
Market Opportunities and Future Outlook
Cross-border QR acceptance is the most immediate whitespace built on existing TWQR merchant density and the rollout of inbound enablement. The end-April 2026 launch of TWQR Inbound by FISC, which connects overseas wallets (including Japan and Singapore schemes) to TWQR-enabled merchants, gives tourist-heavy merchants (hospitality, attractions, and transport-adjacent retail) a commercialization path beyond cash or card-only acceptance. It also creates a use case for payment service providers that offer a unified checkout for merchants looking for one QR endpoint for domestic wallets and inbound travelers.
Micro-merchants and assessed small businesses represent a structural opportunity as policy reduces friction for digital acceptance. The Ministry of Finance extension of mobile-payment tax incentives for assessed taxpayers through December 31, 2028 supports continued conversion of traditional markets and small storefronts to QR payments, while TWQR adoption across hundreds of thousands of merchants lowers integration complexity for new entrants. On the product layer, shared platforms maintained by FISC that already support shopping, tax, and utility payments provide a base for embedded payment initiation and value-added layers (merchant analytics, loyalty linkages, and reconciliation services) without requiring each wallet to build standalone acceptance infrastructure.
Recent Industry Developments in Taiwan Mobile Payments Market
- July 2026: Taipei Metro began accepting contactless credit cards and mobile wallets (including Apple Pay, Google Pay, and Samsung Pay) at metro gates. This expands daily, high-frequency use cases for open-loop mobile wallets and increases the importance of seamless tokenized payment performance in transit environments.
- May 2026: LINE Pay Taiwan expanded cross-border acceptance in South Korea through partnerships such as enabling LINE Pay at OLIVE YOUNG locations and adding online payment acceptance via Lotte Duty Free. The move strengthens outbound-travel spend capture and raises competitive pressure on domestic wallets that lack international merchant alliances.
- January 2026: JKOPay was integrated into Xsolla Pay Station, adding JKOPay as a payment option for global game developers and publishers selling into Taiwan. This improves conversion for digital goods and subscriptions by offering local wallet rails within an international payments aggregator.
Taiwan Mobile Payments Market Report Scope and Research Methodology
Market Definition and Coverage
This market covers the value generated from mobile payment transactions carried out in Taiwan using smartphones or other mobile devices, where the payment is initiated and authorized through an app or wallet and settles through accepted payment rails.
Scope exclusions: We exclude cash payments, paper vouchers, and pure card-present transactions that do not involve a mobile initiation step.
Segments Covered in This Report
- By Payment Instrument
- PromptPay / RTP Transfers
- Mobile Wallets (Line Pay, JKOPay, etc.)
- Card-based Mobile Payments
- Carrier Billing / Others
- By Transaction Channel
- In-store POS
- E-commerce
- P2P Transfers
- Bill and Government Payments
- Cross-border / Tourist
- By Payment Type
- Proximity Payments
- Remote Payments
- By End-User Industry
- Retail and FMCG
- Transportation and Mobility
- Hospitality and Tourism
- Utilities and Telecom
- Healthcare and Education
- Other End-User Industries
Data Sources, Market Sizing, and Validation
Desk Research
Desk work started by mapping the main payment rails and adoption signals in Taiwan, and then linking them back to value creation in mobile payment flows. We reviewed public statistics and disclosures from sources such as Taiwan's central bank, the Financial Supervisory Commission, the Ministry of Economic Affairs, and open datasets that track population, smartphone usage, and retail sales trends.
To keep assumptions realistic, we also used company annual reports, investor decks, and reputable local business press to understand wallet expansion, merchant acceptance, and promotional intensity. In parallel, we referenced paid subscriptions for company financials and news, and a patent database to spot where authentication and wallet features were evolving. These desk research sources are illustrative rather than exhaustive, since we checked many other documents for data capture, cross-verification, and clarification.
Primary Interviews and Surveys
Interviews and surveys with payment providers, merchant-side users, financial institutions, technology specialists, and distribution partners in Taiwan help clarify how mobile payment shares differ by channel. Respondents also provide checks on average ticket values, transaction behavior, and gaps in secondary data before the estimates are finalized.
Distribution of primary research fieldwork respondents
| Company type | Respondent position |
|---|---|
| Top tier: 28% | CXOs: 15% |
| Mid tier: 47% | Functional/Unit leaders: 32% |
| Smaller Players: 25% | Managers: 53% |
Market-Sizing & Forecasting
Sizing relied on a top-down build where payments activity in Taiwan was reconstructed from adoption and usage indicators, and then narrowed to mobile-initiated transactions through channel splits and wallet penetration inputs. To keep totals grounded, we corroborated results with selective bottom-up checks, such as sampling typical merchant discount rate ranges, using wallet take-rate logic where relevant, and comparing volume by use case as described by interviewees.
Key inputs used in the model included mobile payment user penetration, active usage frequency, average transaction size, merchant acceptance density, and the shift in transaction mix between in-store QR or NFC and remote in-app checkout. Where direct splits were not consistently published, we applied conservative ranges and then tightened them through interview-based validation so gaps did not inflate the addressable value.
Forecasts were produced using scenario analysis because near-term growth in Taiwan is sensitive to promotion cycles, regulatory guidance, and merchant onboarding pace. Each scenario was stress-tested against expected changes in the smartphone base, retail and e-commerce activity, and the likely normalization of incentives over the forecast window.
Data Validation & Update Cycle
Outputs were cross-checked against independent signals such as reported mobile payment adoption statistics, public payments reporting, and directional wallet activity statements, and then reviewed for year-to-year jumps that did not match known market events. When variances appeared, we revisited assumptions and triggered follow-up questions with relevant respondents to confirm whether the change came from scope, channel mix, or pricing.
Before sign-off, the model is reviewed in multiple analyst steps so that definitions, currency handling, and growth math remain consistent across time series. Reports are refreshed annually, and interim updates are made when material events occur, followed by a final pre-delivery review to ensure clients receive the latest view.
Mordor Intelligence's Taiwan Mobile Payments Market Sizing Compared With Other Published Estimates
Published numbers for Taiwan mobile payments often differ because each publisher defines the market in its own way, then applies different assumptions on what is counted as value. Differences usually come from whether the estimate reflects provider revenues versus transaction value, how in-store versus online usage is split, and how quickly assumptions are refreshed after policy or pricing changes.
The main gap comes from mixing transaction value style estimates with revenue-style sizing, where Mordor Intelligence counts only the monetized value tied to mobile-initiated payment flows and avoids folding in the full pass-through payment amount that merchants and consumers transact.
Benchmark comparison
| Source | Market Size | Gaps in Research Methodology |
|---|---|---|
| Mordor Intelligence | USD 0.68 B (2026) | |
| Industry Research Publisher A | USD 0.65 B (2024) | Reported figure is tied to a different base year and the definition of market size is not clearly stated (revenue versus transaction value), which can compress or expand the number when compared to a monetized-value approach. |
| Digital Payments Publisher B | USD 34.53 B (2024) | This estimate is for fintech-enabled mobile POS payments and appears closer to transaction value or a broader POS payment pool, which is a wider scope than mobile payments revenue tied to wallet-led initiation. |
Across the three figures, the spread is best explained by scope and measurement choice rather than a true disagreement on adoption direction. When the definition is kept consistent and inputs like usage frequency, ticket size, and channel mix are validated through interviews, the resulting market value stays traceable to repeatable steps and is easier to compare across years.
Key Questions Answered in the Report
How big is the Taiwan mobile payments market today and how fast is it expanding?
The Taiwan mobile payments market size is expected to increase from USD 0.56 billion in 2025 to USD 0.68 billion in 2026 and reach USD 1.83 billion by 2031, growing at a CAGR of 21.89% over 2026-2031.
Which payment instruments are growing the quickest in Taiwan?
Real-time account-to-account transfers inside banking apps are projected to grow at an 22.73% CAGR through 2031, gradually closing the gap with mobile wallets.
What drives everyday use of mobile wallets among Taiwanese consumers?
QR ticketing for metro and bus rides, utility bill pay integrations, and loyalty-point redemption at convenience stores embed wallets into daily routines and lift transaction frequency.
Why is cross-border QR acceptance important for Taiwan?
Partnerships with South Korea’s BC Card and Visa Cloud-Based Payments let tourists pay with their home wallets, instantly settling funds for local merchants and boosting visitor spend.
What challenges limit mobile payment uptake outside major cities?
Rural areas face fewer QR terminals and an older population still prefers cash, so penetration lags despite nationwide internet coverage and government incentives.